. 2019 Feb 1;39(2):BSR20181523.
doi: 10.1042/BSR20181523. Print 2019 Feb 28.

MiR-384 induces apoptosis and autophagy of non-small cell lung cancer cells through the negative regulation of Collagen α-1(X) chain gene

Affiliations

MiR-384 induces apoptosis and autophagy of non-small cell lung cancer cells through the negative regulation of Collagen α-1(X) chain gene

Qingkui Guo et al. Biosci Rep. .

Abstract

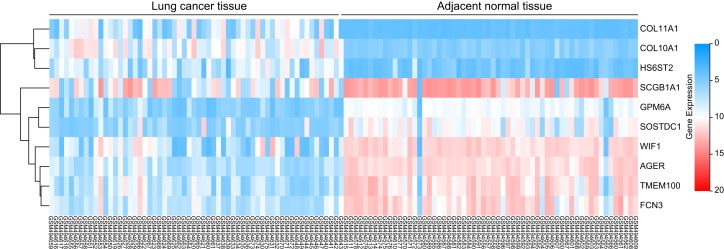
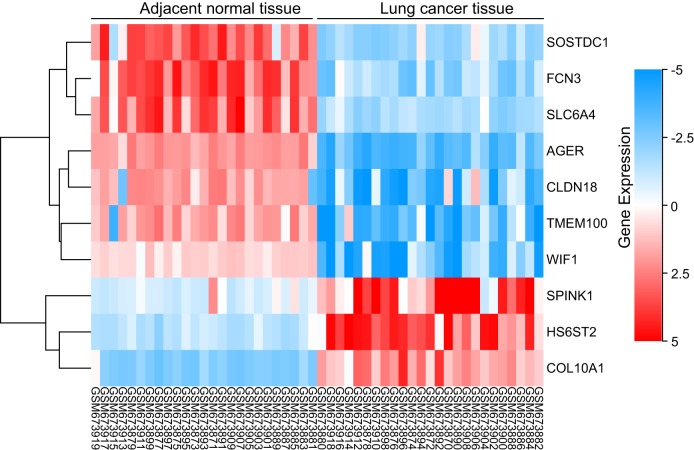
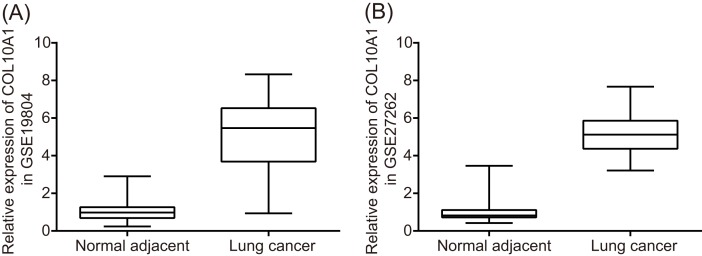
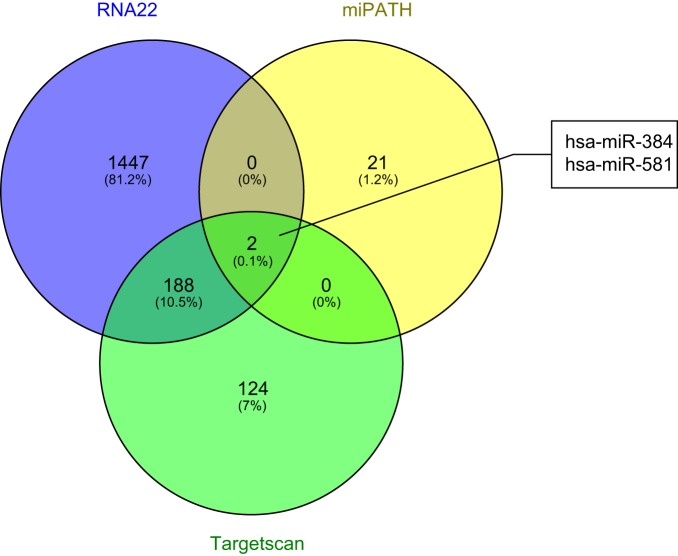
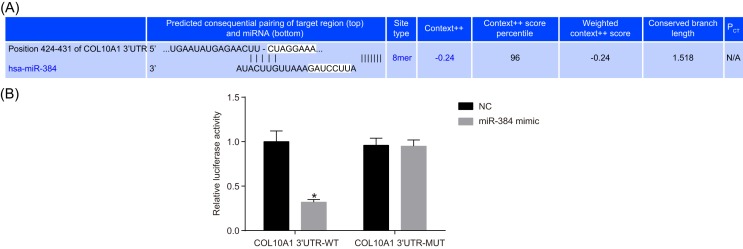
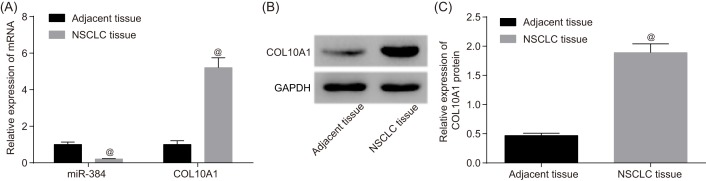
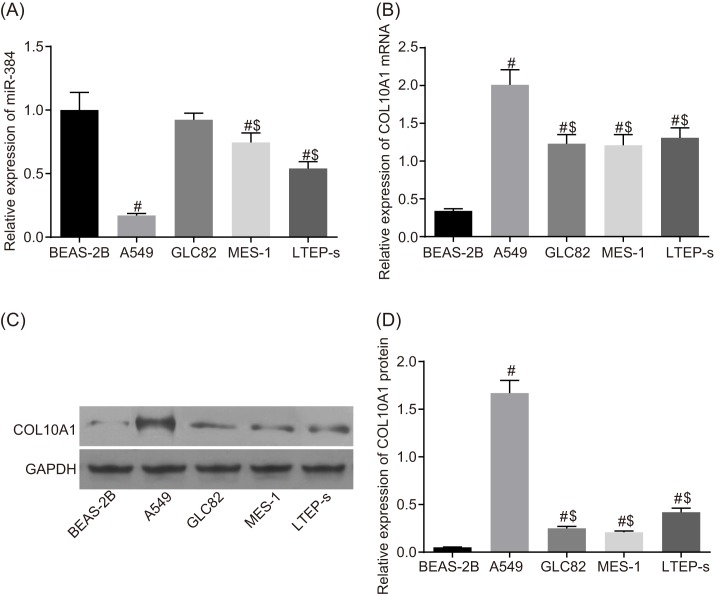
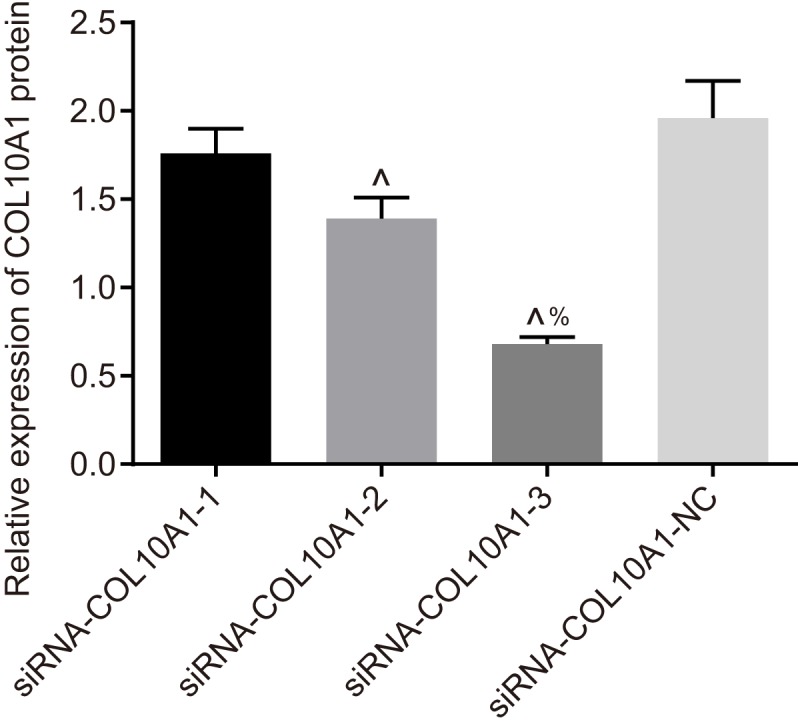
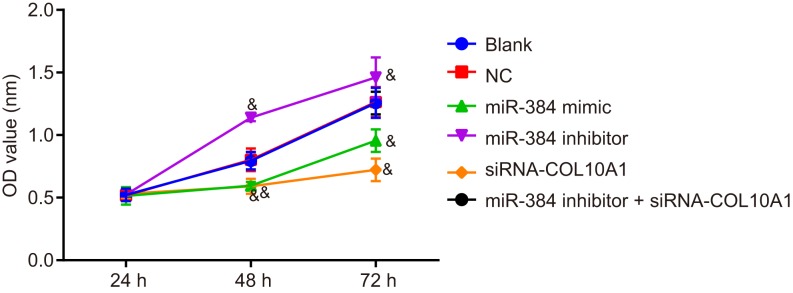
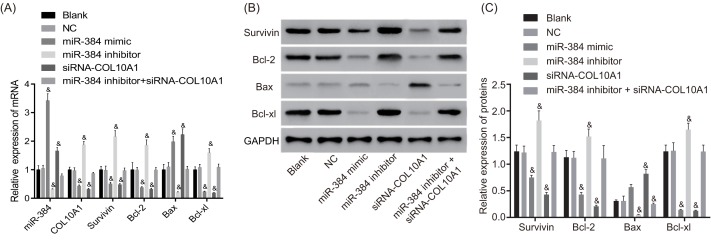
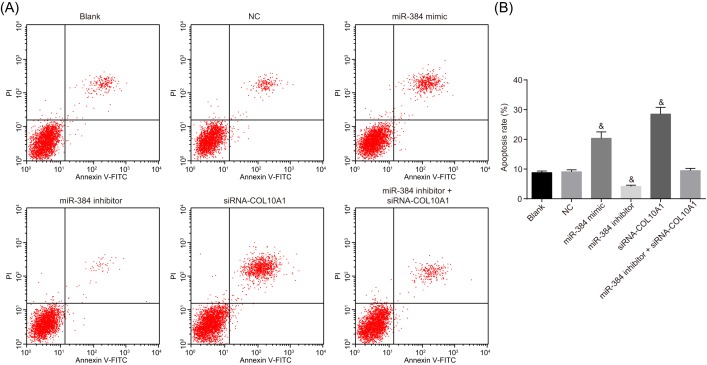
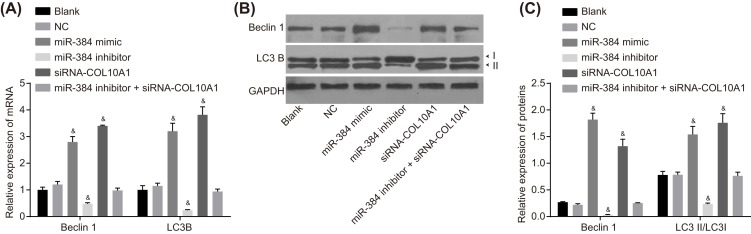
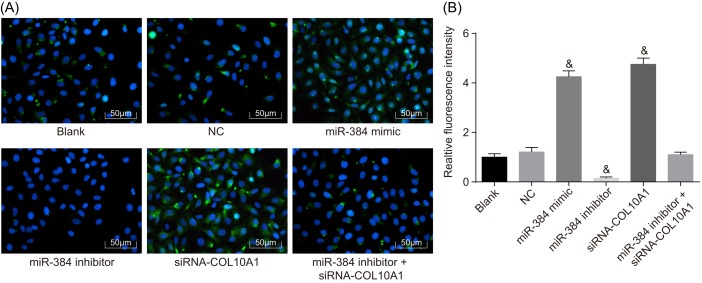
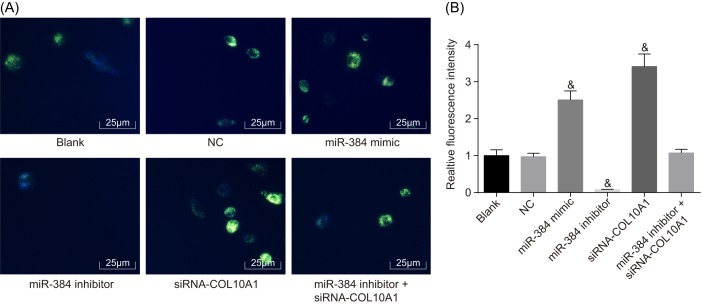
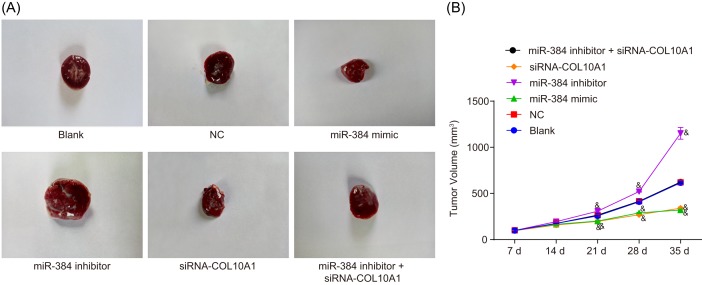
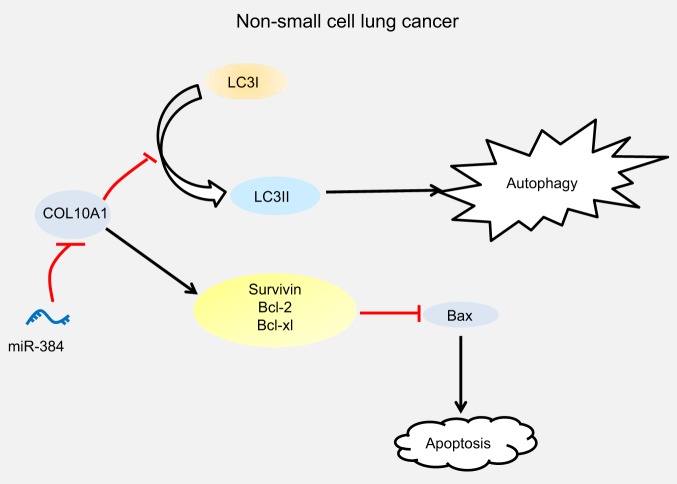
The present study aims to investigate the mechanism of miR-384 in non-small cell lung cancer (NSCLC) cell apoptosis and autophagy by regulating Collagen α-1(X) chain (COL10A1). Bioinformatics methods were applied to evaluate potential miRNAs and genes that might correlate with NSCLC. Tumor tissues and adjacent tissues from 104 NSCLC patients were collected and human NSCLC A549 cell line was selected for subsequent experiments. A549 cells were treated with miR-384 mimic, miR-384 inhibitor, or knockdown of COL10A1. Quantitative real-time PCR (qRT-PCR) and Western blotting were utilized to detect the levels of miR-384, COL10A, Survivin, Bcl-2, Bax, Bcl-xl, Beclin 1, and LC3 in tissues and cells. A series of biological assays including MTT assay, Annexin V-FITC/PI (propidium iodide) staining, immunofluorescence, monodansylcadaverine (MDC) staining were conducted to investigate the effects of miR-384 and COL10A1 on NSCLC cells. Tumorigenicity assay for nude rats was applied. Results obtained from the present study indicated that miR-384 down-regulated COL10A1 by targetting it. Compared with adjacent tissues, miR-384 expression was obviously reduced while COL10A1 expression was significantly enhanced in NSCLC tissues (all P<0.05). Outcomes in vivo and in vitro suggested that cell proliferation and tumorigenicity were inhibited while cell apoptosis and autophagy were induced in NSCLC cells treated with up-regulation of miR-384 or silence of COL10A1. In miR-384 inhibitor group, cell proliferation was improved, while cell apoptosis was reduced and cell autophagy was decreased whereas tumorigenicity of cells was strengthened. Based on the findings of our study, it was established that miR-384 could down-regulate COL10A1 levels, subsequently inhibiting cell proliferation and promoting cell apoptosis and autophagy in NSCLC cells.

Keywords: COL10A1; Cell apoptosis; Cell autophagy; Non-small cell lung cancer; miR-384.


Conflict of interest statement

The authors declare that there are no competing interests associated with the manuscript.

Figures

Figure 1
Figure 1. Differentially expressed genes in GSE19804
The heat map showing ten differentially expressed genes on GSE19804 chip. The x-axis indicates the sample number, the y-axis shows the differentially expressed genes, and the right upper histogram is the color gradation. Each rectangle in the figure corresponds to an individual sample. The red and blue colors represent relatively high and low fold-change of expression, respectively.
Figure 2
Figure 2. Differentially expressed genes in GSE2726
The heat map showing ten differentially expressed gene on GSE2726 chip. The abscissa indicates the sample number, the ordinate indicates the difference gene, and the right upper histogram is the color gradation. Each rectangle in the figure corresponds to one sample expression. The red and blue colors represent relatively high and low fold-change of expression, respectively.
Figure 3
Figure 3. Expression of COL10A1 in microarrays
(A,B) Expression of COL10A1 in normal adjacent and lung cancer tissue indicated by GSE19804 and GSE2726 chip.
Figure 4
Figure 4. Prediction for upstream miRNA of COL10A1
Comparison of TargetScan, RNA22, and miRNApath on COL10A1 upstream miRNA, hsa-miR-384, and hsa-miR-581 were identified as the common miRNAs.
Figure 5
Figure 5. Verification for combination of miR-384 and COL10A1 by luciferase reporter gene assay
(A) Binding site of miR-384 on COL10A1. (B) The luciferase activity was detected after transfection for 48 h. Data are shown as mean ± S.D. and experiments were repeated three times. *, P<0.05 when compared with NC group.
Figure 6
Figure 6. miR-384 and COL10A1 expression in NSCLC tissues and adjacent tissues
(A) The relative mRNA expression of miR-384 and COL10A1 was detected using qRT-PCR. (B) Protein was isolated from NSCLC tissues and adjacent tissues and determined by Western blotting. (C) Quantitation of protein expression. Data are shown mean ± S.D. and experiments were repeated three times. @, P<0.05 when compared with adjacent tissues.
Figure 7
Figure 7. The expression of COL10A1 and miR-384 in NSCLC cells and pulmonary epithelial cells
(A) The relative expression of miR-384 was detected by qRT-PCR. (B) The relative mRNA expression of COL10A1 was detected by qRT-PCR. (C,D) The relative protein expression of COL10A1 was detected by Western blotting. Data are shown as mean ± S.D. and experiments were repeated three times. #, P<0.05 when compared with Control group; $, P<0.05 when compared with A549 group.
Figure 8
Figure 8. Level of COL10A1 protein interfered by different siRNAs
Data are shown as mean ± S.D. and experiments were repeated three times. , P<0.05 when compared with siRNA-COL10A1-NC. %, P<0.05 when compared with siRNA-COL10A1-2.
Figure 9
Figure 9. A549 cells vitality in each group
The cell activity was measured using MTT assay. Data are shown as mean ± S.D. and experiments were repeated three times, &, P<0.05 when compared with blank group.
Figure 10
Figure 10. Relative expressions of Survivin, Bcl-2, Bax, and Bcl-xl of A549 cells in each group
(A) Total RNA was collected after transfection for 48 h and mRNA expressions of Survivin, Bcl-2, Bax, and Bcl-xl in each group were measured using qRT-PCR. (B) Bands of above proteins. (C) Western blotting for protein expressions of NSCLC cells apoptosis-related factors including Survivin, Bcl-2, Bax, and Bcl-xl after transfection for 48 h. Data are shown as mean ± S.D. and experiments were repeated three times. &, P<0.05 when compared with blank group.
Figure 11
Figure 11. A549 cell apoptosis determined by Annexin V-FITC/PI staining
(A) Image output by flow cytometer; (B) cell apoptosis after transfection for 48 h was detected using Annexin V-FITC/PI double staining. Data are shown as mean ± S.D. and experiments were repeated three times. &, P<0.05 when compared with blank group.
Figure 12
Figure 12. Expressions of Beclin1 and LC3 in A549 cells
(A) Total RNA was extracted after transfection for 48 h. Beclin1 and LC3 mRNA expressions of A549 cell were detected using qRT-PCR. (B) Bands of above proteins. (C) Protein expressions of Beclin1, LC3II and LC3I in each group were detected by Western blotting. Data are shown as mean ± S.D. and experiments were repeated three times. &, P<0.05 when compared with blank group.
Figure 13
Figure 13. Expression of LC3II in A549 cells determined by immunofluorescence
(A) Image of LC3II by immunofluorescence (×200); (B) fluorescence intensity was detected 48 h after transfection. Data are shown as mean ± S.D. and experiments were repeated three times. &, P<0.05 when compared with blank group.
Figure 14
Figure 14. Autophagy in A549 cells was detected by MDC staining
(A) Fluorescence image of cell autophagy (×400); (B) formation of autolysosome was detected using MDC staining after transfection for 48 h. Data are shown as mean ± S.D. and experiments were repeated three times. &, P<0.05 when compared with blank group.
Figure 15
Figure 15. The volume of subcutaneous tumors in nude mice at different time points
(A) The tumor volume of nude mice in each group was measured at 35th day; (B) fold line diagram shows that the tumor volumes of nude mice gradually increase with the extension of time. Data are shown as mean ± S.D. and experiments were repeated three times. &, P<0.05 when compared with blank group.
Figure 16
Figure 16. Molecular mechanism of miR-384 down-regulating the level of COL10A1 to promote autophagy and apoptosis of NSCLC cells

Similar articles

Cited by

References

    1. Lin T.C., Lin P.L., Cheng Y.W., Wu T.C., Chou M.C., Chen C.Y.. et al. (2015) MicroRNA-184 deregulated by the microRNA-21 promotes tumor malignancy and poor outcomes in non-small cell lung cancer via targeting CDC25A and c-Myc. Ann. Surg. Oncol. 22, S1532–S1539 10.1245/s10434-015-4595-z - DOI - PubMed
    1. Kim K.H., Park T.Y., Lee J.Y., Lee S.M., Yim J.J., Yoo C.G.. et al. (2014) Prognostic significance of initial platelet counts and fibrinogen level in advanced non-small cell lung cancer. J. Korean Med. Sci. 29, 507–511 10.3346/jkms.2014.29.4.507 - DOI - PMC - PubMed
    1. Wolff H.B., Alberts L., Kastelijn E.A., Lissenberg-Witte B.I., Twisk J.W., Lagerwaard F.J.. et al. (2018) Differences in longitudinal health utility between stereotactic body radiation therapy and surgery in stage I non-small cell lung cancer. J. Thorac. Oncol. 13, 689–698 10.1016/j.jtho.2018.01.021 - DOI - PubMed
    1. Liu D., Nakashima N., Nakano J., Tarumi S., Matsuura N., Nakano T.. et al. (2017) Customized adjuvant chemotherapy based on biomarker examination may improve survival of patients completely resected for non-small-cell lung cancer. Anticancer Res. 37, 2501–2507 10.21873/anticanres.11591 - DOI - PubMed
    1. Giaj-Levra N., Ricchetti F. and Alongi F. (2016) What is changing in radiotherapy for the treatment of locally advanced nonsmall cell lung cancer patients? A review. Cancer Invest. 34, 80–93 10.3109/07357907.2015.1114121 - DOI - PubMed

Publication types

MeSH terms