. 2018 Nov 15;9(1):4791.
doi: 10.1038/s41467-018-07228-4.

Proteolysis of histidine kinase VgrS inhibits its autophosphorylation and promotes osmostress resistance in Xanthomonas campestris

Affiliations

Proteolysis of histidine kinase VgrS inhibits its autophosphorylation and promotes osmostress resistance in Xanthomonas campestris

Chao-Ying Deng et al. Nat Commun. .

Abstract

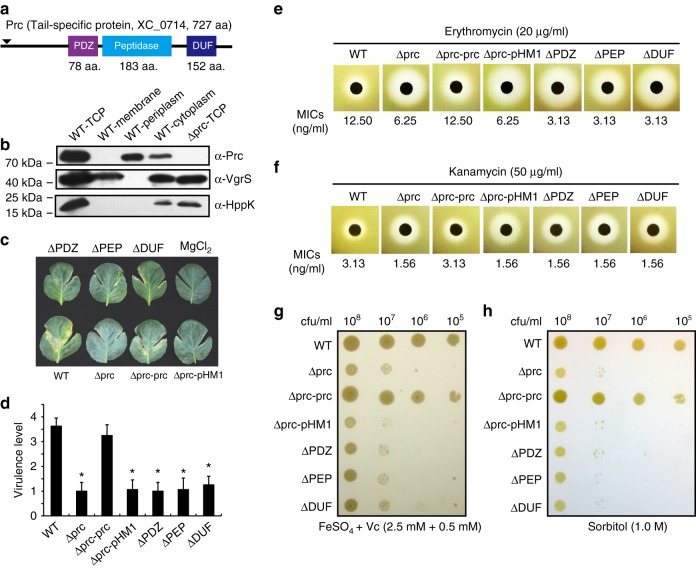
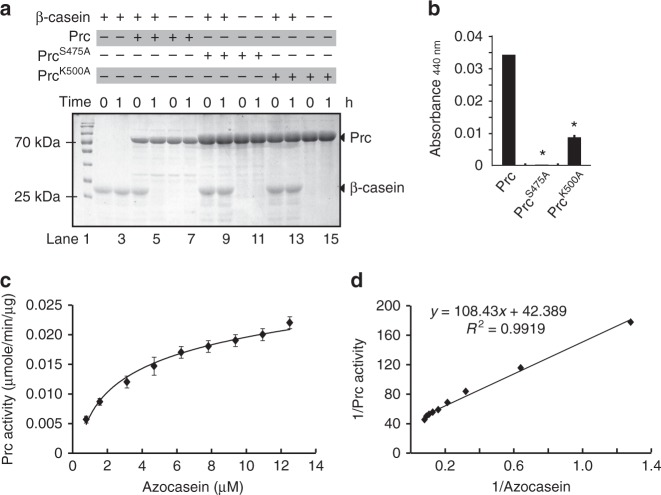
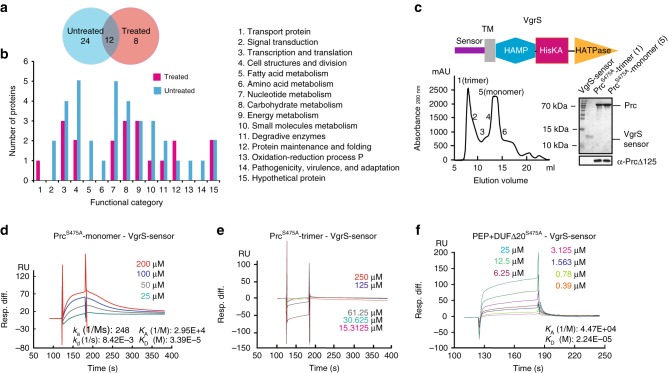
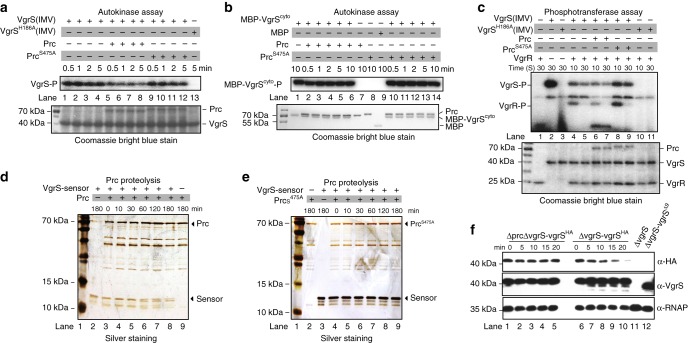
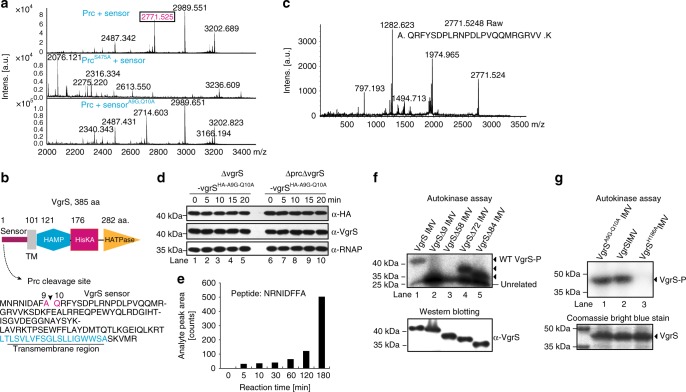
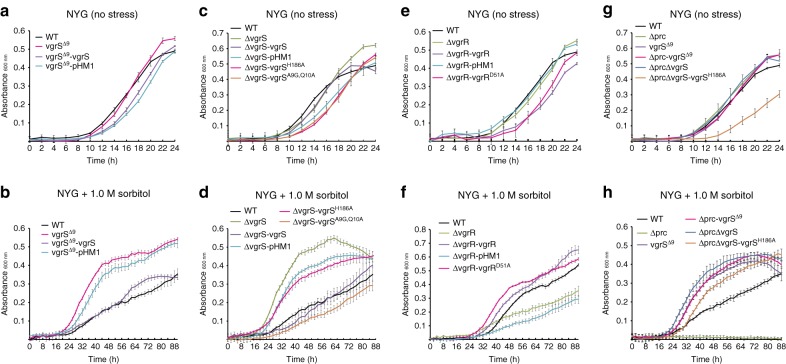
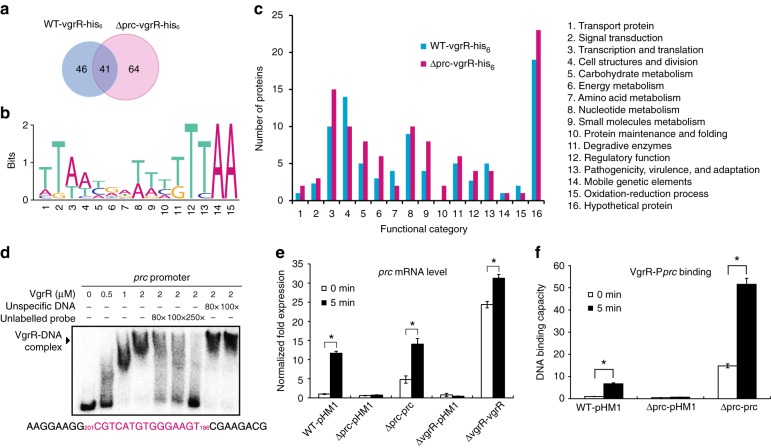
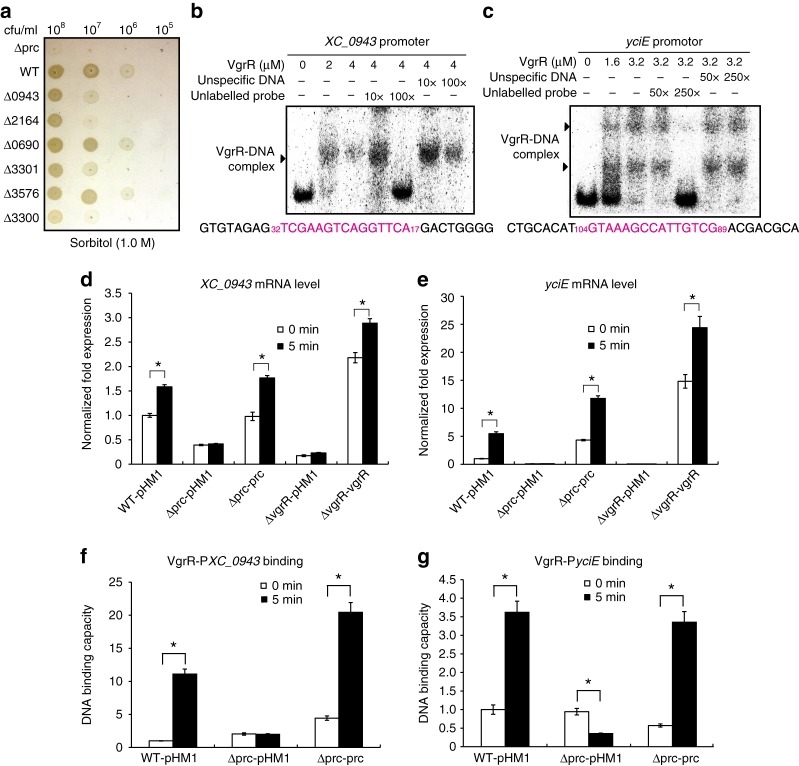
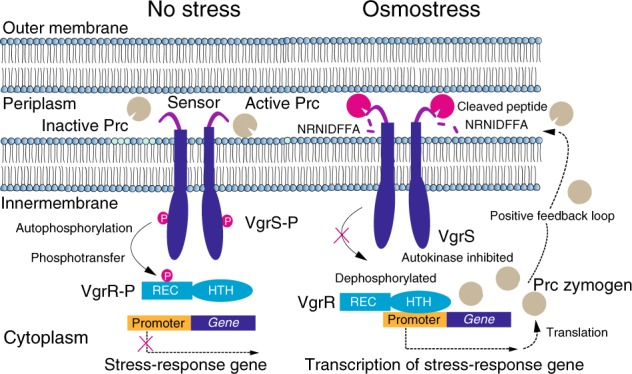
In bacterial cells, histidine kinases (HKs) are receptors that monitor environmental and intracellular stimuli. HKs and their cognate response regulators constitute two-component signalling systems (TCSs) that modulate cellular homeostasis through reversible protein phosphorylation. Here the authors show that the plant pathogen Xanthomonas campestris pv. campestris responds to osmostress conditions by regulating the activity of a HK (VgrS) via irreversible, proteolytic modification. This regulation is mediated by a periplasmic, PDZ-domain-containing protease (Prc) that cleaves the N-terminal sensor region of VgrS. Cleavage of VgrS inhibits its autokinase activity and regulates the ability of the cognate response regulator (VgrR) to bind promoters of downstream genes, thus promoting bacterial adaptation to osmostress.


Conflict of interest statement

The authors declare no competing interests.

Figures

Fig. 1
Fig. 1
prc of X. campestris pv. campestris controls virulence and stress resistance. a Schematic view of the secondary structure of the Prc protein. Domain names are according to the pfam database. b Prc is located in bacterial periplasm and cytosol. Western blotting was used to detect Prc proteins in different cellular fractions. TCP total cellular protein. Western blotting of the membrane-bound and cytosolic proteins VgrS and HPPK, respectively, were used as controls. The experiment was repeated three times. c The inactivation of prc caused a deficiency in virulence. Bacterial strains were inoculated into leaves of the host plant B. oleraceae cv. Jingfeng No. 1. Virulence scores were estimated 10 d after inoculation. Sterile 10 mM MgCl2 was used as the negative control. d Virulence scores of bacterial strains as shown in c. The virulence levels of bacterial strains were estimated using a semi-quantitative standard. Asterisks indicate significant differences relative to the WT strain (Student's t-test, P < 0.05, n = 12). The result of the in planta growth assay is shown in Supplementary Fig. 2. e and f The prc mutant is sensitive to various antibiotics, including erythromycin e and kanamycin f. In both e and f, the inhibitory zones of antibiotics are shown. The minimal inhibition concentrations (MICs) of the antibiotics were measured and are listed below. Each experiment was repeated three times. g The inactivation of prc resulted in hypersensitivity to iron stress. Bacterial strains were grown on NYG agar containing 2.5 mM FeSO4 plus 0.5 mM vitamin C for 72 h at 28 °C. The experiment was repeated three times. h The inactivation of prc resulted in hypersensitivity to osmostress. Bacterial strains were grown on NYG agar containing 1.0 M sorbitol for 72 h at 28 °C. The experiment was repeated three times
Fig. 2
Fig. 2
Prc is a serine endopeptidase. a Prc degrades β-casein, and its endopeptidase activity is dependent on the Ser475 and Lys500 sites. β-Casein (41.5 μM) was co-incubated with Prc (5 μM) or its recombinant forms (PrcS475A and PrcK500A, 10 μM) at 28 °C for the indicated time. Reactions were stopped and analysed by SDS-PAGE together with Coomassie brilliant blue staining. b Quantification of Prc endopeptidase activity via degradation of the substrate azocasein. Azocasein (424 μM) was mixed with Prc (25 μM), and the reaction was carried out at 28 °C for 30 min. The optical absorbance was measured. Error bars represent standard deviations (n = 3). Asterisks indicate significant differences (Student's t-test, P < 0.05). c and d The Michaelis–Menten kinetics of Prc activity for azocasein hydrolysis. The Michaelis–Menten curve c and Lineweaver–Burk plot d were obtained from the specific reaction velocity of the hydrolysation of azocasein by Prc. The maximum specific Vmax and Km values of the Prc activity were determined from the graphic representations. The data were derived from three independent experiments, and the goodness of fit values (R2) is indicated. ad, the experiment was repeated three times
Fig. 3
Fig. 3
Tandem affinity purification (TAP) identify that the VgrS sensor directly binds the Prc monomer. a Venn diagram of the number of proteins identified by TAP together with a nanoLC–MS/MS analysis. Samples subjected or not subjected to osmostress were analysed. b Functional categories of the putative Prc binding proteins. Protein details are listed in Supplementary Table 3. c Prc exists as a monomer and a trimer in vitro. Upper panel: Secondary structure of VgrS. Lower left panel: Recombinant PrcS475A was separated by a molecular sieve, and the molecular weights of the fractions were measured by analytical ultracentrifugation. Lower right panel: Purification of the VgrS sensor and Prc proteins. Western blotting was used to verify the Prc proteins, as shown below. df Quantification of the binding affinity between the VgrS sensor and recombinant Prc by surface plasmon resonance. d The VgrS sensor bound the PrcS475A monomer. e The VgrS sensor did not bind the PrcS475A trimer. f The VgrS sensor bound a truncated PrcS475A, which contains peptidase and DUF3340 domains. The VgrS sensor protein was trapped on a sensor CM5 chip, and various concentrations of Prc were injected at a flow-rate of 30 μl/min at 25 °C. Data were analysed using a model for a single set of identical binding sites. The binding kinetics of the Prc–VgrS sensor interaction: ka association rate constant; kd dissociation rate constant; KA equilibrium association rate constant; and KD equilibrium dissociation rate constant
Fig. 4
Fig. 4
Prc cleaves the sensor region of VgrS to inhibit its autokinase activity. ac Prc inhibited full-length VgrS autophosphorylation in a protease activity-dependent manner. a Full-length VgrS embedded in the inverted membrane vesicles (IMV, 10 μM) was phosphorylated by [γ-32P]ATP. Before the addition of 10 μCi [γ-32P]ATP, active Prc or inactive PrcS475A (2 μM) was added into the mixture. VgrSH186A IMV was used as a negative control of phosphorylation. b Prc did not affect the autophosphorylation of a soluble, cytosolic fragment of VgrS. In total, 10 μM soluble VgrS containing the transmitter region (MBP-VgrScyto) was used in the assay. c Prc inhibited the phosphorylation level of VgrR. After VgrS autophosphorylation, 10 μM VgrR was added into the mixture to elicit the VgrS–VgrR phosphotransfer reaction. In a, b and c: Upper panels show autophosphorylation assays; lower panels show Coomassie bright blue-stained gels used to check the amount of loaded protein. Aliquots were removed from the mixture at the indicated time points. The reaction was stopped by 6X SDS buffer, separated by SDS-PAGE and analysed by autoradiography. d and e Prc degraded the VgrS sensor in vitro. The purified VgrS sensor (100 μM) was co-incubated with 5 μM active Prc d or inactive PrcS475A e in enzymatic reaction buffer at 28 °C for the indicated time. Reactions were stopped, and the products were analysed by SDS-PAGE together with silver staining. f Western blotting revealed that Prc degraded N-terminal HA-tags in vivo. A bacterial strain that encoded recombinant VgrS fused with an HA-tag between the 6th and 7th residues was constructed independently in the ΔvgrS background. The bacterial strain was stimulated by 1.0 M sorbitol for different time periods. Total proteins were extracted, separated by SDS-PAGE, and analysed by western blotting. A polyclonal antibody of VgrS (α-VgrS) was used to measure the amount of VgrS protein, while monoclonal HA antibody (α-HA) was used to detect the N-terminal region of VgrS that was potentially cleaved by Prc, and the polyclonal antibody of RNAP (α-RNAP) was used as internal control. af, the experiments were repeated three times
Fig. 5
Fig. 5
Identification of the VgrS cleavage site by the Prc protease. a MALDI–TOF–MS/MS analysis revealed that Prc cleaves the VgrS sensor at the Ala9↓Gln10 site. Upper panel: proteolysis of the VgrS sensor with active Prc. Middle panel: proteolysis of the VgrS sensor with inactive PrcS475A, which was used as a negative control. Lower panel: proteolysis of the recombinant VgrSA9G-Q10A sensor with active Prc. Digested products were detected in positive ion reflectron mode over an m/z range of 700–3500. Spectra showed relative intensities in the mass range of m/z 2000–3400. b Schematic view of the secondary structure of VgrS and the cleavage site in the sensor region. TM transmembrane helix. c Identification of the Prc cleavage site in the VgrS sensor. A MALDI–TOF/TOF MS/MS spectral analysis of m/z 2771.5 from a Prc + VgrS sensor sample. The magnified MS/MS spectra showed the fragment patterns of peptides. d Substitution of VgrSA9G-Q10A resulted in resistance to Prc cleavage. Bacterial strains that encoded recombinant VgrSA9G-Q10A fused with an HA-tag between the 6th and 7th residues were constructed independently in the ΔvgrS and ΔvgrSΔprc backgrounds. The bacterial strains were stimulated by 1.0 M sorbitol for different time periods. Total proteins were extracted, separated by SDS-PAGE, and analysed by western blotting. A polyclonal antibody of VgrS (α-VgrS) was used to measure the amount of VgrS protein, while a monoclonal HA antibody (α-HA) was used to detect the N-terminal region of VgrS that was potentially cleaved by Prc, and the polyclonal antibody of RNAP (α-RNAP) was used as an internal control. The experiment was repeated three times. e Detection of the N-terminal short peptide of VgrS generated by Prc cleavage. Full-length VgrS embedded in inverted membrane vesicles was treated by Prc, and the proteolytic products were analysed by QTRAP LC–MS/MS at different time points. A chemically synthesized peptide, NRNIDFFA, was used as standard. Details of the QTRAP LC–MS/MS analysis are shown in Supplementary Fig. 6. f and g Deletion of the N-terminal sequence of VgrS decreased its autophosphorylation level. f An in vitro phosphorylation assay was conducted to measure the autophosphorylation levels of the truncated VgrSΔ9, VgrSΔ58, VgrSΔ72 and VgrSΔ84 embedded in the IMVs (10 μM). The reaction was performed as described in Fig. 4a. g Substitution of VgrSA9G-Q10A did not affect its autokinase activity. Upper panels: autophosphorylation assay. Lower panels: western blotting of the proteins or Coomassie brilliant blue staining was used to check the amount of loaded protein. Two experimental repeats were performed
Fig. 6
Fig. 6
Deletion of the N-terminus of vgrS suppresses the growth deficiency of the prc mutant under osmostress. a, c, e, and g Bacterial growth in NYG medium. b, d, f, and h Bacterial growth in NYG medium plus 1.0 M sorbitol. The growth curves were measured by an automatic Bioscreen C instrument. Each data point is the average of six samples, and error bars indicate standard deviations
Fig. 7
Fig. 7
prc controls the VgrR regulon and VgrR promoter-binding landscapes. a Venn diagram showing the number of genes with promoters that potentially bound to VgrR. ChIP-seq was used to identify the VgrR-binding DNAs. Genes identified from the WT strain and the prc mutant are shown. b Predicted consensus VgrR-binding DNA motif based on ChIP-seq data. Weblogo was used to show the nucleotide composition. c Functional classification of the VgrR-regulated genes identified by ChIP-seq. Gene details are listed in Supplementary Table 4. d An electrophoretic mobility shift assay revealed that VgrR directly bound the promoter region of prc. PCR products of the promoter region were labelled with [γ-32P]ATP and used as DNA probes. Unlabelled DNA and unspecific DNA were used as competitors. The sequence of the DNA probe is shown below, with the VgrR-binding motif in magenta. Numbers indicate the location relative to the translation initiation site. Each experiment was repeated two times. Triangle indicates VgrR–DNA complexes. e vgrR positively controls the transcription of prc. qRT-PCR was used to quantify prc mRNA in different bacterial strains before and after osmostress stimulation (1.0 M sorbitol, 5 min). Amplification of the cDNA of tmRNA was used as an internal control. A representative of three independent experiments is shown. f Deletion of prc decreases VgrR-promoter binding in bacterial cells. ChIP-qPCR was employed to quantify the enrichment of VgrR at the promoter region of prc under osmostress growth conditions (NYG medium plus 1.0 M sorbitol for 5 min) or no stimulation. The experiment was repeated three times. In e and f, error bars indicate the standard deviations. Asterisks indicate significant differences relative to the WT strain (Student’s t-test, P < 0.05)
Fig. 8
Fig. 8
Prc regulates the VgrR–promoter-binding interactions in bacterial cells. a Bacterial growth on NYG–sorbitol plate. Bacterial cultures were serially diluted and inoculated onto NYG plus 1.0 M sorbitol plate and grown for 72 h at 28 °C. The experiment was repeated three times. b and c Electrophoretic mobility shift assays revealed that VgrR directly bound the promoter regions of XC_0943 and yciE. PCR products of the promoter regions were labelled with [γ-32P]ATP and used as DNA probes. Unlabelled DNA and non-specific DNA were used as competitors. The sequence of the DNA probe is shown below with the VgrR-binding motif in magenta. Numbers indicate the location relative to the translation initiation site. Each experiment was repeated two times. Triangles indicate VgrR–DNA complexes. d and e The prc mutation caused decreases in the transcription levels of XC_0943 and yciE when bacterial strains were grown under osmostress. qRT-PCR was used to quantify the mRNA levels of these genes in different bacterial strains before and after osmostress stimulation (1.0 M sorbitol, 5 min). Amplification of the cDNA of tmRNA was used as an internal control. A representative of three independent experiments is shown. f and g The prc mutation caused decreases in VgrR–DNA binding in bacterial cells. ChIP-qPCR was conducted to quantify the enrichment of VgrR at the promoter regions of XC_0943 and yciE in vivo when bacterial strains were grown under osmostress conditions (NYG medium plus 1.0 M sorbitol for 5 min). The experiment was repeated three times. In dg Error bars indicate the standard deviations. Asterisks indicate significant differences of strains before and after osmostress (Student’s t-test, P < 0.05)
Fig. 9
Fig. 9
A model for VgrS proteolysis-triggered bacterial stress responses. When bacteria grow under osmostress, Prc is activated and then cleaves the N-terminal peptide (NRNIDFFA) of the sensor region of VgrS to inhibit the latter’s autophosphorylation. Dephosphorylation of the VgrS–VgrR two-component signal transduction system regulates VgrR–promoter interactions and triggers the transcription of stress-response genes, which is required for X. campestris pv. campestris to resist osmostress. prc itself is controlled by VgrR, resulting in a positive feedback loop within the regulatory cascade

Similar articles

Cited by

References

    1. Gur E, Biran D, Ron EZ. Regulated proteolysis in Gram-negative bacteria—how and when? Nat. Rev. Microbiol. 2011;9:839–848. doi: 10.1038/nrmicro2669. - DOI - PubMed
    1. Tomko RJ, Hochstrasser M. Molecular architecture and assembly of the eukaryotic proteasome. Annu. Rev. Biochem. 2013;82:415–445. doi: 10.1146/annurev-biochem-060410-150257. - DOI - PMC - PubMed
    1. Hunter T. Protein-kinases and phosphatases—the Yin and Yang of protein-phosphorylation and signaling. Cell. 1995;80:225–236. doi: 10.1016/0092-8674(95)90405-0. - DOI - PubMed
    1. Lopez-Otin C, Hunter T. The regulatory crosstalk between kinases and proteases in cancer. Nat. Rev. Cancer. 2010;10:278–292. doi: 10.1038/nrc2823. - DOI - PubMed
    1. Kurokawa M, Kornbluth S. Caspases and kinases in a death grip. Cell. 2009;138:838–854. doi: 10.1016/j.cell.2009.08.021. - DOI - PMC - PubMed

Publication types

MeSH terms