

Changes in bursal B cells in chicken during embryonic development and early life after hatching
- PMID: 30442912
- PMCID: PMC6238004
- DOI: 10.1038/s41598-018-34897-4
Changes in bursal B cells in chicken during embryonic development and early life after hatching
Abstract
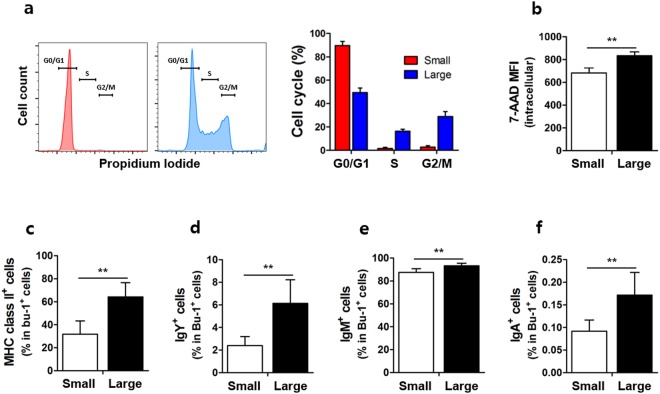
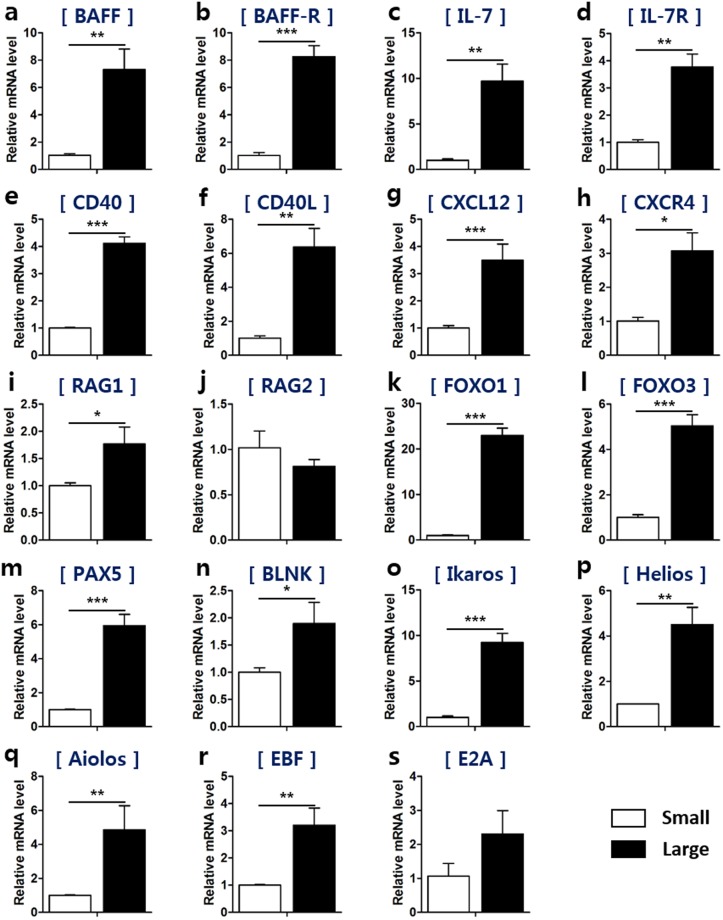
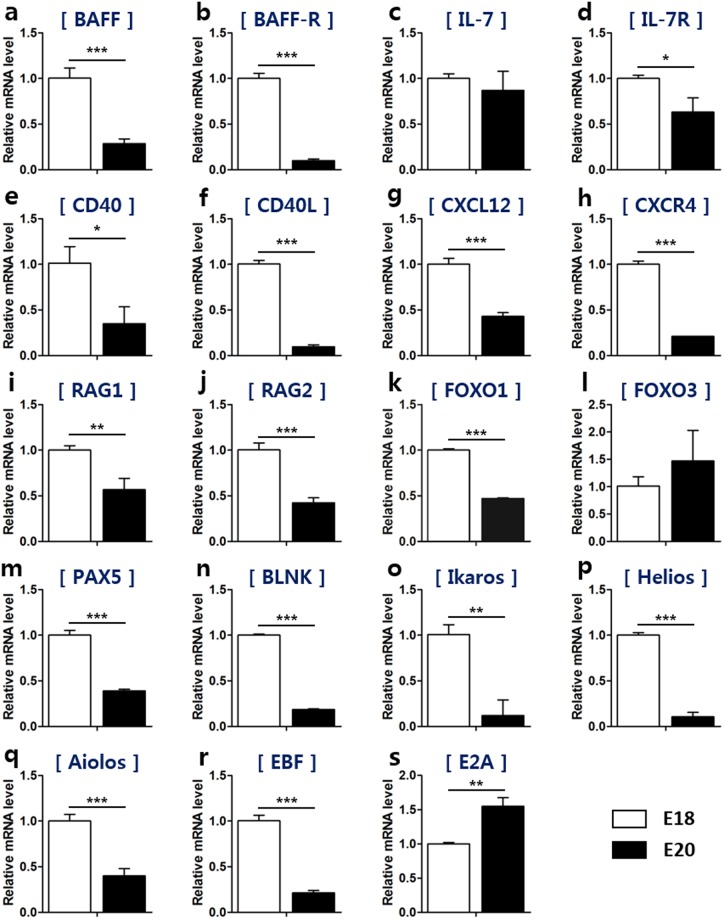
The bursa of Fabricius, the primary lymphoid organ for B cell development found only in birds, offers novel approaches to study B cell differentiation at various developmental stages. Here, we explored the changes and mechanism involved in the developmental stages of bursal B cells. The bursal B cells rapidly increased in the late embryonic stage and around hatching, which coincided with changes in specific cell surface markers. Moreover, the cells in the bursa were divided by size into small (low forward- and side-scatter) or large (high forward- and side-scatter) via flow cytometry. It is intriguing that the proportion of small and large B cells was reversed during this period. Because little is known about this phenomenon, we hypothesized that size-based B cell population could be used as an indicator to distinguish their status and stage during B cell development in chicken. The results demonstrated that large B cells are actively proliferating cells than small B cells. Additionally, large B cells showed higher mRNA expression of both proliferation- and differentiation-associated genes compared to small B cells. Taken together, these data show that large bursal B cells are the main source of proliferation and differentiation during B cell development in chickens.
Conflict of interest statement
The authors declare no competing interests.
Figures


Similar articles
-
Chicken B cells adhere to the CS-1 site of fibronectin throughout their bursal and postbursal development.Eur J Immunol. 1993 Mar;23(3):721-6. doi: 10.1002/eji.1830230323. Eur J Immunol. 1993. PMID: 8449220
-
Transcriptome reveals B lymphocyte apoptosis in duck embryonic bursa of Fabricius mediated by mitochondrial and Fas signaling pathways.Mol Immunol. 2018 Sep;101:120-129. doi: 10.1016/j.molimm.2018.06.266. Epub 2018 Jun 20. Mol Immunol. 2018. PMID: 29933212
-
Committed precursors of B and T lymphocytes in chick embryo bursa of Fabricius, thymus, and bone marrow.Eur J Immunol. 1983 Jun;13(6):449-55. doi: 10.1002/eji.1830130604. Eur J Immunol. 1983. PMID: 6190659
-
Somatic diversification of the chicken immunoglobulin light-chain gene.Adv Immunol. 1990;48:41-67. doi: 10.1016/s0065-2776(08)60751-8. Adv Immunol. 1990. PMID: 2112303 Review.
-
Review of studies on the immunological capacity in the bursectomized chick.Vet Immunol Immunopathol. 1987 Sep;16(1-2):77-84. doi: 10.1016/0165-2427(87)90175-9. Vet Immunol Immunopathol. 1987. PMID: 3314112 Review.
Cited by
-
Thyrotropin-Releasing Hormone (TRH) and Somatostatin (SST), but not Growth Hormone-Releasing Hormone (GHRH) nor Ghrelin (GHRL), Regulate Expression and Release of Immune Growth Hormone (GH) from Chicken Bursal B-Lymphocyte Cultures.Int J Mol Sci. 2020 Feb 20;21(4):1436. doi: 10.3390/ijms21041436. Int J Mol Sci. 2020. PMID: 32093298 Free PMC article.
-
Transcriptomic analysis of spleen B cell revealed the molecular basis of bursopentin on B cell differentiation.Vet Res. 2022 Dec 14;53(1):109. doi: 10.1186/s13567-022-01123-z. Vet Res. 2022. PMID: 36517897 Free PMC article.
-
Development of lymphocyte subpopulations in local breed chickens.Vet World. 2021 Jul;14(7):1846-1852. doi: 10.14202/vetworld.2021.1846-1852. Epub 2021 Jul 19. Vet World. 2021. PMID: 34475708 Free PMC article.
-
Comparative Effectiveness of Various Multi-Antigen Vaccines in Controlling Campylobacter jejuni in Broiler Chickens.Vaccines (Basel). 2024 Aug 10;12(8):908. doi: 10.3390/vaccines12080908. Vaccines (Basel). 2024. PMID: 39204034 Free PMC article.
-
Three-Dimensional Avian Hematopoietic Stem Cell Cultures as a Model for Studying Disease Pathogenesis.Front Cell Dev Biol. 2022 Jan 20;9:730804. doi: 10.3389/fcell.2021.730804. eCollection 2021. Front Cell Dev Biol. 2022. PMID: 35127695 Free PMC article. Review.
References
-
- Funk PE, Palmer JL. Dynamic control of B lymphocyte development in the bursa of fabricius. Arch Immunol Ther Exp (Warsz) 2003;51:389–398. - PubMed
-
- Schat, K. A., Kaspers, B. & Kaiser, P. Avian immunology (Chapters 1–4). Second edition. edn, (Elsevier: Academic Press, 2014).
Publication types
MeSH terms
LinkOut - more resources
Full Text Sources
