. 2018 Nov 15;8(1):16904.
doi: 10.1038/s41598-018-35161-5.

Developmental induction of human T-cell responses against Candida albicans and Aspergillus fumigatus

Affiliations

Developmental induction of human T-cell responses against Candida albicans and Aspergillus fumigatus

Katrin Vogel et al. Sci Rep. .

Abstract

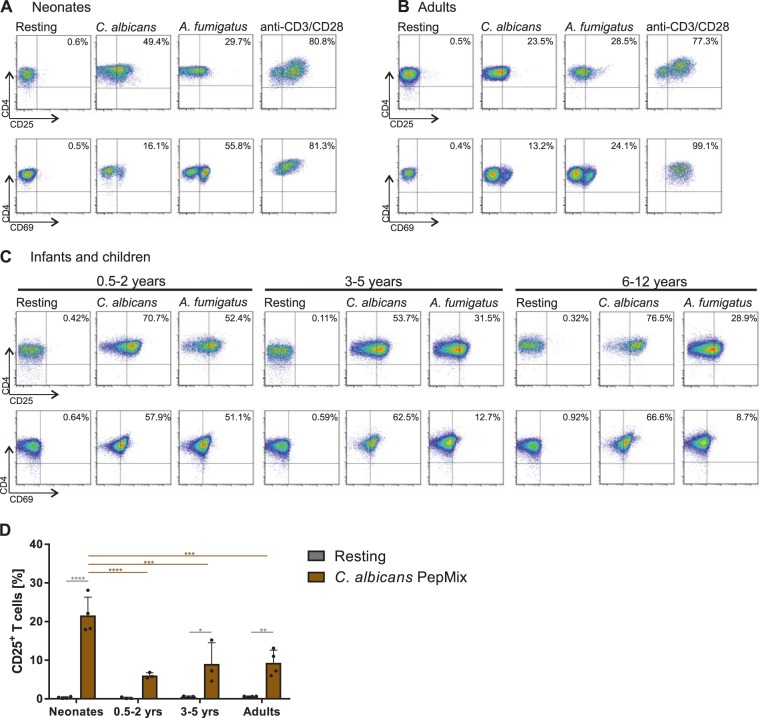
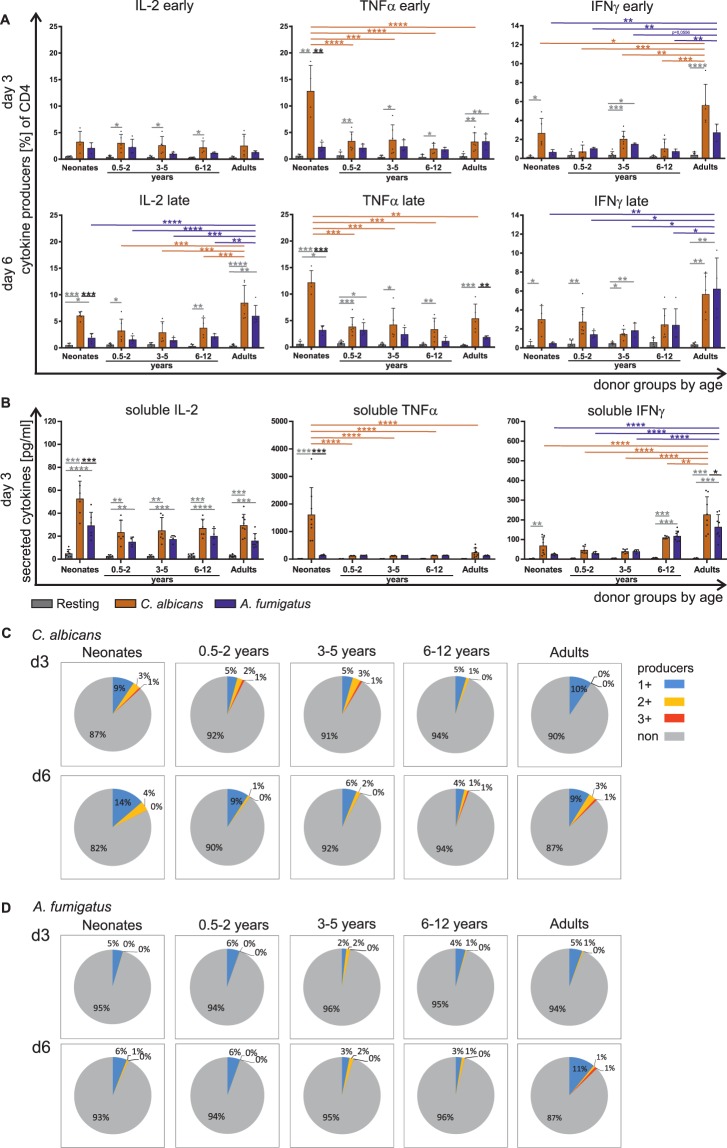
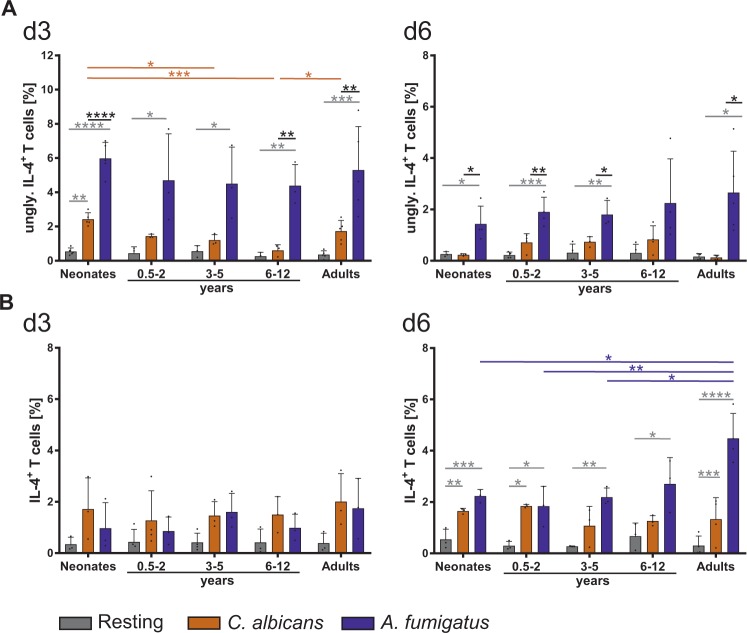
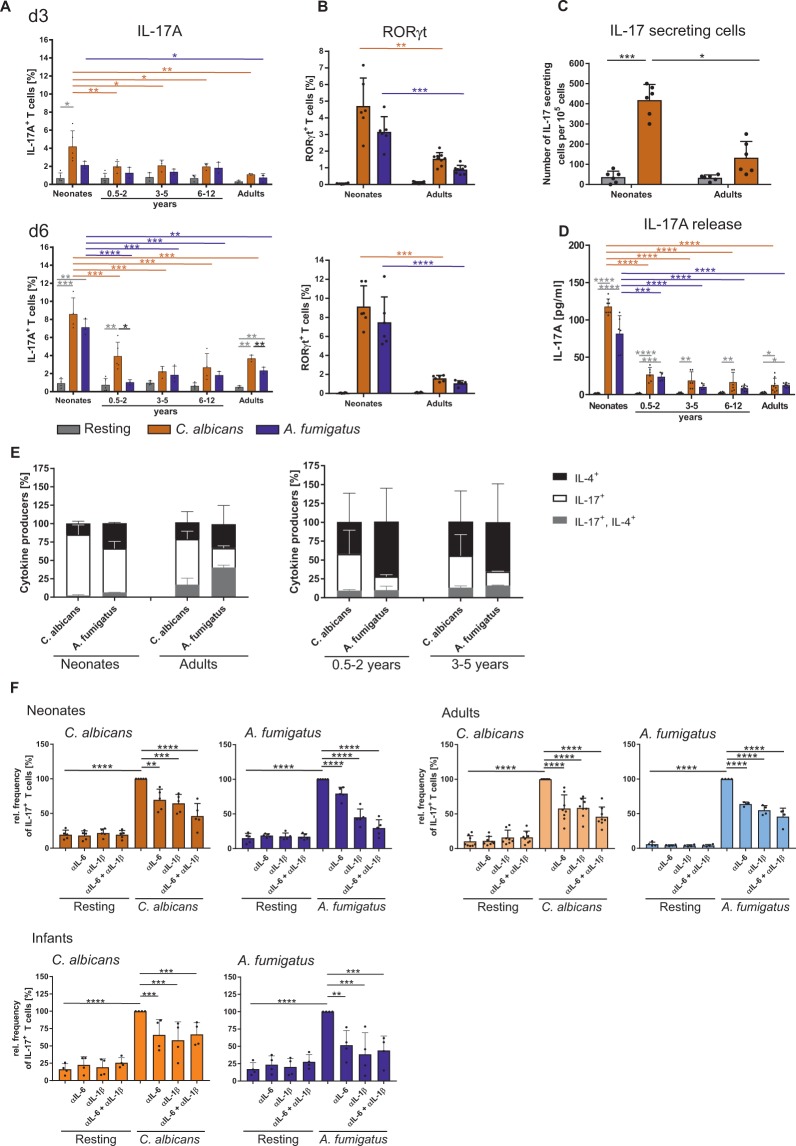
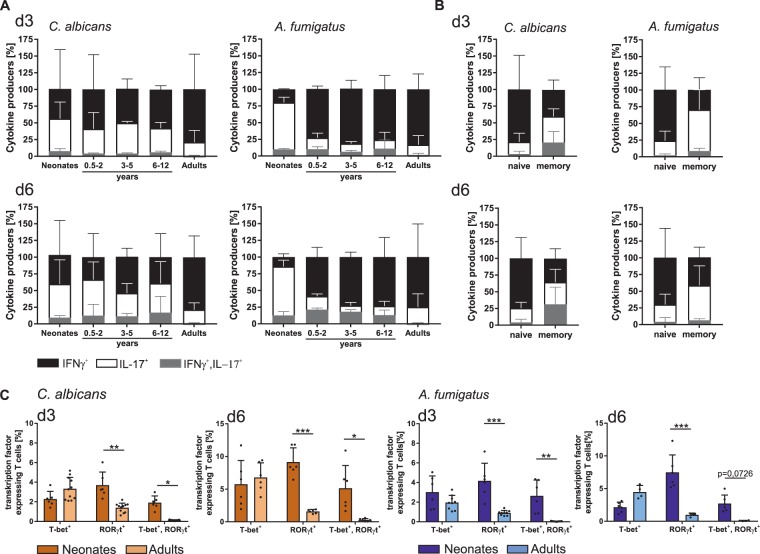
The origin of human T-cell responses against fungal pathogens early in life is not clearly understood. Here, we show that antifungal T-cell responses are vigorously initiated within the first years of life against lysates and peptides of Candida albicans or Aspergillus fumigatus, presented by autologous monocytes. The neonatal responding T-cell pool consists of 20 different TCR-Vβ families, whereas infant and adult pools display dramatically less variability. Although we demonstrate no bias for anti-fungal IL-4 expression early in life, there was a strong bias for anti-fungal IL-17 production. Of note, only T-cells from neonates and infants show an immediate co-expression of multiple cytokines. In addition, only their T-cells co-express simultaneously transcription factors T-bet and RORγt in response to fungi and subsequently their target genes IL-17 and IFNγ. Thus, T-cells of neonates and infants are predetermined to respond quickly with high plasticity to fungal pathogens, which might give an excellent opportunity for therapeutic interventions.


Conflict of interest statement

The authors declare no competing interests.

Figures

Figure 1
Figure 1
Fungi-specific T cell proliferation. (A–C) Purified CD4+CD45RA+ T cells were labelled with CFSE and cultured with monocytes matured with heat-inactivated C. albicans or A. fumigatus at a ratio of 2:1. CFSE dilution profiles and the frequency of proliferating (CFSElo) T cells from neonates (A), infants and children (C) or adults (B) on day 3 and day 6 after stimulation. Data are representative of 5 donors. (D) Frequency of proliferating (CFSElo) T cells from neonates, infants, children, and adults stimulated with C. albicans (orange), A. fumigatus (blue) or anti-CD3/CD28 (black) determined by flow cytometry are plotted against age. The dotted lines represent the 95% confidence interval. The coefficient of determination (R2) according to the one-phase decay exponential model in response to C. albicans-antigen is 0,9209. (E) Bar graphs showing frequency of naïve (CD4+CD45RA+CD31+) or memory (CD4+CD45RO+) T cells of children, expressing CD25 upon stimulation with Tetanus Toxoid for 3 days. Cumulative results are shown and each dot represents a different donor. The error bars in figures denote ± SD. ****p < 0.0001, as determined by one-way Anova with Tukey post hoc test.
Figure 2
Figure 2
Fungi–specific up-regulation of activation markers. (A–C) Representative dot plots of flow cytometric analysis showing the frequency of CD4+CD45RA+ T cells of neonates (A), infants and children (C) or adults (B) expressing CD25 or CD69 after 3-day stimulation with monocytes matured with heat-inactivated C. albicans or A. fumigatus. Data are representative of at least 5 donors. (D) Bar graph showing CD25 expression of CD4+CD45RA+CD31+ T cells isolated form neonates, infants, children and adults in response to C. albicans PepMix (brown) as in (A–C). T cells were stimulated for 3 days and determined using flow cytometry. Cumulative results are shown and each dot represents a different donor. The error bars in figures denote ± SD. *p < 0.05, **p < 0.01, ***p < 0.001, ****p < 0.0001, as determined by one-way Anova with Tukey post hoc test.
Figure 3
Figure 3
Fungi-induced T cell receptor Vß family response. CD4+CD45RA+ T cells from neonates, infants, children, and adults were co-cultured with monocytes pulsed with C. albicans- or A. fumigatus-lysates and expression of different Vß repertoire on T cells was measured by flow cytometry. (A–C) Frequency of Vß9 (left panel), Vß16 (middle panel) or Vß17 (right panel) expressing unstimulated T cells (A), T cells stimulated for 3 days either with C. albicans (B) or A. fumigatus (C) are shown. Each dot represents a different donor. (D,E) Bar graph showing TCR-Vß expression either by CD4+CD45RA+CD25+ T cells from neonates, infants, children, and adults or by CD4+CD45RO+CD25+ T cells from adults. T cells are stimulated for 3 days either with C. albicans (orange) or A. fumigatus (blue). Cumulative results are shown and each dot represents a different donor. The error bars in figures denote ± SD. *p < 0.05, **p < 0.01, ***p < 0.001, ****p < 0.0001, as determined by one-way Anova with Tukey post hoc test (A–C) or Kruskal Wallis with Dunn’s post hoc test (D and E) (F) TCR-Vß repertoire usage in CD4 + CD45RA + T cells of infants and children as well as adults after co-culturing with monocytes pulsed with C. albicans- or A. fumigatus-lysates. The allocation of the groups took place if the expression of TCR-Vß family in the stimulated samples was higher than in unstimulated controls.
Figure 4
Figure 4
Fungi specific Th1 cytokine expression by T cells of different age groups. CD4+CD45RA+ T cells from neonates, infants, children, and adults were stimulated with C. albicans (orange) or A. fumigatus (blue) (as in Fig. 1) for 3 and 6 days respectively (A) Frequency of T cells expressing intracellular IL-2 (left panel), TNFα (middle panel) or IFNγ (right panel) was determined by flow cytometry. (B) Determination of IL-2 (left panel), TNFα (middle panel) or IFNγ (right panel) cytokine release of CD4+CD45RA+ T cells of neonates, infants and children or adults by LegendPlex which were either stimulated or not for 3 days. (C,D) CD4+CD45RA+ T cells were stimulated with C. albicans (C) or A. fumigatus (D) as in A, and the cells expressing single or multiple cytokines IL-2, TNFα, and IFNγ were determined by flow cytometry and analysed by Boolean gating and shown as fraction of all CD4+ T cells in a pie chart. The subsets that simultaneously express no (grey), one (blue), two (yellow) or three (red) different cytokines are grouped by colour. The data are representative of at least 5 donors. Cumulative results are shown and each dot in (A) and (B) represent a different donor. The error bars in figures denote ± SD. *p < 0.05, **p < 0.01, ***p < 0.001, ****p < 0.0001, as determined by one-way Anova with Tukey post hoc test (A) or Kruskal Wallis with Dunn’s post hoc test (B).
Figure 5
Figure 5
Age-dependent IL-4 production by fungi specific T cells. (A,B) CD4+CD45RA+ T cells from neonates, infants, children, and adults were stimulated with C. albicans (orange) or A. fumigatus (blue) (as in Fig. 4) for 3 (left panel) and 6 days (right panel) respectively, and analysed for the expression of intracellular un-glycosylated IL-4 isoform (upper panel) and mature IL-4 (lower panel). Cumulative results are shown and each dot represents a different donor. The error bars in figures denote ± SD. *p < 0.05, **p < 0.01, ***p < 0.001, ****p < 0.0001, as determined by one-way Anova with Tukey post hoc test.
Figure 6
Figure 6
Fungi specific T cells produce IL-17 in an age dependent manner. CD4+CD45RA+CD31+ T cells from neonates, infants, children, and adults were co-cultured with monocytes pulsed with C. albicans- or A. fumigatus-lysates. (A,B) The frequency of T cells expressing signature Th17 molecules IL-17 (A) and RORγt (B) were analysed by flow cytometry at day 3 (upper Panel) and day 6 after stimulation (lower panel) (C) Bar graph representing the ELISPOT analysis of the quantitative IL-17, produced by the T cells from neonates and adults which were either stimulated or not for 3 days as described in (A). (D) Determination of IL-17A cytokine release of CD4+CD45RA+ T cells of neonates, infants and children or adults by LegendPlex which were either stimulated or not for 3 days as described in (A). (E) Frequency of T cells expressing intracellular IL-17 (white), IL-4 (black) and both IL-17/IL-4 (grey) were measured by flow cytometry after 6 days of stimulation, analysed by boolean gating and shown as different fractions of cytokine expressing cells in a stacked bar chart. (F) Bar graph showing IL-17 expression by CD4+CD45RA+CD31+ T cells of neonates, adults, and infants of 0.5-2 years old, stimulated for 6 days as described in (A) in the presence or absence of neutralizing antibodies for IL-1ß, IL-6 or both. Cumulative results are shown and each dot in (AD) and (F) represent a different donor. The error bars in figures denote ± SD. *p < 0.05, **p < 0.01, ***p < 0.001, ****p < 0.0001, as determined by one-way Anova with Tukey post hoc test (A-C, F) or Kruskal Wallis with Dunn’s post hoc test (D).
Figure 7
Figure 7
Identification of age-dependent fungi specific multifunctional Th1/Th17 cells. (A) CD4+CD45RA+CD31+ T cells from neonates, infants and children of different age groups, and adults were co-cultured with monocytes pulsed with C. albicans (left panel) or A. fumigatus (right panel). The frequency of T cells expressing intracellular IL-17 (white), IFNγ (black) and both IL-17/IFNγ (grey) were determined by flow cytometry at the indicated time points, analysed by boolean gating and shown as different fractions of cytokine expressing cells in a stacked bar chart. (B) Frequency of naïve (CD4+CD45RA+CD31+) or memory (CD4+CD45RO+) T cells of adults expressing intracellular IL-17 (white), IFNγ (black) and both IL-17/IFNγ (grey) were determined by flow cytometry at the indicated time points and analysed as described in (A). (C) Frequency of CD4+CD45RA+CD31+ T cells from neonates and adults expressing Th1 and Th17 transcription factors T-bet, RORγt and both T-bet as well as RORγt following stimulation with C. albicans (orange bars) or A. fumigatus (blue bars) for 3 and 6 days as described in (A). Cumulative results are shown and each dot represents a different donor. The error bars in figures denote ± SD. *p < 0.05, **p < 0.01, ***p < 0.001, ****p < 0.0001, as determined by Kruskal Wallis test with Dunn’s post hoc test.

Similar articles

Cited by

References

    1. Tsai M-H, et al. Clinical and microbiological characteristics, and impact of therapeutic strategies on the outcomes of children with candidemia. Sci Rep. 2017;7:1083. doi: 10.1038/s41598-017-01123-6. - DOI - PMC - PubMed
    1. Richardson JP, Moyes DL. Adaptive immune responses to Candida albicans infection. Virulence. 2015;6:327–337. doi: 10.1080/21505594.2015.1004977. - DOI - PMC - PubMed
    1. Teng JC, et al. Epidemiology of invasive fungal disease in lymphoproliferative disorders. Haematologica. 2015;100:e462–6. doi: 10.3324/haematol.2015.126698. - DOI - PMC - PubMed
    1. Karvonen AM, et al. Moisture damage and asthma. A birth cohort study. Pediatrics. 2015;135:e598–606. doi: 10.1542/peds.2014-1239. - DOI - PubMed
    1. Limper AH, Adenis A, Le T, Harrison TS. Fungal infections in HIV/AIDS. The Lancet Infectious Diseases. 2017;17:e334–e343. doi: 10.1016/S1473-3099(17)30303-1. - DOI - PubMed

Publication types

MeSH terms