

Demographic stochasticity drives epidemiological patterns in wildlife with implications for diseases and population management
- PMID: 30442961
- PMCID: PMC6237989
- DOI: 10.1038/s41598-018-34623-0
Demographic stochasticity drives epidemiological patterns in wildlife with implications for diseases and population management
Abstract
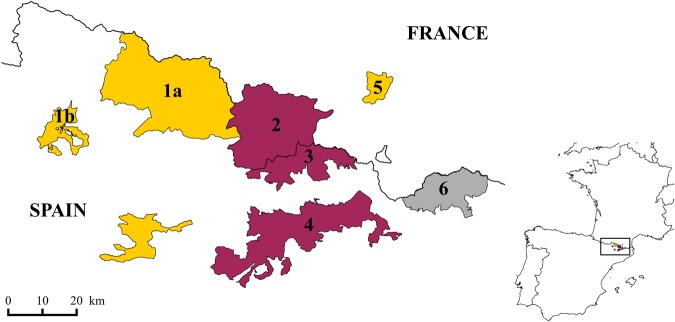
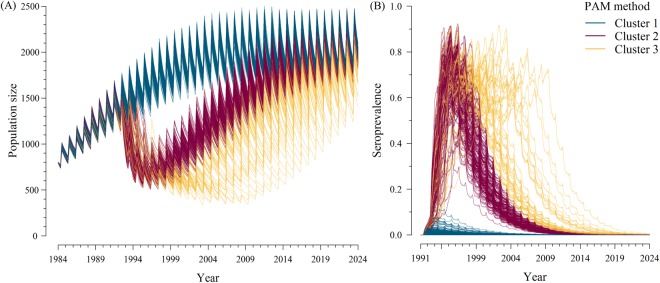
Infectious diseases raise many concerns for wildlife and new insights must be gained to manage infected populations. Wild ungulates provide opportunities to gain such insights as they host many pathogens. Using modelling and data collected from an intensively monitored population of Pyrenean chamois, we investigated the role of stochastic processes in governing epidemiological patterns of pestivirus spread in both protected and hunted populations. We showed that demographic stochasticity led to three epidemiological outcomes: early infection fade-out, epidemic outbreaks with population collapse, either followed by virus extinction or by endemic situations. Without re-introduction, the virus faded out in >50% of replications within 4 years and did not persist >20 years. Test-and-cull of infected animals and vaccination had limited effects relative to the efforts devoted, especially in hunted populations in which only quota reduction somewhat improve population recovery. Success of these strategies also relied on the maintenance of a high level of surveillance of hunter-harvested animals. Our findings suggested that, while surveillance and maintenance of population levels at intermediate densities to avoid large epidemics are useful at any time, a 'do nothing' approach during epidemics could be the 'least bad' management strategy in populations of ungulates species facing pestivirus infection.
Conflict of interest statement
The authors declare no competing interests.
Figures


Similar articles
-
Surveillance of border disease in wild ungulates and an outbreak in Pyrenean chamois (Rupicapra pyrenaica pyrenaica) in Andorra.J Wildl Dis. 2012 Oct;48(4):1021-9. doi: 10.7589/2012-01-002. J Wildl Dis. 2012. PMID: 23060503
-
Long-term dynamics of Mycoplasma conjunctivae at the wildlife-livestock interface in the Pyrenees.PLoS One. 2017 Oct 9;12(10):e0186069. doi: 10.1371/journal.pone.0186069. eCollection 2017. PLoS One. 2017. PMID: 29016676 Free PMC article.
-
Self-clearance of Pestivirus in a Pyrenean Chamois ( Rupicapra pyrenaica) Population.J Wildl Dis. 2018 Apr;54(2):335-341. doi: 10.7589/2017-03-055. Epub 2017 Nov 17. J Wildl Dis. 2018. PMID: 29148885
-
The two sides of border disease in Pyrenean chamois (Rupicapra pyrenaica): silent persistence and population collapse.Anim Health Res Rev. 2015 Jun;16(1):70-7. doi: 10.1017/S1466252315000055. Anim Health Res Rev. 2015. PMID: 26050575 Review.
-
Integrating social behaviour, demography and disease dynamics in network models: applications to disease management in declining wildlife populations.Philos Trans R Soc Lond B Biol Sci. 2019 Sep 16;374(1781):20180211. doi: 10.1098/rstb.2018.0211. Epub 2019 Jul 29. Philos Trans R Soc Lond B Biol Sci. 2019. PMID: 31352885 Free PMC article. Review.
Cited by
-
SPARSEMODr: Rapidly simulate spatially explicit and stochastic models of COVID-19 and other infectious diseases.Biol Methods Protoc. 2022 Sep 1;7(1):bpac022. doi: 10.1093/biomethods/bpac022. eCollection 2022. Biol Methods Protoc. 2022. PMID: 36157711 Free PMC article.
-
An early warning indicator trained on stochastic disease-spreading models with different noises.J R Soc Interface. 2024 Aug;21(217):20240199. doi: 10.1098/rsif.2024.0199. Epub 2024 Aug 9. J R Soc Interface. 2024. PMID: 39118548 Free PMC article.
-
Significant reductions of host abundance weakly impact infection intensity of Batrachochytrium dendrobatidis.PLoS One. 2020 Nov 30;15(11):e0242913. doi: 10.1371/journal.pone.0242913. eCollection 2020. PLoS One. 2020. PMID: 33253322 Free PMC article.
-
Characterizing the demographic history and prion protein variation to infer susceptibility to chronic wasting disease in a naïve population of white-tailed deer (Odocoileus virginianus).Evol Appl. 2021 Mar 30;14(6):1528-1539. doi: 10.1111/eva.13214. eCollection 2021 Jun. Evol Appl. 2021. PMID: 34178102 Free PMC article.
References
-
- Wobeser, G. Disease in wild animals: investigation and management. (Springer, 2007).
-
- National Academies of Sciences, Engineering, and Medicine Revisiting brucellosis in the Greater Yellowstone Area, 10.17226/24750 (National Academies Press, 2017). - PubMed
MeSH terms
LinkOut - more resources
Full Text Sources
Research Materials
