. 2018 Nov 15;8(1):16895.
doi: 10.1038/s41598-018-35004-3.

Amyloid β toxic conformer has dynamic localization in the human inferior parietal cortex in absence of amyloid plaques

Affiliations

Amyloid β toxic conformer has dynamic localization in the human inferior parietal cortex in absence of amyloid plaques

Yusuke Kageyama et al. Sci Rep. .

Abstract

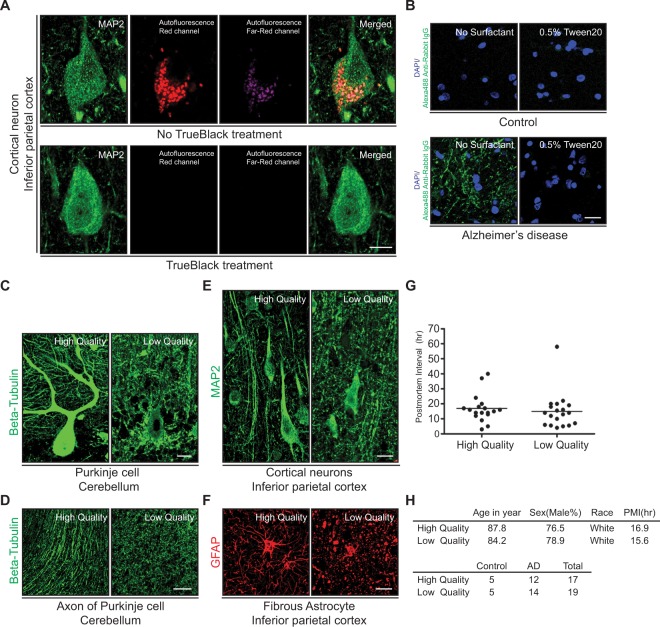
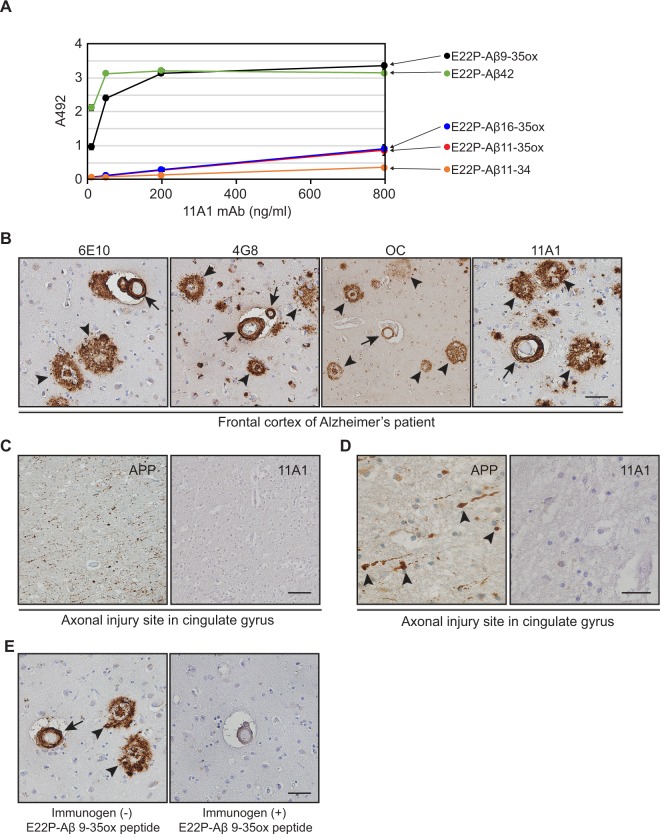
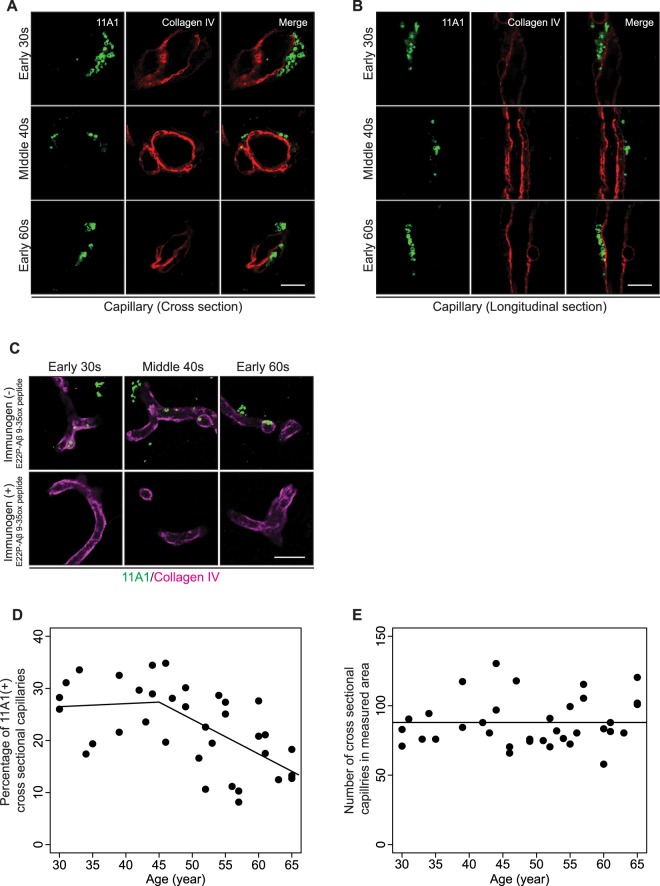
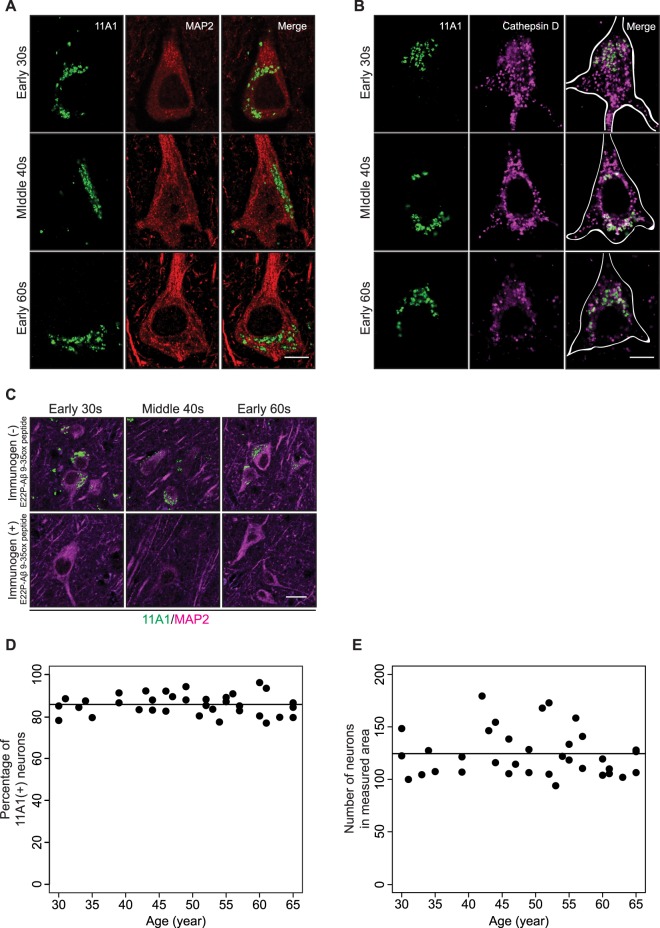
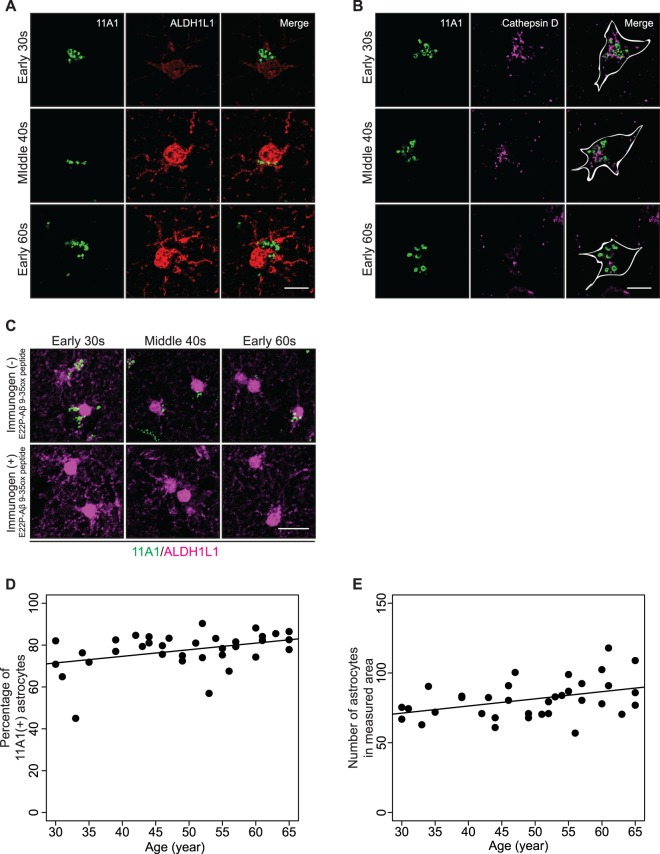
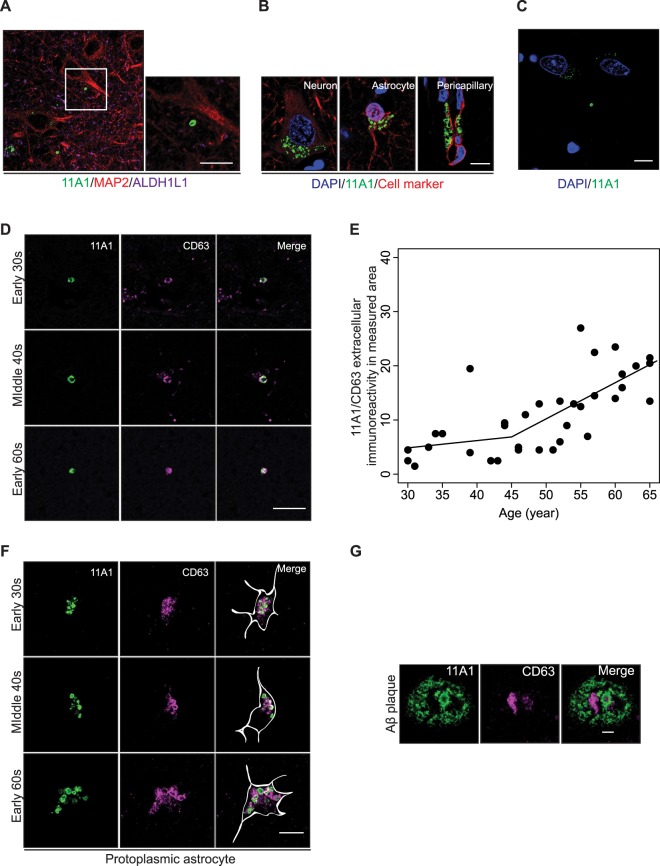
Amyloid β (Aβ) plays a critical role in the pathogenesis of Alzheimer's disease. Nevertheless, its distribution and clearance before Aβ plaque formation needs to be elucidated. Using an optimized immunofluorescent staining method, we examined the distribution of Aβ in the post-mortem parietal cortex of 35 subjects, 30 to 65 years of age, APOE ε3/ε3, without AD lesions. We used 11A1, an antibody against an Aβ conformer which forms neurotoxic oligomers. 11A1 immunoreactivity (IR) was present in cortical neurons, pericapillary spaces, astrocytes and the extracellular compartment at 30 years of age. The percentage of neurons with 11A1 IR did not change with age, but the number and percentage of astrocytes with 11A1 IR gradually increased. Notably, the percentage of pericapillary spaces labeled with 11A1 IR declined significantly in the 5th decade of the life, at the same time that 11A1 IR increased in the extracellular space. Our findings indicate that the Aβ toxic conformer is normally present in various cell types and brain parenchyma, and appears to be constitutively produced, degraded, and cleared from the inferior parietal cortex. The decrease in pericapillary Aβ and the concomitant increase of extracellular Aβ may reflect an age-associated impairment in Aβ clearance from the brain.


Conflict of interest statement

The authors declare no competing interests.

Figures

Figure 1
Figure 1
Optimized immunofluorescence procedure on human brain with tissue quality screening. (A) Quenching of lipofuscin autofluorescence signal in human brain sections with TrueBlack treatment. Confocal imaging of inferior parietal layer V pyramidal cortical neurons immunostained with MAP2 antibody are shown on the far left panels. The two central panels illustrate the autofluorescence of lipofuscin in the red and far-red channels. The far right panels show the merged images. The top panel illustrates results in the absence of TrueBlack treatment and shows prominent lipofuscin autofluorescence in the red and far red channels and in the merged image. The bottom panel shows complete quenching of the lipofuscin signal with TrueBlack treatment. The images were taken under 63x objective lens. Scale bars 5 µm. (B) Quenching of nonspecific binding of anti-rabbit IgG secondary antibody. Tissues from brains with AD changes had marked non-specific binding of anti-rabbit IgG which can be prevented by 0.5% Tween20 in secondary antibody incubation buffer. The top panel shows section of parietal cortex from a control subject. The bottom panel corresponds to parietal cortex from an AD case. On the left, in the absence of surfactant there is prominent non-specific binding of anti-rabbit IgG, which disappears in the presence of 0.5% Tween20. The images were taken under 20x objective lens. Scale bars 20 µm. (C and D) Purkinje cells of the cerebellum immunostained with Beta-tubulin antibody. In (C), the left panel shows the structural integrity of the cell body and dendrites in a high-quality tissue sample. In contrast, the right panel shows the loss of immunostaining and disintegration of dendrites in a low-quality tissue sample. The images were taken under 20x objective lens. Scale bars 20 µm. In (D), the left panel shows well preserved axonal morphology and the right panel shows fragmentation of axons. The images were taken under 10x objective lens. Scale bars 50 µm. (E) Neurons of the parietal cortex immunostained with MAP2 antibody. The left panel shows well preserved cell bodies and dendrites. The right panel demonstrates fragmentation of dendrites and deformed cell bodies. The images were taken under 20x objective lens. Scale bars 20 µm. (F) Parietal cortex white matter astrocytes immunostained for GFAP. Left panel shows intact cell bodies and processes, which are disintegrating in the right panel. The images were taken under 20x objective lens. Scale bars 20 µm. (G) Tissue quality versus postmortem interval. Postmortem tissues (n = 36) were classified as high- or low-quality based on the integrity of Purkinje cells as described in (C). The plots show that there is no correlation between postmortem interval and tissue preservation (p = 0.5907). The bars in the graph represents the mean of postmortem interval in each group. (H) Demography and neuropathological diagnoses of autopsied subjects assessed in (G).
Figure 2
Figure 2
Characterization of immunoreactivity of 11A1 antibody. (A) Assessment of the binding affinity of 11A1 antibody against various synthetic Aβ peptides. E22P-Aβ42 (green), E22P-Aβ9-35ox (black), E22P-Aβ11-35ox (red), E22P-Aβ16-35ox (blue), and E22P-Aβ11-34 (orange) were synthesized and the binding affinity of 11A1 antibody for each peptide was assessed by Enzyme immunoassay. The 11A1 antibody exhibited high binding affinity for E22P-Aβ42 and E22P-Aβ9-35ox. Data are expressed as mean ± SD of three independent measurements. (B) Comparison of 11A1 antibody staining pattern with that of 6E10, 4G8, and OC antibodies. Postmortem human frontal cortex sections of an Alzheimer’s disease patient were stained with 6E10 (left panel), 4G8 (center left panel), OC (center right panel) and 11A1 (right panel) antibodies. Senile plaques (arrow heads) and vascular amyloid (arrows) are identified by 11A1 antibody with a similar pattern to that of the other three Aβ antibodies. The images were taken under 20x objective lens. Scale bar 50 µm. (C and D) Assessment of 11A1 cross-reactivity against APP. Histological sections of human cingulate gyrus with traumatic axonal injury were stained with 22C11 (APP antibody) (left panel) and 11A1 (right panel) antibodies. The traumatic axonal balloons display intense signal with the antibody for APP (arrowheads), but these lesions are not stained with 11A1 antibody. (C) The images were taken under 20x objective lens. Scale bar 50 µm. (D) The images were taken under 40x objective lens. Scale bar 20 µm. (E) Testing 11A1 antibody specificity for Aβ toxic conformer in senile plaques and blood vessels. 11A1 antibody was pre-incubated without (left panel) or with (right panel) its immunogen, E22P-Aβ9-35ox peptide, prior to incubation of tissues with the primary antibody. The pre-incubation with immunogen abrogates the signal in senile plaques and blood vessels. The images were taken under 20x objective lens. Scale bar 50 µm.
Figure 3
Figure 3
11A1 immunoreactivity in pericapillary spaces. (A and B) Representative images were obtained under 63x objective lens. Pericapillary spaces in inferior parietal cortex, layer V, immunostained with 11A1 and Collagen IV. The rows of figures correspond to three age groups: early 30 s, middle 40 s, and early 60 s. Left panels show the 11A1 signal, middle panels indicate the Collagen IV signal and right panels show merged images. (A) Capillary cross sections, (B) capillary longitudinal sections. Scale bars (A and B), 5 µm. (C) Verification of 11A1 antibody’s specificity against Aβ toxic conformer in pericapillary space of the three age groups. The 11A1 antibody was pre-incubated with (bottom panels) or without (top panels) its immunogen, E22P-Aβ9-35ox peptide, prior to incubation of tissues with the primary antibody. The pre-incubation with immunogen abrogates the 11A1 signal around Collagen IV signal (magenta). Images were obtained under 20x objective lens. Scale bar 20 µm. (D) Percentage of pericapillary spaces labeled with 11A1 in measured area across age-spectrum (30-65 years). The relationship with age is not statistically significant before age 45 (p = 0.82), but it becomes highly significant after age 45 (p = 0.0006) by the Piecewise regression. (E) Number of cross sectional pericapillary spaces in measured area across age-spectrum (30–65 years). There is no significant change in the number of cross sectional capillary pericapillary spaces with age (P = 0.496).
Figure 4
Figure 4
11A1 immunoreactivity in neurons. (A and B) Representative images were obtained under 63x objective lens. Cortical neurons of inferior parietal cortex, layer V, co-stained with 11A1 and MAP2 antibodies and 11A1, MAP2 and Cathepsin D antibodies. The rows of figures correspond to three age groups: early 30 s, middle 40 s, and early 60 s. (A) Left panels show the 11A1 signal (green), middle panels indicate MAP2 signal (red) and right panels show merged images. Scale bar 5 µm. (B) Left panels show the 11A1 signal, middle panels indicate Cathepsin D signal and right panels show merged images. The white contours in the merged images indicates the cell shape identified by MAP2. Intracellular 11A1 immunoreactivity (green) partially colocalized with Cathepsin D signal (Magenta). Scale bar 5 µm. (C) Verification of 11A1 antibody’s specificity against Aβ toxic conformer in neurons of the three age groups. 11A1 antibody was pre-incubated with (bottom panels) or without (top panels) its immunogen, E22P-Aβ9-35ox peptide, prior to incubation of tissue sections with the primary antibody. The pre-incubation with immunogen abrogates the 11A1 signal (green) in and around MAP2 signals (magenta). Images were obtained under 20x objective lens. Scale bar 20 µm. (D) Percentage of cortical neurons labeled with 11A1 in measured area across the age-spectrum (30–65 years). The relationship with age is not significant (p = 0.807). (E) Number of neurons in measured area across the age-spectrum (30–65 years). There is no significant change in the number of neurons with age (p = 0.6061).
Figure 5
Figure 5
11A1 immunoreactivity in protoplasmic astrocytes. (A and B) Representative images were obtained under 63x objective lens. Protoplasmic astrocytes of human inferior parietal cortex, layer V, immunostained with 11A1 and ALDH1L1 antibodies and 11A1, GFAP and Cathepsin D antibodies. The rows of figures correspond to three age groups: early 30 s, middle 40 s, and early 60 s. (A) Left panels show the 11A1 signal (green), middle panels correspond to the ALDH1L1 signal (red) and right panels show the merged images. Scale bar 5 µm. (B) Left panels show the 11A1 signal, middle panels correspond to the Cathepsin D signal (magenta) and right panels show the merged images. The white contours in the merged images indicate the cell shape identified by GFAP. Separate localization of the 11A1 immunoreactivity and Cathepsin D signals in the astrocytes is demonstrated. Scale bar 5 µm. (C) Verification of 11A1 antibody’s specificity against Aβ toxic conformer in protoplasmic astrocytes of the three age groups. The 11A1 antibody was pre-incubated with (bottom panels) or without (top panels) its immunogen, E22P-Aβ9-35ox peptide, prior to incubation of tissue sections with primary antibody. The pre-incubation with immunogen abrogates the 11A1 signal (green) in and around ALDH1L1 signal (magenta). Images were obtained under 20x objective lens. Scale bar 20 µm. (D) Percentage of protoplasmic astrocytes labeled with 11A1 of the astrocytes in measured area across the age-spectrum (30–65 years). The percentage of 11A1 labeled astrocytes gradually increases by age (p = 0.020). (E) Number of the astrocytes in measured area across the age-spectrum (30–65 years). Number of astrocytes gradually increases by age (p = 0.014).
Figure 6
Figure 6
Extracellular 11A1 immunoreactivity. (A) Representative images of an extracellular 11A1 immunoreactivity of inferior parietal cortex, layer V (63x objective lens). Left panel shows the merged image of 11A1 (green), MAP2 (red) and ALDH1L1 (magenta) signals. The area outlined by the white rectangle is magnified in the right panel and shows the extracellular 11A1 immunoreactivity. Scale bar 5 µm. (B) Representative immunostaining patterns of 11A1 antibody in neurons, astrocytes and pericapillary spaces in human cerebral cortex (63x objective lens). The row of figures shows immunostaining with 11A1 (green) and cellular/compartment marker (red) antibodies combined with DAPI staining. The cellular marker for neuron is MAP2 and for astrocyte is ALDH1L1, for pericapillary space is Collagen IV. The 11A1 immunoreactive particles form clusters around the DAPI signal in neurons and astrocytes. In the pericapillary space, there are both clusters and rows of 11A1 immunoreactive particles near the DAPI signal (blue). Scale bar 5 µm. (C) Staining pattern of the extracellular 11A1 immunoreactivity (green) ≥5 µm apart from DAPI signals (blue). In this compartment, the 11A1 immunoreactive particles do not form clusters, as seen in Fig. 6B, but appear as single and isolated structures independent of neuronal and astrocytic cell bodies and of blood vessels. Scale bar 5 µm. (D) Colocalization of the extracellular 11A1 immunoreactivity (green) with CD63 signal (magenta). The criteria for the identification of the extracellular 11A1 immunoreactivity is described in the method section. The rows of figures correspond to three age groups: early 30 s, middle 40 s, and early 60 s. Scale bar 5 µm. (E) Total number of the extracellular 11A1 immunoreactivity in measured area across the age-spectrum (30–65 years). The relationship with age is not statistically significant before age 45 (P = 0.51), but it becomes highly significant after age 45 (P < 0.0001) by the Piecewise regression. (F) Colocalization of 11A1 (green) and CD63 (magenta) immunoreactivity in protoplasmic astrocytes. The rows of figures correspond to three age groups: early 30 s, middle 40 s, and early 60 s. Left panels show the 11A1 signal, middle panels the CD63 signal, and right panels the merged images. The white line in the merged images indicates the cell shape identified by GFAP signal. Scale bar 5 µm. (G) Representative image of 11A1 labeled Aβ plaque and CD63 signal. Left panels show the 11A1 labeled Aβ plaque (green), middle panels the CD63 signal (magenta), and right panels the merged images. Scale bar 5 µm.

Similar articles

Cited by

References

    1. Querfurth HW, LaFerla FM. Alzheimer’s disease. N Engl J Med. 2010;362:329–344. doi: 10.1056/NEJMra0909142. - DOI - PubMed
    1. O’Brien RJ, Wong PC. Amyloid precursor protein processing and Alzheimer’s disease. Annu. Rev. Neurosci. 2011;34:185–204. doi: 10.1146/annurev-neuro-061010-113613. - DOI - PMC - PubMed
    1. Driscoll I, et al. Impact of Alzheimer’s pathology on cognitive trajectories in nondemented elderly. Ann Neurol. 2006;60:688–695. doi: 10.1002/ana.21031. - DOI - PubMed
    1. Reiman EM, et al. Preclinical evidence of Alzheimer’s disease in persons homozygous for the epsilon 4 allele for apolipoprotein E. N Engl J Med. 1996;334:752–758. doi: 10.1056/NEJM199603213341202. - DOI - PubMed
    1. Sperling RA, et al. Toward defining the preclinical stages of Alzheimer’s disease: recommendations from the National Institute on Aging-Alzheimer’s Association workgroups on diagnostic guidelines for Alzheimer’s disease. Alzheimer’s & dementia: the journal of the Alzheimer’s Association. 2011;7:280–292. doi: 10.1016/j.jalz.2011.03.003. - DOI - PMC - PubMed

Publication types