. 2019 Mar;38(12):2092-2107.
doi: 10.1038/s41388-018-0562-z. Epub 2018 Nov 15.

Estrogen-dependent DLL1-mediated Notch signaling promotes luminal breast cancer

Affiliations

Estrogen-dependent DLL1-mediated Notch signaling promotes luminal breast cancer

Sushil Kumar et al. Oncogene. 2019 Mar.

Abstract

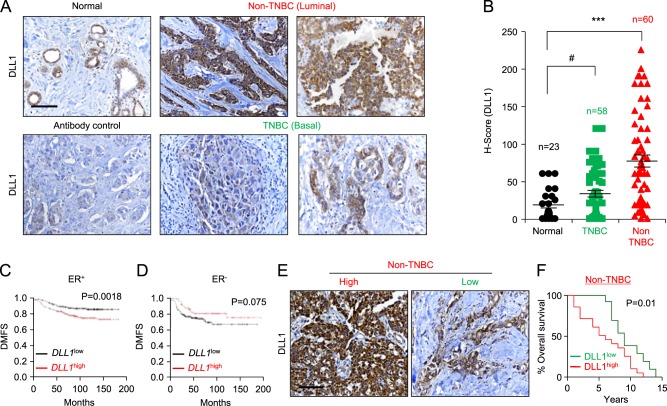
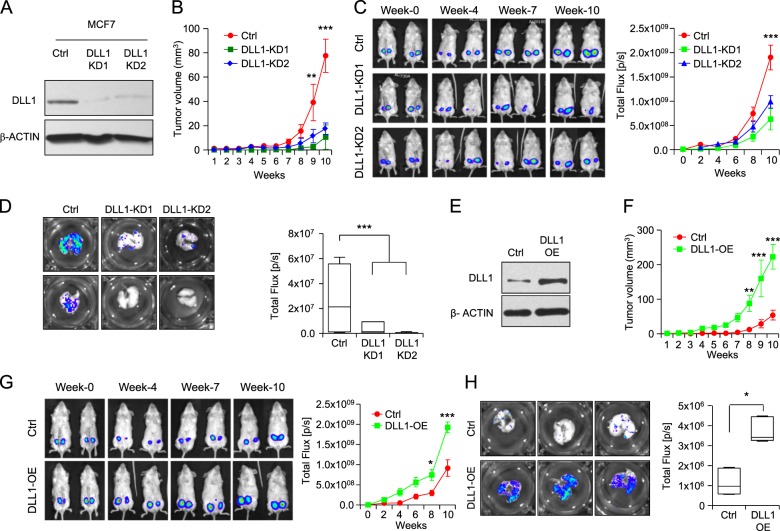
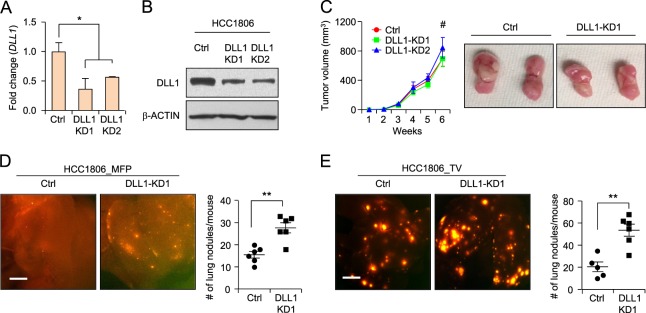
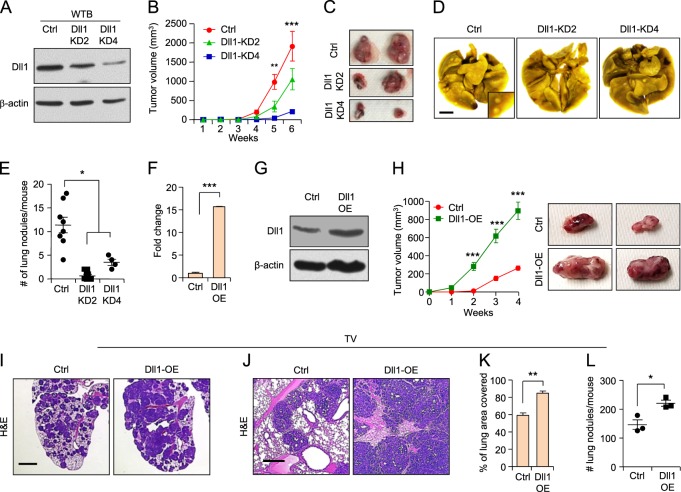
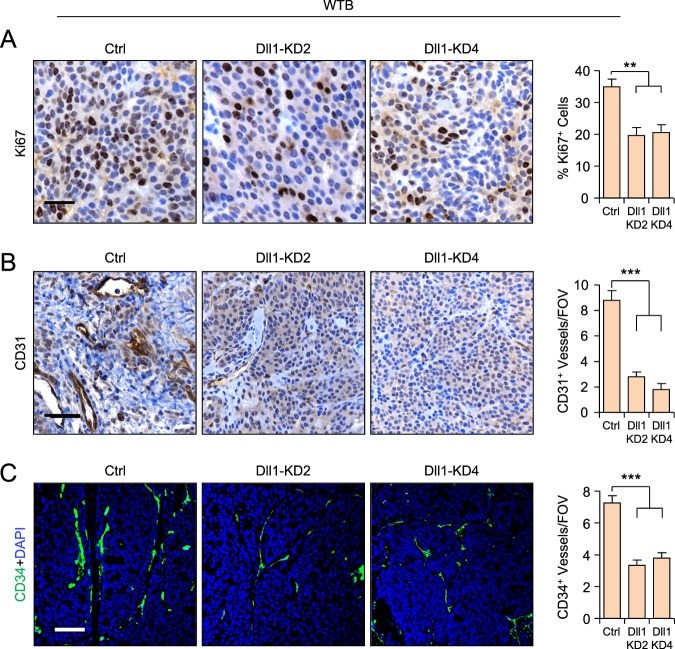
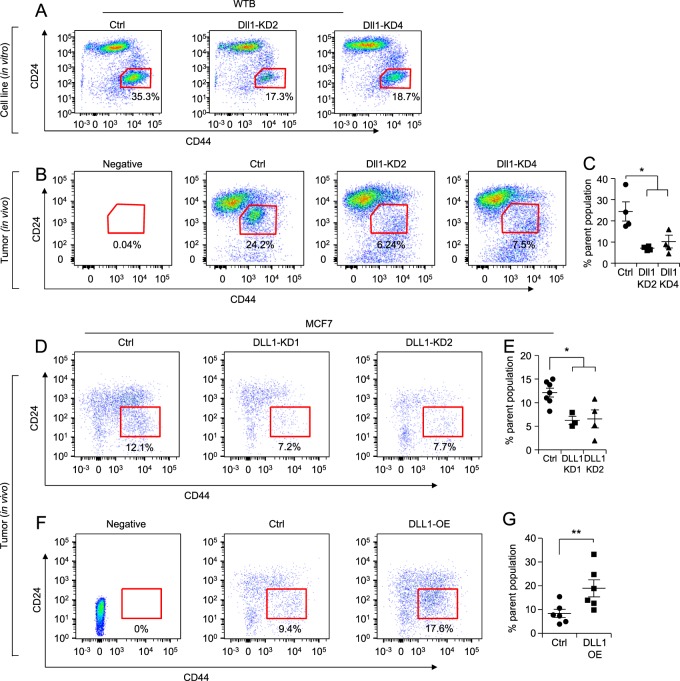
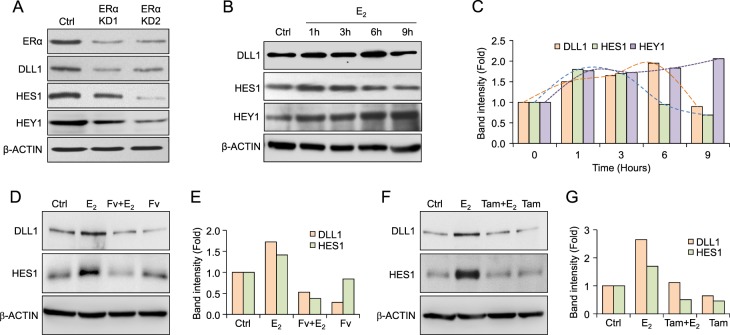
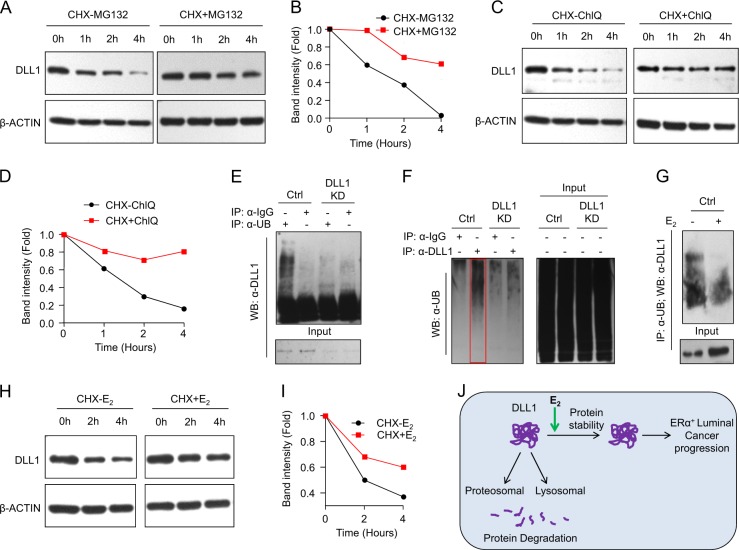
Aberrant Notch signaling is implicated in several cancers, including breast cancer. However, the mechanistic details of the specific receptors and function of ligand-mediated Notch signaling that promote breast cancer remains elusive. In our studies we show that DLL1, a Notch signaling ligand, is significantly overexpressed in ERα+ luminal breast cancer. Intriguingly, DLL1 overexpression correlates with poor prognosis in ERα+ luminal breast cancer, but not in other subtypes of breast cancer. In addition, this effect is specific to DLL1, as other Notch ligands (DLL3, JAGGED1, and JAGGED2) do not influence the clinical outcome of ERα+ patients. Genetic studies show that DLL1-mediated Notch signaling in breast cancer is important for tumor cell proliferation, angiogenesis, and cancer stem cell function. Consistent with prognostic clinical data, we found the tumor-promoting function of DLL1 is exclusive to ERα+ luminal breast cancer, as loss of DLL1 inhibits both tumor growth and lung metastasis of luminal breast cancer. Importantly, we find that estrogen signaling stabilizes DLL1 protein by preventing its proteasomal and lysososmal degradations. Moreover, estrogen inhibits ubiquitination of DLL1. Together, our results highlight an unexpected and novel subtype-specific function of DLL1 in promoting luminal breast cancer that is regulated by estrogen signaling. Our studies also emphasize the critical role of assessing subtype-specific mechanisms driving tumor growth and metastasis to generate effective subtype-specific therapeutics.


Conflict of interest statement

The authors declare that they have no conflict of interest.

Figures

Fig. 1
Fig. 1
DLL1 expression is higher in luminal (non-TNBC) breast cancer patients and is associated with poor patient survival. a, b Representative IHC images (a) and calculated H-score (b) show higher DLL1 protein levels in non-TNBC (n = 60) compared to tumor-adjacent normal tissue (n = 23) and TNBC (n = 58) patient tumors. The H-Score was calculated by multiplying intensity with abundance. Negative control is tumor tissue stained with anti-IgG antibody showing no nonspecific staining. c, d Kaplan–Meier (KM) plots show poor distant metastasis-free survival (DMFS) of breast cancer patients by DLL1 expression status (DLL1high or DLL1low) in ER+ (c), ER (d). n = 965 ER+ patients (c) and n = 430 ER (d) patients were used to make KM-plots. e Representative IHC images of non-TNBC patient breast tumors show DLL1high and DLL1low protein expression respectively. f KM plot shows poor patient survival of patients with high levels of DLL1 protein compared to patients with low levels of DLL1 protein. H-score was evaluated to stratify patients into DLL1 high and low expressers based on the IHC with DLL1 antibody on the non-TNBC patient breast tumors. n = 32 non-TNBC samples were used with overall survival data. Samples were stratified into DLL1low (n = 12) and DLL1high (n = 20) groups for KM plot analysis. b Mann−Whitney U test and c, d, f Log-rank test was used to calculate p values. b Data are presented as the mean ± SEM. ***p < 0.001 and # nonsignificant. Scale bars, 40 µm (a, e)
Fig. 2
Fig. 2
DLL1 promotes human ERα+ luminal tumor growth and metastasis. a Western blot shows DLL1 protein expression in MCF7 control and DLL1-KD (KD1 and KD2) cells after lentiviral shRNA-mediated knockdown (KD). Firefly luciferase-expressing MCF7 control and DLL1-KD (KD1 and KD2) cells (2×10⁶) were injected into mammary fat pad (MFP) of NSG mice. b Tumor growth curves show tumor volume of indicated groups. Representative mice images (c, left) and tumor growth curves (c, right) (total flux, photons per second, p/s) show bioluminescent signal from tumors in vivo. b, c n = 8 tumors/group. Contralateral mammary glands (fourth position) of n = 4 mice were used for injection/group. d Ex vivo lung metastasis images from mice injected with MCF7 control and DLL1-KD (KD1 and KD2) cells using bioluminescence imaging (BLI). d n = 4 mice/group. e Western blot show DLL1 protein expression in MCF7 control and DLL1-OE cells after lentivirus-mediated overexpression (OE) of DLL1. Firefly luciferase-expressing MCF7 control and DLL1-OE cells (2×10⁶) were injected into mammary fat pad (MFP) of NSG mice. f Tumor growth curves show palpated data of tumor volume of indicated groups. Representative mice images (g, left) and tumor growth curves (g, right) (total flux, photons per second, p/s) show bioluminescent signal from tumors in vivo. f, g n = 6 tumors/group. Contralateral mammary glands (fourth position) of n = 3 mice were used for injection/group. h Ex vivo BLI images of lungs from mice injected with MCF7 control and DLL1-OE cells show metastases in indicated groups. n = 3 mice/group. d, h Mann−Whitney U test were used to compute p value. b, c, f, g Two-way ANOVA test with Bonferroni correction was performed to compute statistical significance for tumor growth curve data. Data are presented as the mean ± SEM. *p < 0.05, **p < 0.01 and ***p < 0.001
Fig. 3
Fig. 3
DLL1 does not influence tumor growth but inhibits metastasis in human TNBC. a, b qPCR and western blot data show DLL1 mRNA and protein levels in human TNBC cell line HCC1806 after lentivirus-mediated knockdown (KD) of DLL1. c 200,000 HCC1806 control and DLL1-KDs (KD1 and KD2) cells were injected into mammary fat pad of NSG mice. Tumor growth curves (c, left) and representative whole tumor images (c, right) show no significant difference in growth of HCC1806 DLL1-KDs (KD1 and KD2) primary tumors compared to control, n = 6 mice used per group. d Representative whole mount images of lungs from mice with mammary fat pad injection (MFP) show metastasis as seen by RFP positivity (d, left) and respective quantification is shown in (d, right). e 200,000 HCC1806 control and DLL1-KD1 tumor cells were injected into blood stream of NSG mice through tail-vein. Lung metastasis as seen by RFP+ nodules show higher number of RFP+ lung nodules in DLL1-KD1 compared to control (e, left). Quantification is shown in (e, right). n = 5 mice (Ctrl) and n = 6 mice (DLL1-KD1) were used. d, e Mann−Whitney U test and c two-way ANOVA test with Bonferroni correction was performed to compute statistical significance. Scale bars, 500 µm in (d, e). a Data are presented as the mean ± SD. c−e Data are presented as the mean ± SEM. *p < 0.05, **p < 0.01 and #nonsignificant
Fig. 4
Fig. 4
Dll1 promotes tumor growth and metastasis in mouse luminal/non-TNBC tumors. a Western blot data showing Dll1 protein expression in control and Dll1-KD2 and Dll1-KD4 WTB luminal cells after lentiviral shRNA-mediated knockdown of WTB cells (KD). b, c WTB control and Dll1-KD (KD2 and KD4) cells (200,000 cells/injection) were injected into mammary fat pad of FVB mice, and tumor growth was observed by weekly palpation. Representative tumor growth curves (b) and whole tumor images (c) show reduced tumor growth of WTB Dll1-KD (KD2 and KD4) cells compared to control. d, e Representative lung images show metastatic lung nodules in (d) and respective quantification of lung nodules in (e) in mice after mammary fat pad injection (MFP). be Ctrl n = 8, Dll1-KD2 n = 7 and Dll1-KD4 n = 4 mice. f, g qPCR and western blot data showing Dll1 mRNA and protein expression in control and Dll1-OE WTB luminal cells after lentiviral-mediated overexpression of Dll1 (OE). h WTB control and Dll1-OE cells (200,000 cells/injection) were injected into mammary fat pad of FVB mice, and tumor growth was observed by weekly palpation. Representative tumor growth curves (h, left) and whole tumor images (h, right) show enhanced tumor growth of WTB Dll1-OE cells compared to control. i−l 500,000 WTB cells were injected into blood stream of FVB mice through tail-vein. i, j Representative H&E lung images at low and high magnifications show higher number of lung nodules in lungs of mice injected with WTB Dll1-OE cells compared to control. k, l Quantification of area and number of lung metastatic nodules of indicated groups. h−l n = 3 mice/group. Scatter plots represent number of animals as dots (n = 3). e, f, k and l Mann−Whitney U test and b, h two-way ANOVA test with Bonferroni correction was performed to compute statistical significance. Scale bars, 500 µm (d), 200 µm (i) and 100 µm (j). f Data are presented as the mean ± SD. b, e, h, k−l Data are presented as the mean ± SEM. *p < 0.05, **p < 0.01 and ***p < 0.001
Fig. 5
Fig. 5
Reduction of Dll1 in mouse luminal tumors leads to decreased proliferation and angiogenesis. a, b Representative IHC images show reduced proliferation (Ki67+ cells) (a) and CD31+ blood vessels (b) in WTB Dll1-KD (KD2 and KD4) primary tumors compared to control. c Representative IF images show reduced CD34+ blood vessels in WTB Dll1-KDs (KD2 and KD4) primary tumors compared to control. Quantification is shown in the right of each set of images. a−c Mann−Whitney U test to compute p values. Scale bars, 40 µm (a−c). Data are presented as the mean ± SEM. **p < 0.01 and ***p < 0.001. IHC images were quantified from ten random fields and three different samples per group were used. FOV field of view
Fig. 6
Fig. 6
Dll1 promotes cancer stem cell (CSC) population in luminal/non-TNBC tumors. a FACS data show reduced in vitro CSC population (CD24CD44+ population) in WTB Dll1-KDs (KD2 and KD4) cells compared to control cells. b FACS data show reduced in vivo CSCs population in primary tumors derived from injection of WTB Dll1-KDs (KD2 and KD4) cells compared to control tumors using CD24/CD44 markers. c Bar graph shows percentage of CSC population in WTB Dll1-KD (KD2 and KD4) tumor cells compared to control tumor cells. d, f FACS data show reduced in vivo CSC population (CD24CD44+ population) in primary tumors derived from injection of MCF7 DLL1-KD (KD1 and KD2) cells and DLL1 overexpression (DLL1-OE) cells compared to their respective control tumors. e, g Bar graphs show the quantification of CSC population (CD24CD44+ population) in DLL1-KDs (KD1 and KD2) and DLL1-OE compared to their respective controls. Scatter plots represent number of animals as dots. Mann−Whitney U test was used to compute p values. Data are presented as the mean ± SEM. *p < 0.05 and **p < 0.01
Fig. 7
Fig. 7
E2/ERα signaling enhances DLL1 protein levels. a Western blot shows ERα, DLL1, HES1 and HEY1 protein levels after knockdown (KD1 and KD2) of ERα in luminal MCF7 cells. b Western blots show protein levels of DLL1, HES1, and HEY1 after E2 treatment for indicated time points, which is quantified in (c). d Western blot shows protein levels of DLL1 and HES1 after indicated treatments with E2 and Fulvestrant (Fv) for 12 h to MCF7 cells, which is quantified in (e). f Western blot shows protein levels of DLL1 and HES1 after indicated treatments with E2 and Tamoxifen (Tam) for 12 h to MCF7 cells, which is quantified in (g)
Fig. 8
Fig. 8
E2/ERα signaling stabilizes DLL1 protein levels from proteosomal and lysosomal degradation. a, b Western blot (a) shows decreased DLL1 protein levels in MCF7 cells after blocking of protein synthesis using cyclohexamide (CHX) at indicated timepoints, which is reversed with the treatment of MG132, a proteosomal inhibitor. Quantification of bands was done using ImageJ and is shown in (b). c, d Western blot shows decreased DLL1 protein levels in MCF7 cells after blocking of protein synthesis using cyclohexamide (CHX) at indicated timepoints, which is reversed with the treatment of Chloroquinone (ChlQ), a lysosomal inhibitor. Quantification of bands was done using ImageJ and is shown in (d). e, f Western blot shows polyubiquitination of endogenous DLL1 protein in hormone-deprived MCF7 cells. MCF7 (control and DLL1 KD1) cells were subjected to endogenous immune-precipitation (IP) with anti-Ubiquitin or anti-DLL1 antibodies followed with western blot using either anti-DLL1 or anti-Ubiquitin-specific antibodies respectively. Respective IgG controls were used as a negative control for IP. g Western blot shows decreased polyubiquitination of endogenous DLL1 protein upon 6 h of E2 treatment to MCF7 cells. MCF7 cells were subjected to endogenous immune-precipitation (IP) with anti-Ubiquitin antibody followed with western blot using anti-DLL1 antibody. h, i Western blot (h) and quantification (i) of DLL1 protein levels after blocking of protein synthesis using cyclohexamide (CHX) with or without E2 treatment at indicated timepoints in MCF7 cells. Quantification of bands was done using ImageJ software. j Schematic showing DLL1 protein degradation happens through proteosomal and lysosomal degradation, which is prevented by Estrogen signaling through E2/ERα in luminal breast cancer for promotion and progression of the luminal breast cancer

Similar articles

Cited by

References

    1. Fisher R, Pusztai L, Swanton C. Cancer heterogeneity: implications for targeted therapeutics. Br J Cancer. 2013;108:479–85. doi: 10.1038/bjc.2012.581. - DOI - PMC - PubMed
    1. Bertucci F, Birnbaum D. Reasons for breast cancer heterogeneity. J Biol. 2008;7:6. doi: 10.1186/jbiol67. - DOI - PMC - PubMed
    1. Onitilo AA, Engel JM, Greenlee RT, Mukesh BN. Breast cancer subtypes based on ER/PR and Her2 expression: comparison of clinicopathologic features and survival. Clin Med Res. 2009;7:4–13. doi: 10.3121/cmr.2008.825. - DOI - PMC - PubMed
    1. Sorlie T, Perou CM, Tibshirani R, Aas T, Geisler S, Johnsen H, et al. Gene expression patterns of breast carcinomas distinguish tumor subclasses with clinical implications. Proc Natl Acad Sci USA. 2001;98:10869–74. doi: 10.1073/pnas.191367098. - DOI - PMC - PubMed
    1. Thomas C, Gustafsson JA. Estrogen receptor mutations and functional consequences for breast cancer. Trends Endocrinol Metab. 2015;26:467–76. doi: 10.1016/j.tem.2015.06.007. - DOI - PubMed

MeSH terms