. 2018 Nov 15;8(1):16837.
doi: 10.1038/s41598-018-35198-6.

Inhibition of FAO in AML co-cultured with BM adipocytes: mechanisms of survival and chemosensitization to cytarabine

Affiliations

Inhibition of FAO in AML co-cultured with BM adipocytes: mechanisms of survival and chemosensitization to cytarabine

Yoko Tabe et al. Sci Rep. .

Abstract

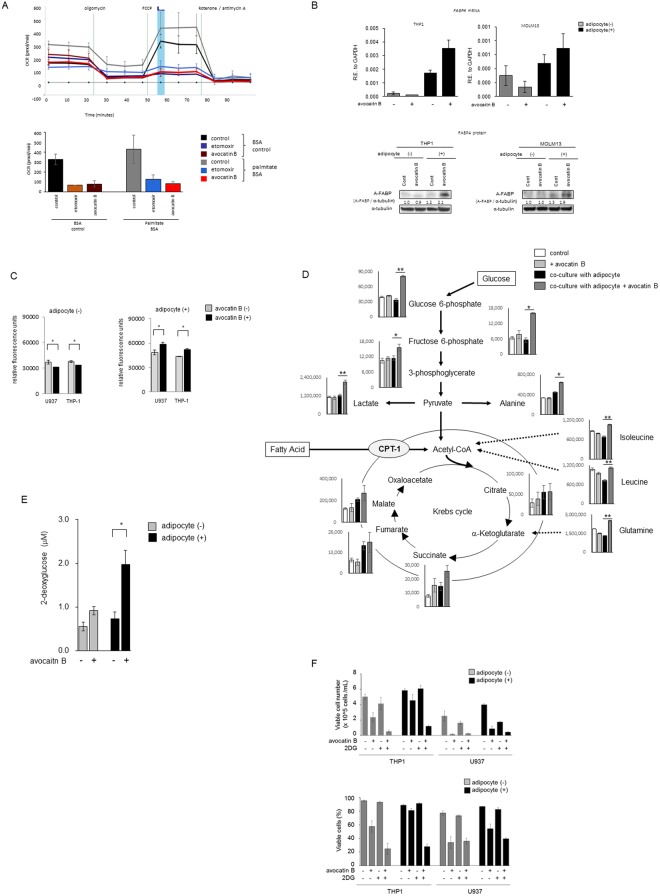
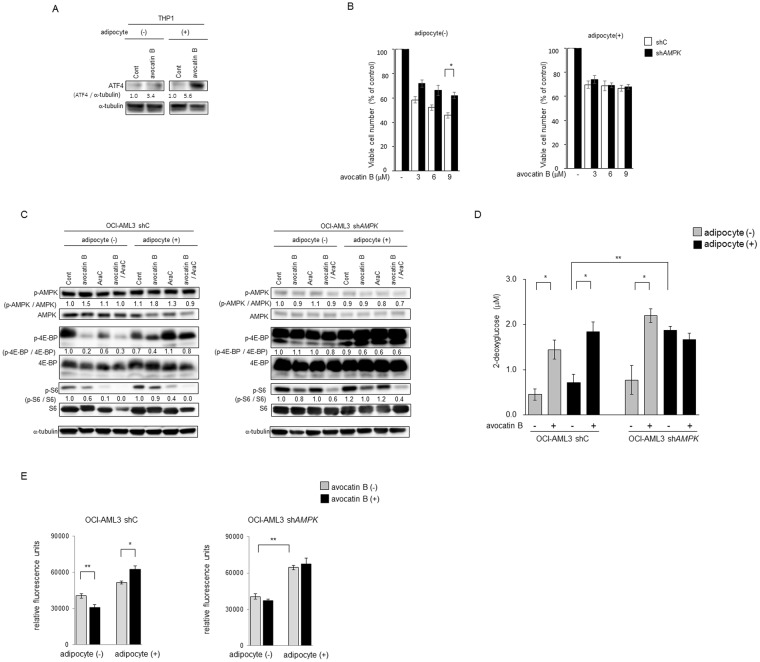
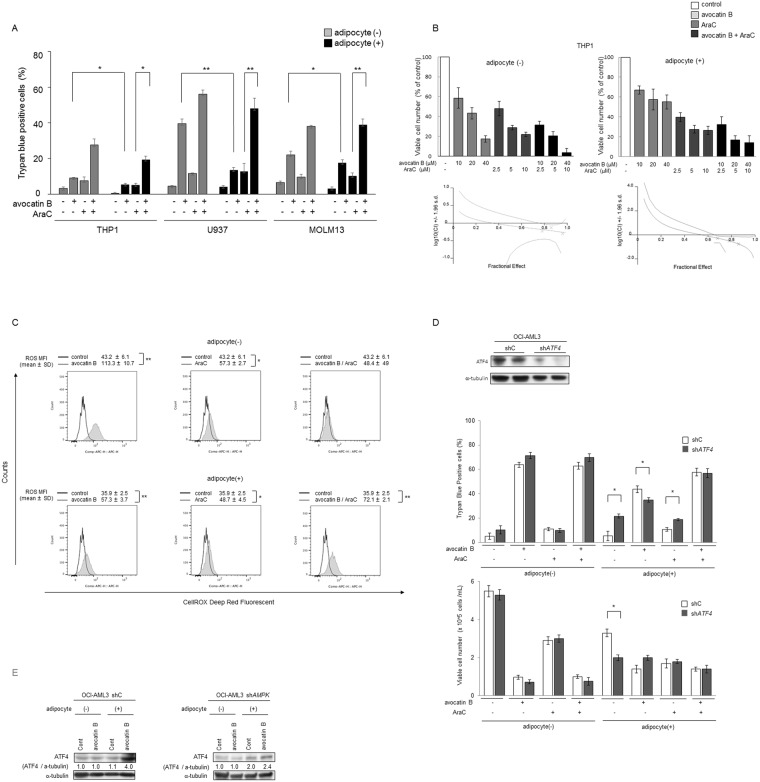
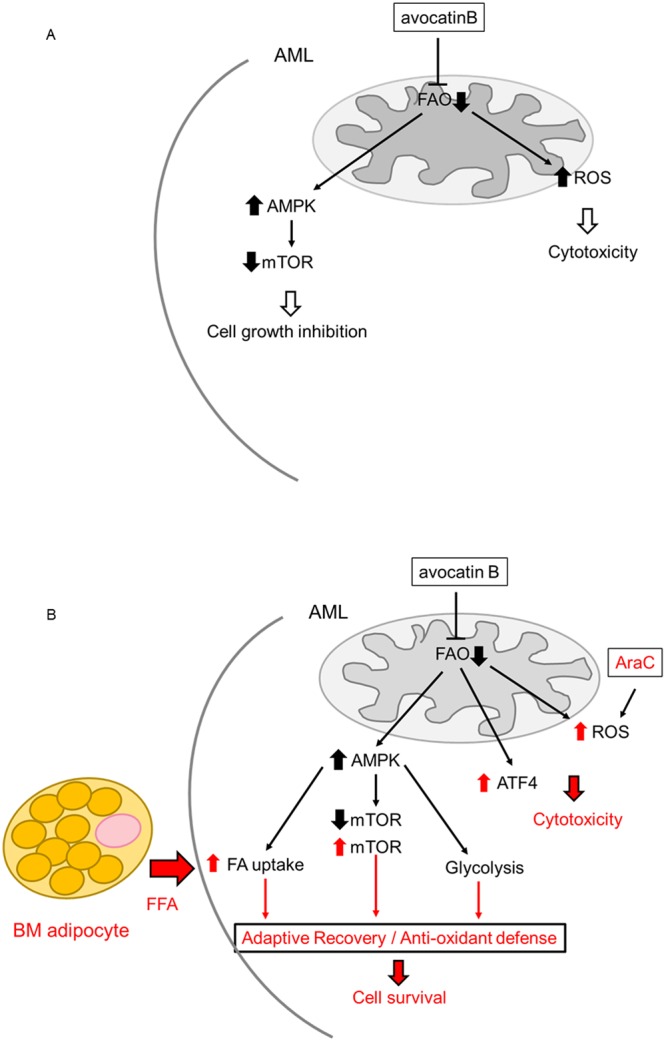
Adipocytes are the prevalent stromal cell type in adult bone marrow (BM), and leukemia cells continuously adapt to deficiency of nutrients acquiring chemoresistant profiles in the BM microenvironment. We have previously shown that fatty acid metabolism is a key energy pathway for survival of acute myeloid leukemia (AML) cells in the adipocyte-abundant BM microenvironment. The novel fatty acid β-oxidation (FAO) inhibitor avocatin B, an odd-numbered carbon lipid derived from the avocado fruit, induced apoptosis and growth inhibition in mono-cultured AML cells. In AML cells co-cultured with BM adipocytes, FAO inhibition with avocatin B caused adaptive stimulation of free fatty acid (FFA) uptake through upregulation of FABP4 mRNA, enhanced glucose uptake and switch to glycolysis. These changes reflect the compensatory response to a shortage of FFA supply to the mitochondria, and facilitate the protection of AML cells from avocatin B-induced apoptosis in the presence of BM adipocytes. However, the combination treatment of avocatin B and conventional anti-AML therapeutic agent cytarabine (AraC) increased reactive oxygen species and demonstrated highly synergistic effects on AML cells under BM adipocyte co-culture condition. These findings highlight the potential for combination regimens of AraC and FAO inhibitors that target bone marrow-resident chemoresistant AML cells.


Conflict of interest statement

The authors declare no competing interests.

Figures

Figure 1
Figure 1
Structure of the fatty acid oxidation inhibitor avocatin B. Avocatin B is an odd-numbered carbon lipid with a 1:1 ratio of two 17-carbon lipids, derived from the avocado fruit.
Figure 2
Figure 2
Avocatin B increases fatty acid uptake and glycolysis in THP-1 cells co-cultured with BM adipocytes. (A) Kinetic graph of the FAO/XF Cell Mito Stress Test assay of THP-1 cells, which determine the oxidization of exogeneous fatty acids; palmitate. The oxygen consumption rate (OCR) indicates the proportion of respiration that is supported by exogenous fatty acids under conditions of substrate limitation or with Palmitate-BSA substrate for exogenous fatty acids. Utilization of exogenous fatty acids was dependent on placing energetic stress via FCCP on the cells. Etomoxir (100uM) used as the positive control. Bar chart highlighting the differences in maximal respiration 50 minutes measurement (blue bar) which indicates utilization of exogenous fatty acids. Graphs show representative data from three independent experiments. (B) THP-1 and MOLM13 cells were cultured with or without avocatin B (10 μM) for 24 hours in the presence or absence of BM adipocytes. FABP4 mRNA expression in the cells was determined by quantitative RT-PCR. The expression of transcripts of each gene relative (R.E.) to the expression of GAPDH transcripts was determined as described in Materials and Methods. Graphs show representative data from three independent experiments. A-FABP protein expression levels were detected by immunoblotting; Cont, controls. Results shown are representative of three independent experiments. (C) U937 and THP-1 cells were cultured with or without avocatin B (20 μM) for 2 hours in the presence or absence of BM adipocytes under serum-starved conditions and their fatty acid uptake assessed. Cells were plated at 50,000 cells/well, after which a fatty acid mixture (dodecanoic acid fluorescent fatty acid substrate) was added and the cells incubated for 1 hour. Fluorescent signal was measured with a plate reader using the bottom read mode. Graphs show the mean ± SD of the results from three independent experiments. *p < 0.05. (D) THP-1 cells were treated with avocatin B (10 μM) for 24 hours in the presence or absence of MSC-derived BM adipocytes under serum-starved conditions. Levels of metabolites in the cells were quantified by CE-TOF-MS analysis. The quantification data are superimposed on a metabolic pathway map that includes the glycolysis and Krebs pathways. Results shown are representative of three independent CE-TOF-MS experiments. Bars, SD. All p-values were determined by the Wilcoxon matched pair test. *p < 0.05; **p < 0.01. (E) THP-1 cells were cultured with or without avocatin B (20 μM) in the presence or absence of BM adipocytes under serum-starved conditions and glucose uptake measured. Plated cells were treated with avocatin B for 2 hours. Fluorescent signal was measured with a plate reader using the bottom read mode. Graphs show the mean ± SD of the results from three independent experiments. *p < 0.05. (F) THP-1 and U937 cells were treated with avocatin B (10 μM), 2DG (5 mM) or avocatin B + 2DG for 48 hours in the presence or absence of BM adipocytes under serum-starved conditions. The cell growth inhibition and cytotoxic effects were determined by cell counts using the trypan blue exclusion method. Graphs show the mean ± SD of the results from three independent experiments. *p < 0.05; **p < 0.01.
Figure 3
Figure 3
Avocatin B increases ATF4 activation and AMPK-mTOR signaling in AMfL cells co-cultured with BM adipocytes. (A) THP-1 cells were co-cultured with BM adipocytes for 24 hours with or without avocatin B (10 μM), and expression levels of ATF4 protein were detected by immunoblotting; Cont, controls. Results shown are representative of three independent experiments. (B) OCI-AML3 cells transfected with control short hairpin RNA (shC) or shRNA against AMPK (shAMPK) were treated with the indicated concentrations of avocatin B for 48 hours in the presence or absence of BM adipocytes under serum-starved conditions. The effects on cell viability were determined by cell counts using the trypan blue exclusion method. Graphs show the mean ± SD of the results from three independent experiments. (C) OCI-AML3 cells transfected with control short hairpin RNA (shC) or shRNA against AMPK (shAMPK) were cultured with or without avocatin B (10 μM) and AraC (3 μM) for 18 hours in the presence or absence of BM adipocytes. Expression levels of AMPK, p-AMPK, 4E-BP1, p-4E-BP1, S6, p-S6 and α-tubulin proteins in the cells were detected by immunoblotting; Cont, controls. Results shown are representative of three independent experiments. (D) OCI-AML3 cells transfected with control short hairpin RNA (shC) or shRNA against AMPK (shAMPK) were cultured with or without avocatin B (20 μM) in the presence or absence of BM adipocytes under serum-starved conditions and glucose uptake measured. Plated cells were treated with avocatin B for 2 hours. Fluorescent signal was measured with a plate reader using the bottom read mode. Graphs show the mean ± SD of the results from three independent experiments. *p < 0.05. (E) OCI-AML3 cells transfected with control short hairpin RNA (shC) or shRNA against AMPK (shAMPK) were cultured with or without avocatin B (20 μM) for 2 hours in the presence or absence of BM adipocytes under serum-starved conditions. Cells were plated at 50,000 cells/well, after which fatty acid (FA) uptake was determined by adding a fatty acid mixture (dodecanoic acid fluorescent fatty acid substrate) and incubating for 1 hour. Fluorescent signal was measured with a plate reader using the bottom read mode. Graphs show the mean ± SD of the results from three independent experiments. **p < 0.01; *p < 0.05.
Figure 4
Figure 4
Effects of avocatin B and AraC on AML cells in presence and absence of co-cultured BM adipocytes. (A) THP-1, U937, and MOLM13 cells were treated with avocatin B (10 μM for THP-1 and U937, 7 μM for MOLM13), AraC (3 μM for THP-1, 0.1 μM for U937, 3 μM for MOLM13) or avocatin B + AraC for 48 hours in the presence or absence of MSC-derived BM adipocytes. Cells were cultured in medium containing 5% FBS. Percentages of cell death were determined by cell counts using the trypan blue exclusion method. Graphs show the mean ± SD of the results from three independent experiments. *p < 0.05; **p < 0.01. (B) THP-1 cells were treated with the indicated concentrations of avocatin B, AraC, or avocatin B + AraC for 48 hours in the presence or absence of BM adipocytes. Percentages of viable cells compared to the control condition were determined by cell counts using the trypan blue exclusion method. Graphs show the mean ± SD of the results from three independent experiments. Combination index (CI) values which assess drug-interaction effects, were then calculated using the calcusyn software, as described in the text. CI values of < 1, > 1 or equal to 1 denote statistical synergy, antagonism, or additivity, respectively. Representative figures shown. (C) U937 cells were treated with/without avocatin B (10 μM), AraC (0.1 μM) or avocatin B + AraC for 24 hours in the presence or absence of BM adipocytes under serum-starved conditions. Representative histograms of CellROX staining (ROS production) in the viable cells (SYTOX staining) under the indicated conditions are shown. Mean fluorescence intensity (MFI) indicates the mean ± SD of results of three independent experiments. *p < 0.05, **p < 0.01. (D) OCI-AML3 cells transfected with control short hairpin RNA (shC) or shRNA against ATF4 (shATF4) were cultured for 48 hours with or without avocatin B (9 μM) and AraC (3 μM) in the presence or absence of BM adipocytes under serum-starved conditions, then the cytotoxic effects and cell growth inhibition were determined by cell counts using the trypan blue exclusion method. Graphs show the mean ± SD of the results from three independent experiments. *p < 0.05. (E) OCI-AML3 cells transfected with control short hairpin RNA (shC) or shRNA against ATF4 (shATF4) were co-cultured with BM adipocytes for 24 hours with or without avocatin B (10 μM), and expression levels of ATF4 protein were detected by immunoblotting; Cont, controls. Results shown are representative of three independent experiments.
Figure 5
Figure 5
Schematic diagram illustrating the mediators involved in the adaptation to ROS stress and cell death induced by avocatin B and AraC in AML cells co-cultured with BM adipocytes. (A) Energetic stress triggered by the inhibition of FAO with avocatin B increases ROS and promotes activation of AMPK pathway that represses mTOR, which results in cytotoxicity and cell growth inhibition. (B) In the adipocyte-abundant BM microenvironment, the adaptive mechanisms upon FAO inhibition by avocatin B, including increase of FA (fatty adic) uptake, upregulation of glycolysis, and positive modification of mTOR signaling might contribute to survival of AML. In turn, AraC combination with avocatin B might associate with heightened ROS induction. Avocatin B also upregulates stress induced ATF4 in AML cells co-cultured with BM adipocytes. FAO inhibition which suppressed oxidative phosphorylation resulted in sensitization to AraC. These findings and our results indicate that the increased dependence on FAO metabolism of the AraC exposed AML cells might be responsible for a synergistic apoptotic effect of avocatin B with AraC under conditions of adipocyte co-cultures. Indeed, we observed that avocatin B and AraC combination treatment increased ROS production only in adipocyte co-cultured AML cells but not in mono-cultured cells. FFA; free fatty acid.

Similar articles

Cited by

References

    1. Farge Thomas, Saland Estelle, de Toni Fabienne, Aroua Nesrine, Hosseini Mohsen, Perry Robin, Bosc Claudie, Sugita Mayumi, Stuani Lucille, Fraisse Marine, Scotland Sarah, Larrue Clément, Boutzen Héléna, Féliu Virginie, Nicolau-Travers Marie-Laure, Cassant-Sourdy Stéphanie, Broin Nicolas, David Marion, Serhan Nizar, Sarry Audrey, Tavitian Suzanne, Kaoma Tony, Vallar Laurent, Iacovoni Jason, Linares Laetitia K., Montersino Camille, Castellano Rémy, Griessinger Emmanuel, Collette Yves, Duchamp Olivier, Barreira Yara, Hirsch Pierre, Palama Tony, Gales Lara, Delhommeau François, Garmy-Susini Barbara H., Portais Jean-Charles, Vergez François, Selak Mary, Danet-Desnoyers Gwenn, Carroll Martin, Récher Christian, Sarry Jean-Emmanuel. Chemotherapy-Resistant Human Acute Myeloid Leukemia Cells Are Not Enriched for Leukemic Stem Cells but Require Oxidative Metabolism. Cancer Discovery. 2017;7(7):716–735. doi: 10.1158/2159-8290.CD-16-0441. - DOI - PMC - PubMed
    1. Samudio I, et al. Pharmacologic inhibition of fatty acid oxidation sensitizes human leukemia cells to apoptosis induction. J Clin Invest. 2010;120:142–156. doi: 10.1172/JCI38942. - DOI - PMC - PubMed
    1. Jones RG, Thompson CB. Tumor suppressors and cell metabolism: a recipe for cancer growth. Genes Dev. 2009;23:537–548. doi: 10.1101/gad.1756509. - DOI - PMC - PubMed
    1. Hassan M, Abedi-Valugerdi M. Hematologic malignancies in elderly patients. Haematologica. 2014;99:1124–1127. doi: 10.3324/haematol.2014.107557. - DOI - PMC - PubMed
    1. Carracedo A, Cantley LC, Pandolfi PP. Cancer metabolism: fatty acid oxidation in the limelight. Nat Rev Cancer. 2013;13:227–232. doi: 10.1038/nrc3483. - DOI - PMC - PubMed

Publication types

MeSH terms