. 2018 Nov 15;8(1):16903.
doi: 10.1038/s41598-018-35043-w.

Telomerase gene expression bioassays indicate metabolic activation of genotoxic lower chlorinated polychlorinated biphenyls

Affiliations

Telomerase gene expression bioassays indicate metabolic activation of genotoxic lower chlorinated polychlorinated biphenyls

Theresa Vasko et al. Sci Rep. .

Abstract

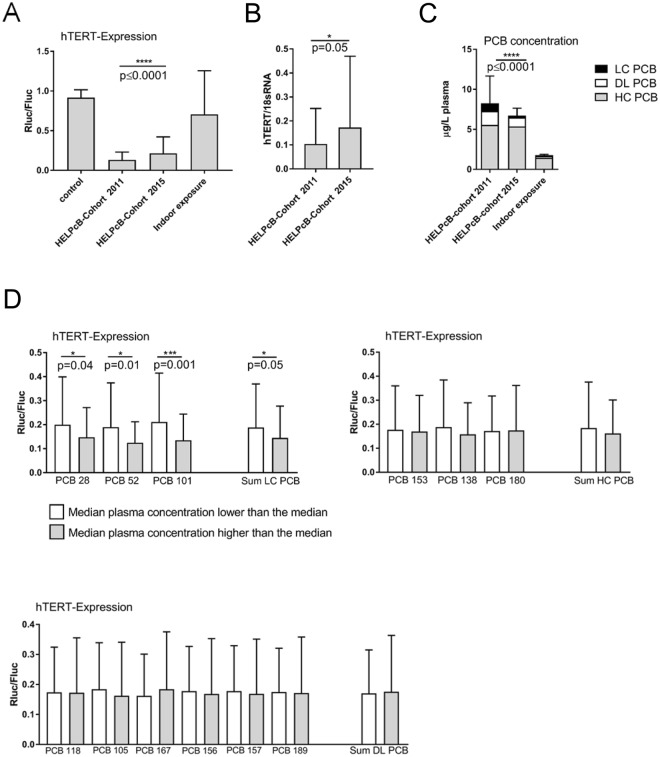
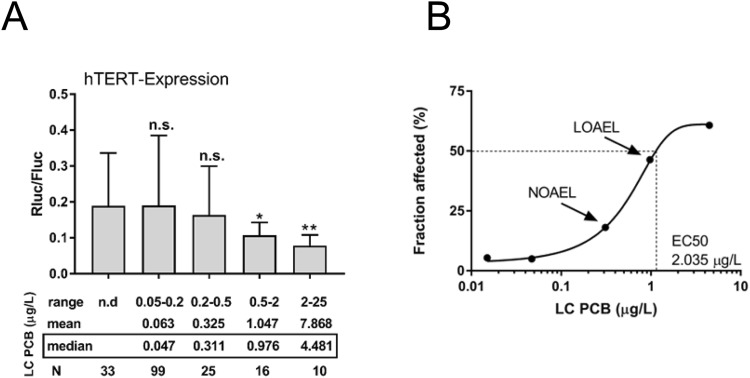
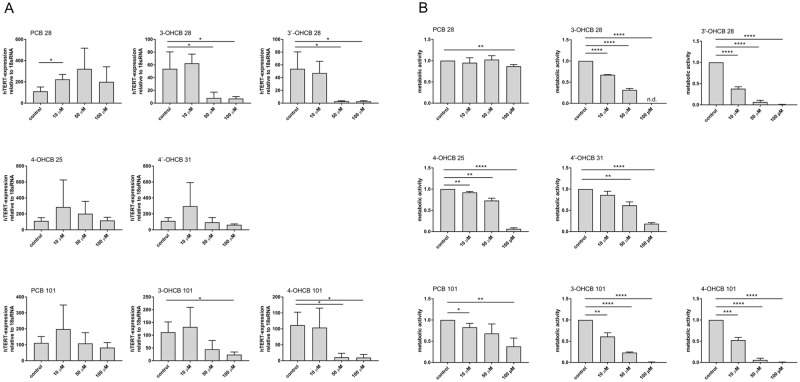
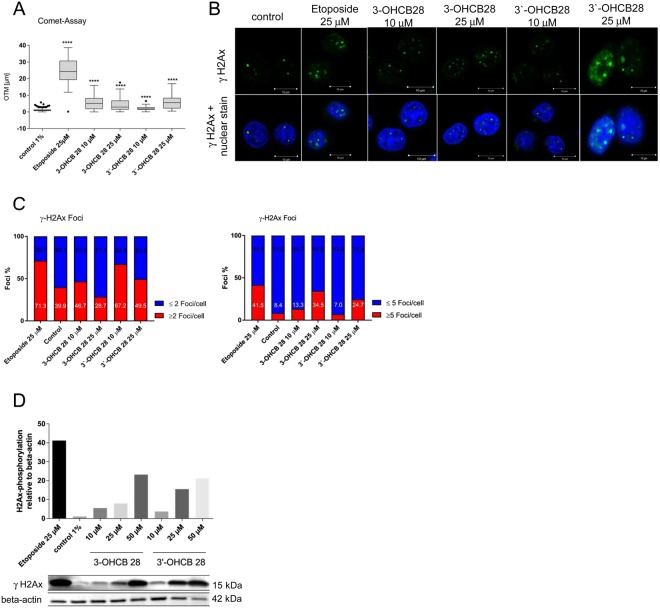
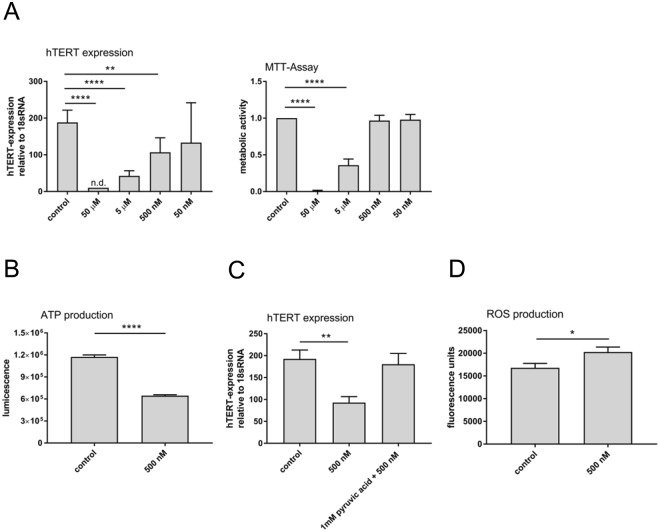
Polychlorinated biphenyls (PCBs) are ubiquitously occurring pollutants with different chemical and toxicological properties. In this study we evaluated blood plasma samples of two PCB-exposed cohorts for their ability to alter telomerase (hTERT) gene expression. Blood plasma from PCB-exposed individuals inhibited hTERT expression depending solely on the concentration of lower chlorinated PCBs, with the lowest observed adverse effect level (LOAEL) at a plasma concentration between 0.5 and 2 µg/L of LC PCBs. Individual OH-metabolites derived from the WHO indicator congeners PCB 28 and PCB 101 mimicked these effects on hTERT expression in vitro with high toxicity, including DNA damage. However, by the combination of different OH-metabolites, the bio effective PCB concentration was reduced and the respective effects on hTERT expression could be increased. At a concentration which showed no toxic activity in MTT assay, hTERT inhibition reflected the interference of OH-PCBs with the mitochondrial respiratory chain, which could lead to the production of reactive oxygen species (ROS). As individual OH-metabolites already showed a much stronger inhibition of hTERT gene expression at a lower concentration than their parental compounds, the hTERT gene expression bioassay described in this study seems to indicate metabolic activation of LC PCBs rather than the mere effect of LC PCBs on their own. In summary, this study provides dose-response linkages between effects of lower chlorinated PCBs and their concentrations in human plasma.


Conflict of interest statement

The authors declare no competing interests.

Figures

Figure 1
Figure 1
Inhibition of hTERT gene expression by blood plasma of PCB exposed individuals. (A) Tert+ B6B5.1 cells were incubated with longitudinally collected plasma samples from the HELPcB-cohort (N = 92 per time point; each with three technical replicates) or with plasma samples from individuals exposed to PCB via indoor air (N = 105; each with three technical replicates). After 48 hours of incubation, luciferase activities were determined. Statistical analysis was performed by a Wilcoxon matched-pairs signed rank test. Statistically significant differences are indicated (*P = 0.05; ****P < 0.0001). (B) PBMCs from healthy donors (0 RhD negative) were stimulated with tetanus toxoid for five days, reseeded and incubated in the presence of antigen- and PCB-containing plasma samples from the HELPcB-cohort as described in A. After 48 hours of incubation, hTERT gene expression was assessed by qRT-PCR. Statistical analysis was performed by a Wilcoxon matched-pairs signed rank test. (C) Mean plasma levels for Σ higher chlorinated PCBs (grey), Σ dioxin-like PCBs (white) and Σ lower chlorinated PCBs (black) from longitudinally collected samples (HELPcB-cohort) and from individuals exposed to PCB via indoor air. Statistical analysis was performed by a Wilcoxon matched-pairs signed rank test. SD and statistically significant differences are given for Σ lower chlorinated PCBs (****P < 0.0001). (D) Mean ± SD ratio of hTERT expression (N = 184) for individual indicator PCBs depending on plasma concentration. HC PCBs, DL PCBs and LC PCBs were separated using the median value as cut off. Statistical analysis was performed by a Mann-Whitney test. Statistically significant differences are indicated.
Figure 2
Figure 2
Plasma level-response relationship of LC PCBs in tert + B6B5.1 cells. (A) Individual samples of the HELPcB-cohort were divided into five groups depending on plasma levels of LC PCBs. Mean Rluc/Fluc-ratio within each group was compared to the group with no detectable levels of LC PCBs. Statistical analysis was performed by a Mann-Whitney test. Statistically significant differences are indicated (*P = 0.05; **P = 0.003). (B) The plasma level-response logarithmic curve of LC PCBs in tert+ B6B5.1 cells.
Figure 3
Figure 3
hTERT inhibition and toxicity by activation of LC PCBs. (A) Jurkat T cells were treated with increasing concentrations of parent PCBs or OH-metabolites for 48 hrs. as indicated. hTERT mRNA expression was evaluated by RT-PCR with expression levels normalized against 18S rRNA. Mean ± SD of three different experiments each with a total of three replicates are shown. Statistical analysis was performed by an unpaired, two-tailed Student’s t-test. Statistically significant differences are indicated (*P < 0.05). (B) Jurkat T cells were incubated as described in (A). Mitochondrial and cellular viability were assessed by means of MTT-assay performed as described. Mean ± SD of three different experiments each with a total of three replicates are shown. Statistical analysis was performed by an unpaired, two-tailed Student’s t-test. Statistically significant differences are indicated (*P < 0.05; **P < 0.01; ***P < 0.0005; ****P < 0.0001).
Figure 4
Figure 4
DNA damage induced by activation of LC PCBs. (A) Jurkat T cells were incubated with increasing concentrations of 3-OHCB 28 and 3′-OHCB 28 and etoposide as positive control. After 48 hrs. of incubation a comet-assay was performed. Olive tail moments are represented in box plots. Differences of the medians in comparison to negative control were investigated using Kruskal-Wallis, followed by a Dunn’s post-hoc test for multiple comparisons (****P < 0.0001). (B) Representative immunofluorescence images of Jurkat T cells treated as described in A. H2Ax-phosphorylation (green, Alexa Fluor 488) was merged with the nuclear counterstain DAPI (blue). (C) Quantitative evaluation of confocal images from Jurkat T cells. At least 58 cells per sample were counted. Left, percentage of cells with <2 or >2 foci/cell. Right, percentage of cells with <5 or >5 foci/cell. (D) Western blot analysis of γH2Ax in Jurkat T cells treated with 3-OHCB 28 and 3′-OHCB 28 and etoposide for 48 hours. Fold differences of H2Ax-phosphorylation were determined by densitometric analysis.
Figure 5
Figure 5
Combination of OH-PCBs inhibits hTERT expression without reduction of metabolic activity. (A) Left, Jurkat T cells were incubated with serial dilutions of a OH-PCB mix, containing equal amounts of 3-OHCB 28 and 3′-OHCB 28, as well as 3-OHCB 101 and 4-OHCB 101, for 48 hours. The following concentrations of the OH-PCB mix were used: 50 µM (Σ OH-PCB = 61.54 mg/L), 5 µM (Σ OH-PCB = 6.154 mg/L), 500 nM (Σ OH-PCB = 615.4 μg/L) and 50 nM (Σ OH-PCB = 61.54 µg/L). hTERT gene expression (left) and mitochondrial and cellular viability (right) were measured and evaluated as described in Fig. 3. Mean ± SD of three different experiments each with a total of three replicates are shown. Statistical analysis was performed by an unpaired, two-tailed Student’s t-test. Statistically significant differences are indicated (**P < 0.01; ****P < 0.0001). (B) Jurkat T cells were preincubated for 4 hrs. with 500 nM OH-metabolites mix. ATP production was measured as luminescent signal after adding ATP detection reagent from ToxGloTM-assay. Mean ± SD of three replicates are shown. Statistical analysis was performed by an unpaired, two-tailed Student’s t-test. Statistically significant differences are indicated (****P < 0.0001). (C) hTERT gene expression in the presence and absence of pyruvic acid. Jurkat T cells were treated with 500 nM OH-metabolites mix for 48 hrs. Where indicated, 24 hrs. before treatment start, pyruvic acid was added to the culture medium. hTERT expression was evaluated by RT-PCR as described. Mean ± SD of three different experiments each with a total of three replicates are shown. Statistical analysis was performed by an unpaired, two-tailed Student’s t-test. Statistically significant differences are indicated (**P < 0.01). (D) Production of reactive oxygen species (ROS) in Jurkat T cells in the presence of OH-PCB mix. Jurkat T cells preincubated with 4,5-diaminofluorescein-2-diacetate (DAF-2DA) were treated with 500 nM OH-PCB mix (Σ OH-PCB = 615.4 µg/L) for 4 hours and ROS production was measured as fluorescence signal. Mean ± SD of three replicates are shown. Statistical analysis was performed by an unpaired, two-tailed Student’s t-test. Statistically significant differences are indicated (*P < 0.05).

References

    1. Safe SH. Polychlorinated biphenyls (PCBs): environmental impact, biochemical and toxic responses, and implications for risk assessment. Critical reviews in toxicology. 1994;24:87–149. doi: 10.3109/10408449409049308. - DOI - PubMed
    1. Lauby-Secretan B, et al. Carcinogenicity of polychlorinated biphenyls and polybrominated biphenyls. Lancet Oncol. 2013;14:287–288. doi: 10.1016/S1470-2045(13)70104-9. - DOI - PubMed
    1. Lauby-Secretan B, et al. Use of mechanistic data in the IARC evaluations of the carcinogenicity of polychlorinated biphenyls and related compounds. Environmental science and pollution research international. 2016;23:2220–2229. doi: 10.1007/s11356-015-4829-4. - DOI - PubMed
    1. Lu Z, Kania-Korwel I, Lehmler HJ, Wong CS. Stereoselective formation of mono- and dihydroxylated polychlorinated biphenyls by rat cytochrome P450 2B1. Environmental science & technology. 2013;47:12184–12192. doi: 10.1021/es402838f. - DOI - PMC - PubMed
    1. Warner NA, Martin JW, Wong CS. Chiral polychlorinated biphenyls are biotransformed enantioselectively by mammalian cytochrome P-450 isozymes to form hydroxylated metabolites. Environmental science & technology. 2009;43:114–121. doi: 10.1021/es802237u. - DOI - PubMed

Publication types