. 2019 May;122(5):660-671.
doi: 10.1038/s41437-018-0162-2. Epub 2018 Nov 15.

An assessment of true and false positive detection rates of stepwise epistatic model selection as a function of sample size and number of markers

Affiliations

An assessment of true and false positive detection rates of stepwise epistatic model selection as a function of sample size and number of markers

Angela H Chen et al. Heredity (Edinb). 2019 May.

Abstract

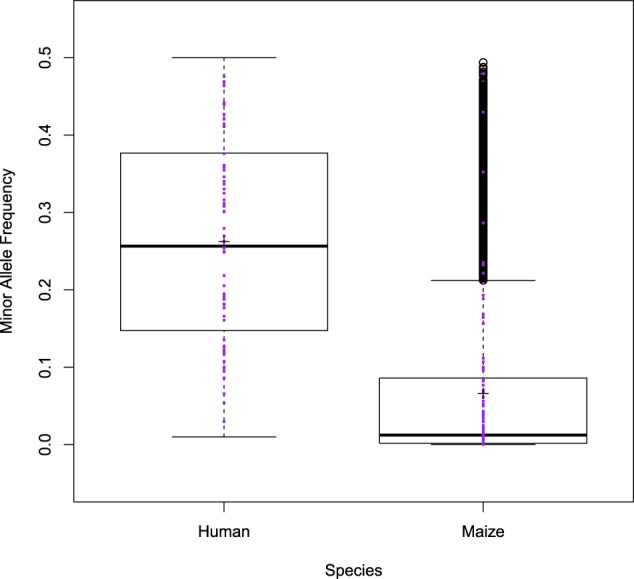
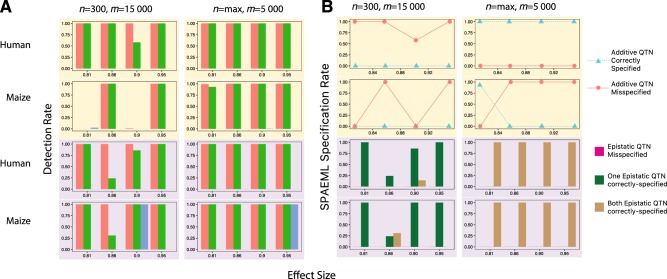
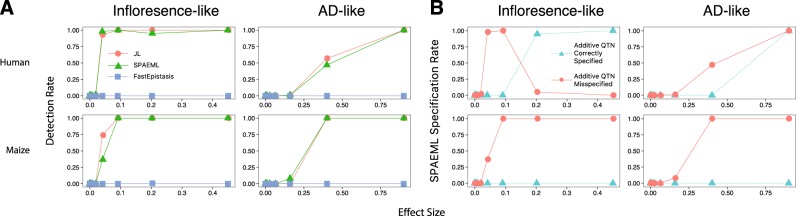
Association studies have been successful at identifying genomic regions associated with important traits, but routinely employ models that only consider the additive contribution of an individual marker. Because quantitative trait variability typically arises from multiple additive and non-additive sources, utilization of statistical approaches that include main and two-way interaction marker effects of several loci in one model could lead to unprecedented characterization of these sources. Here we examine the ability of one such approach, called the Stepwise Procedure for constructing an Additive and Epistatic Multi-Locus model (SPAEML), to detect additive and epistatic signals simulated using maize and human marker data. Our results revealed that SPAEML was capable of detecting quantitative trait nucleotides (QTNs) at sample sizes as low as n = 300 and consistently specifying signals as additive and epistatic for larger sizes. Sample size and minor allele frequency had a major influence on SPAEML's ability to distinguish between additive and epistatic signals, while the number of markers tested did not. We conclude that SPAEML is a useful approach for providing further elucidation of the additive and epistatic sources contributing to trait variability when applied to a small subset of genome-wide markers located within specific genomic regions identified using a priori analyses.


Conflict of interest statement

The authors declare that they have no conflict of interest.

Figures

Fig. 1
Fig. 1
Distribution of the minor allele frequencies (MAFs) of the evaluated single nucleotide polymorphisms (SNPs). Box plots depicting the MAFs (Y-axis) of the 15,000 SNPs that were tested in the human data set and the 15,000 SNPs that were tested in the maize data set (X-axis). The MAFs of all SNPs that were randomly selected to be quantitative trait nucleotides (QTNs) for the simulation studies are denoted by purple dots. These box plots illustrate that the MAFs of the SNPs in the maize data set tend to be lower than those in the human data set
Fig. 2
Fig. 2
Comparison of false positive rates for the three approaches evaluated in “Null” setting where no quantitative trait nucleotides (QTNs) were simulated. The rate of false positive detection, defined as a SNP located outside of ±250 kb of any of the QTNs, for joint linkage (JL) analysis, the stepwise procedure for constructing an additive and epistatic multi-locus model (SPAEML), and FastEpistasis are plotted on the Y-axis of each graph. Starting from the left, the first two graphs show the results for the traits simulated in the human data, while the last two columns show the results for the maize simulated data. The graphs with the title “5k” show the results when 5,000 markers were tested, and the graphs with the title “15k” show the results when 15,000 markers were tested. The X-axis of each graph show the sample sizes that were tested, with max indicating the maximum sample size of each data set (2648 in the maize data set and 2099 in the human data set)
Fig. 3
Fig. 3
Detection (a) and specification (b) rates of simulated quantitative trait nucleotides (QTNs) for the three approaches evaluated in the “Ideal” genetic architecture with setting with four large-effect additive QTN and four large-effect epistatic QTN and heritability equal to 0.99 (a). The detection rates of the additive QTNs, defined as the proportion of SNPs located within ±250 kb of any of the simulated QTN detected using joint linkage (JL) analysis (red bar), the stepwise procedure for constructing an additive and epistatic multi-locus model (SPAEML; green bar), and FastEpistasis (blue bar) are plotted on the Y-axis of each graph. The first two rows (shaded pale yellow) show results for the simulated additive QTN, while the bottom two rows (shaded pale purple) show results for the simulated epistatic QTN. The first and third rows show results for the simulations conducted in the human data set, while the second and fourth rows show results for the simulations conducted in the maize data set. The X-axis on each graph depict the effect sizes of the QTN. The left column shows results for n = 300 individuals and m = 15,000 markers, while the right column shows results for n = max individuals (i.e., n = 2099 in humans and n = 2648 in maize) and m = 5000 markers. Both JL and SPAEML are able to detect the additive and epistatic effects, while FastEpistasis failed to detect all the additive effects and most of the epistatic effects. b Specification rates of SPAEML, defined as the proportion of times that a detected additive QTN was correctly specified in the SPAEML model as additive, misspecified as epistatic (first two rows); or the proportion of times for a detected epistatic QTN that it was misspecified as additive, only one locus contributing to the QTN was detected, or both loci contributing to the QTN (bottom two rows). These proportions are depicted on the Y-axis of each graph. The X-axes of each graph, and how they are subdivided into rows and columns, are the same as in a. Optimal specification is obtained at n = max; m = 5000-marker setting and in the human data
Fig. 4
Fig. 4
Detection (a) and specification (b) rates of simulated additive quantitative trait nucleotides (QTNs) for the three approaches evaluated in the two complex genetic architectures at a maximum number of individuals (n = 2099 human subjects and n = 2648 maize lines) and 15,000 markers (a) The detection rates of the additive QTNs, defined as the proportion of SNPs located within ±250 kb of any of the simulated QTNs detected using joint linkage (JL) analysis, the stepwise procedure for constructing an additive and epistatic multi-locus model (SPAEML), and FastEpistasis are plotted on the Y-axis of each graph. The first row shows results for the simulations conducted in the human data set, while the second row shows results for the simulations conducted in the maize data set. The X-axis on each graph depict the effect sizes of the additive QTN. The left column shows results for the inflorescence-like genetic architecture, while the right column shows results for the AD-like genetic architecture. Similar detection rates were observed across JL analysis and SPAEML, while FastEpistasis failed to detect all the additive effects. b Specification rates of SPAEML, defined as the proportion of times that a detected additive QTN was correctly specified in the SPAEML model as additive or misspecified as epistatic, are depicted on the Y-axis of each graph. The X-axes of each graph, and how they are subdivided into rows and columns, are the same as in a. Correct specification of additive QTN occurs in the traits simulated using human data. “Inflorescence-like” = setting with 26 additive QTN, one epistatic QTN and heritability equal to 0.92; “AD-like” = setting with 20 additive QTN, one epistatic QTN and heritability = 0.34

Similar articles

Cited by

References

    1. Arkin Y, Rahmani E, Kleber ME, Laaksonen R, Marz W, Halperin E. EPIQ-efficient detection of SNP-SNP epistatic interactions for quantitative traits. Bioinformatics. 2014;30(12):i19–i25. doi: 10.1093/bioinformatics/btu261. - DOI - PMC - PubMed
    1. Azmach G, Menkir A, Spillane C, Gedil M. Genetic loci controlling carotenoid biosynthesis in diverse tropical maize lines. G3. 2018;8(3):1049–1065. doi: 10.1534/g3.117.300511. - DOI - PMC - PubMed
    1. Belcher AR, Cuesta-Marcos A, Smith KP, Mundt CC, Chen XM, Hayes PM. TCAP FAC-WIN6 elite barley GWAS panel QTL. I. barley stripe rust resistance QTL in facultative and winter six-rowed malt barley breeding programs identified via GWAS. Crop Sci. 2018;58(1):103–119. doi: 10.2135/cropsci2017.03.0206. - DOI
    1. Billings LK, Florez JC. The genetics of type 2 diabetes: what have we learned from GWAS? Ann NY Acad Sci. 2010;1212(1):59–77. doi: 10.1111/j.1749-6632.2010.05838.x. - DOI - PMC - PubMed
    1. Bogdan M, Ghosh JK, Doerge RW. Modifying the Schwarz Bayesian information criterion to locate multiple interacting quantitative trait loci. Genetics. 2004;167(2):989–999. doi: 10.1534/genetics.103.021683. - DOI - PMC - PubMed

Publication types

Substances