. 2018 Sep 7;15(13):1449-1457.
doi: 10.7150/ijms.27350. eCollection 2018.

Plasmodium falciparum Treated with Artemisinin-based Combined Therapy Exhibits Enhanced Mutation, Heightened Cortisol and TNF-α Induction

Affiliations

Plasmodium falciparum Treated with Artemisinin-based Combined Therapy Exhibits Enhanced Mutation, Heightened Cortisol and TNF-α Induction

Abel Olusola Idowu et al. Int J Med Sci. .

Abstract

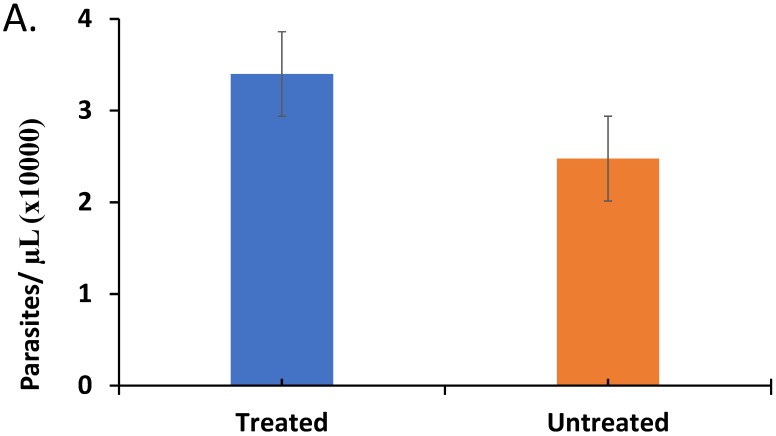
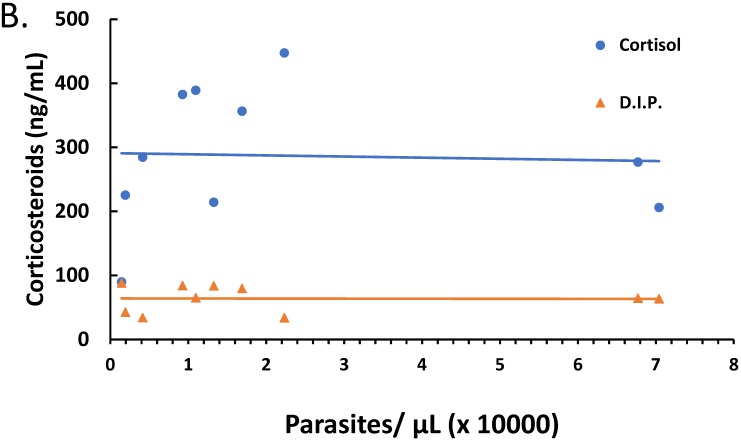
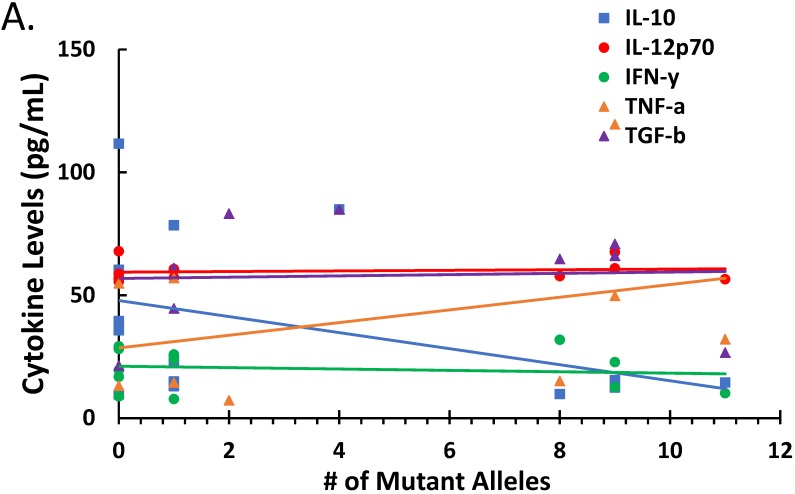
The artemisinin-based combined therapy (ACT) post-treatment illness in Plasmodium falciparum-endemic areas is characterized by vague malaria-like symptoms. The roles of treatment modality, persistence of parasites and host proinflammatory response in disease course are unknown. We investigated the hypothesis that ACT post-treatment syndrome is driven by parasite genetic polymorphisms and proinflammatory response to persisting mutant parasites. Patients were categorized as treated, untreated and malaria-negative. Malaria positive samples were analyzed for Pfcrt, Pfmdr1, K13 kelch gene polymorphisms, while all samples were evaluated for cytokines (TNF-α, IL-12p70, IL-10, TGF-β, IFN-γ) and corticosteroids (cortisol and dexamethasone) levels. The treated patients exhibited higher levels of parasitemia, TNF-α, and cortisol, increased incidence of parasite genetic mutations, and greater number of mutant alleles per patient. In addition, corticosteroid levels declined with increasing number of mutant alleles. TGF-β levels were negatively correlated with parasitemia, while IL-10 and TGF-β were negatively correlated with increasing number of mutant alleles. However, IL-12 displayed slight positive correlation and TNF-α exhibited moderate positive correlation with increasing number of mutant alleles. Since post-treatment management ultimately results in patient recovery, the high parasite gene polymorphism may act in concert with induced cortisol and TNF-α to account for ACT post-treatment syndrome.

Keywords: ACT.; Proinflammation; corticosteroids; cortisol; dexamethasone; gene polymorphism; persistent malaria.


Conflict of interest statement

Competing Interests: The authors have declared that no competing interest exists.

Figures

Figure 1
Figure 1
The effect of treatment on parasite load and frequency of antimalarial drug resistant gene polymorphisms in the malaria-positive sample population is represented. Average parasite load, as determined by microscopy and qPCR, is depicted in (A) between patients that were treated (n=12, treated previously with ACT) and untreated (n=14, never treated for this episode of malaria) (p ≤ 0.581). The percentage of treated and untreated patients that exhibited at least one mutant allele in the K13, Pfcrt (CRT), or Pfmdr1 (MDR) genes is depicted in (B). The average number of mutant alleles in the above genes detected per patient in mutation-positive treated and untreated patient samples is depicted in (C) (p ≤ 0.342). The prevalence of each of the observed mutant alleles across all malaria-positive patients is depicted in (D).
Figure 1
Figure 1
The effect of treatment on parasite load and frequency of antimalarial drug resistant gene polymorphisms in the malaria-positive sample population is represented. Average parasite load, as determined by microscopy and qPCR, is depicted in (A) between patients that were treated (n=12, treated previously with ACT) and untreated (n=14, never treated for this episode of malaria) (p ≤ 0.581). The percentage of treated and untreated patients that exhibited at least one mutant allele in the K13, Pfcrt (CRT), or Pfmdr1 (MDR) genes is depicted in (B). The average number of mutant alleles in the above genes detected per patient in mutation-positive treated and untreated patient samples is depicted in (C) (p ≤ 0.342). The prevalence of each of the observed mutant alleles across all malaria-positive patients is depicted in (D).
Figure 2
Figure 2
The relationship between parasitemia and cytokines and corticosteroid elaboration in the malaria-positive sample population is depicted. Parasitemia was determined by microscopy and qPCR. Levels of IL-10, IL-12, IFN-γ, TNF-α, TGF-β were determined by ELISA and expressed as pg/mL (true TGF-β values are in pg/mL x 10). The correlation between parasitemia and cytokines is represented in (A) with a significant correlation noted for TGF-β (ρ ≤ -0.923). Levels of cortisol and dexamethasone-induced protein (D.I.P.) were determined by ELISA and expressed as ng/mL. The correlation between parasitemia and cortisol and D.I.P. is represented in (B). Correlation coefficients: cortisol (ρ ≤ -0.042) and D.I.P. (ρ ≤ -0.014).
Figure 2
Figure 2
The relationship between parasitemia and cytokines and corticosteroid elaboration in the malaria-positive sample population is depicted. Parasitemia was determined by microscopy and qPCR. Levels of IL-10, IL-12, IFN-γ, TNF-α, TGF-β were determined by ELISA and expressed as pg/mL (true TGF-β values are in pg/mL x 10). The correlation between parasitemia and cytokines is represented in (A) with a significant correlation noted for TGF-β (ρ ≤ -0.923). Levels of cortisol and dexamethasone-induced protein (D.I.P.) were determined by ELISA and expressed as ng/mL. The correlation between parasitemia and cortisol and D.I.P. is represented in (B). Correlation coefficients: cortisol (ρ ≤ -0.042) and D.I.P. (ρ ≤ -0.014).
Figure 3
Figure 3
The effect of mutations in the malaria-positive patient samples on levels of cytokines and corticosteroids is represented. Total levels of IL-10, IL-12p70, IFN-γ, TNF-α and TGF-β cytokines detected by ELISA and expressed in pg/mL (true TGF-β values are in pg/mL x 10). The correlation between the number of mutant alleles and cytokine levels is depicted in Figure 3A. Significant correlation coefficients include IL-10 (ρ ≤ -0.404) and TNF-α (ρ ≤ 0.332). The correlation between cortisol and dexamethasone-induced protein (D.I.P.) levels detected by ELISA and expressed in ng/mL in patients with mutant versus wildtype P. falciparum is depicted in Figure 3C. Correlation coefficients: cortisol (ρ ≤ -0.2849) and D.I.P. (ρ ≤ -0.2485).
Figure 3
Figure 3
The effect of mutations in the malaria-positive patient samples on levels of cytokines and corticosteroids is represented. Total levels of IL-10, IL-12p70, IFN-γ, TNF-α and TGF-β cytokines detected by ELISA and expressed in pg/mL (true TGF-β values are in pg/mL x 10). The correlation between the number of mutant alleles and cytokine levels is depicted in Figure 3A. Significant correlation coefficients include IL-10 (ρ ≤ -0.404) and TNF-α (ρ ≤ 0.332). The correlation between cortisol and dexamethasone-induced protein (D.I.P.) levels detected by ELISA and expressed in ng/mL in patients with mutant versus wildtype P. falciparum is depicted in Figure 3C. Correlation coefficients: cortisol (ρ ≤ -0.2849) and D.I.P. (ρ ≤ -0.2485).
Figure 4
Figure 4
Comparisons of cytokine and corticosteroid levels across three categories, treated (malaria-positive and previously treated with ACT but returned with complaints of persistent unwellness), untreated (malaria-positive and visiting the health facility for the first time with a new infection) and control (malaria-negative samples) is represented. Total levels of IL-10, IL-12p70, IFN-γ, TNF-α and TGF-β cytokines detected by ELISA and expressed in pg/mL (true values of TGF-β in pg/ml x 10) in treated, untreated, and control patients is depicted in Figure 4A. ANOVA was performed to compare the three categories: IL-10 (p ≤ 0.199), IL-12 (p ≤ 0.758), IFN-γ (p ≤ 0.001), TNF-α (p ≤ 0.0910), and TGF-β (p ≤ 0.287). Total cortisol and dexamethasone-induced protein levels detected by ELISA and expressed in ng/mL in treated, untreated, and control patient samples is depicted in Figure 4B. ANOVA was performed to compare the three categories: cortisol (p ≤ 0.400) and D.I.P. (p ≤ 0.0102).
Figure 4
Figure 4
Comparisons of cytokine and corticosteroid levels across three categories, treated (malaria-positive and previously treated with ACT but returned with complaints of persistent unwellness), untreated (malaria-positive and visiting the health facility for the first time with a new infection) and control (malaria-negative samples) is represented. Total levels of IL-10, IL-12p70, IFN-γ, TNF-α and TGF-β cytokines detected by ELISA and expressed in pg/mL (true values of TGF-β in pg/ml x 10) in treated, untreated, and control patients is depicted in Figure 4A. ANOVA was performed to compare the three categories: IL-10 (p ≤ 0.199), IL-12 (p ≤ 0.758), IFN-γ (p ≤ 0.001), TNF-α (p ≤ 0.0910), and TGF-β (p ≤ 0.287). Total cortisol and dexamethasone-induced protein levels detected by ELISA and expressed in ng/mL in treated, untreated, and control patient samples is depicted in Figure 4B. ANOVA was performed to compare the three categories: cortisol (p ≤ 0.400) and D.I.P. (p ≤ 0.0102).

References

    1. Berkley JA, Maitland K, Mwangi I. et al. Use of clinical syndromes to target antibiotic prescribing in seriously ill children in malaria endemic area: observational study. Brit Med J. 2005;330:995–1001. - PMC - PubMed
    1. Jakka S, Veena S, Atmakuri R, Eisenhut M. Characteristic abnormalities in cerebrospinal fluid biochemistry in children with cerebral malaria compared to viral encephalitis. Cerebrospin Flu Res. 2006;3:1–7. - PMC - PubMed
    1. Rogier C, Trape J, Commenges D. Evidence for an Age-Dependent Pyrogenic Threshold of Plasmodium falciparum Parasitemia in Highly Endemic Populations. Am J Trop Med Hyg. 1996;54:613–9. - PubMed
    1. Boström S, Giusti P, Arama C. et al. Changes in the levels of cytokines, chemokines and malaria-specific antibodies in response to Plasmodium falciparum infection in children living in sympatry in Mali. Malar J. 2012;11:109–15. - PMC - PubMed
    1. Gonçalves RM, Scopel KG, Bastos MS, Ferreira MU. Cytokine Balance in Human Malaria: Does Plasmodium vivax Elicit More Inflammatory Responses than Plasmodium falciparum? PLoS ONE. 2012;7:1–10. - PMC - PubMed

MeSH terms