. 2018 Oct 3;14(13):1769-1781.
doi: 10.7150/ijbs.29242. eCollection 2018.

Inhibition of AKT suppresses the initiation and progression of BRCA1-associated mammary tumors

Affiliations

Inhibition of AKT suppresses the initiation and progression of BRCA1-associated mammary tumors

Hye Jung Baek et al. Int J Biol Sci. .

Abstract

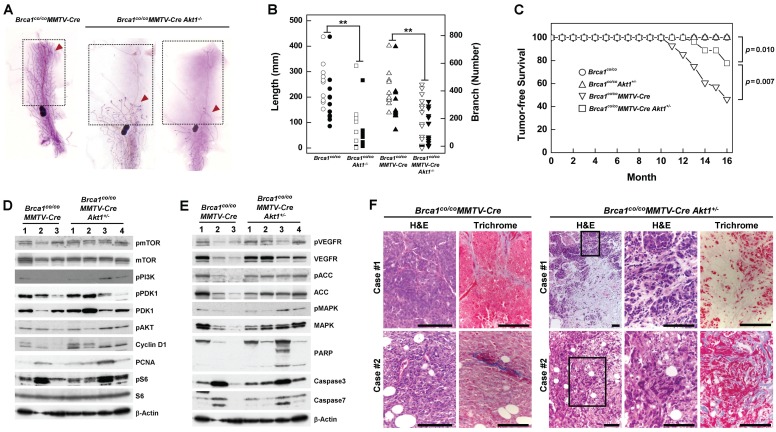
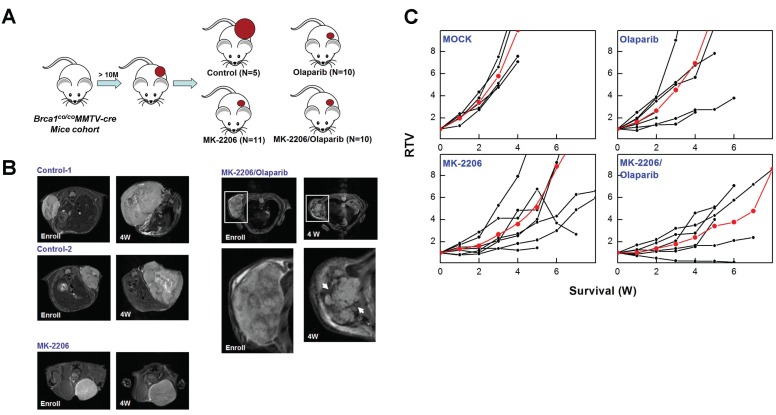
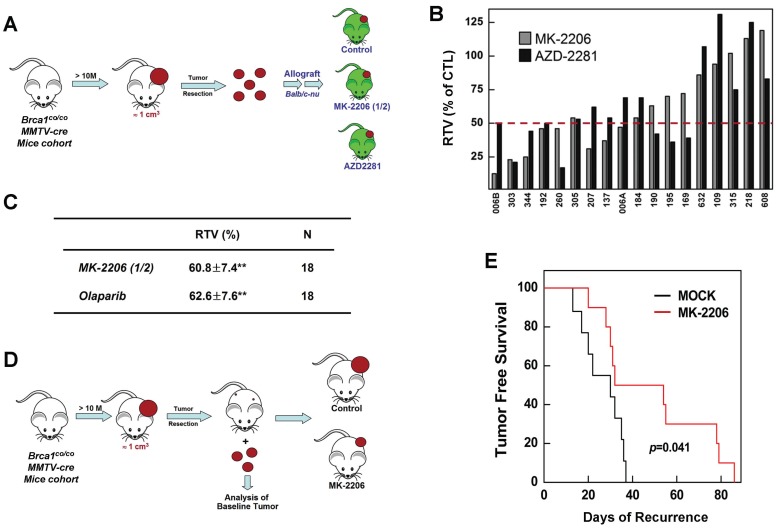
Despite the high incidence of BRCA1-mutant breast cancer, few substantial improvements in preventing or treating such cancers have been made. Using a Brca1-mutant mouse model, we examined the contribution of AKT to the incidence and growth of Brca1-mutated mammary tumors. A haploinsufficiency of Akt1 in Brca1-mutant mouse model significantly decreased mammary tumor formation from 54% in Brca1co/coMMTV-Cre mice to 22% in Brca1 co/coMMTV-Cre Akt1+/- mice. Notably, treatment of tumor-bearing Brca1-mutant mice with the AKT-inhibitor, MK-2206, yielded partial response or stable disease up to 91% of mice in maximum response. MK-2206 treatment also significantly reduced tumor volume and delayed recurrence in allograft and adjuvant studies, respectively. A correlation analysis of MK-2206 responses with gene expression profiles of tumors at baseline identified seven genes that were differentially expressed between tumors that did and did not respond to MK-2206 treatment. Our findings enhance our understanding of the involvement of AKT signaling in BRCA1-deficient mammary tumors and provide preclinical evidence that targeted AKT inhibition is a potential strategy for the prevention and therapeutic management of BRCA1-associated breast cancer.

Keywords: AKT; BRCA1; MK-2206; precision medicine.


Conflict of interest statement

Competing Interests: The authors have declared that no competing interest exists.

Figures

Figure 1
Figure 1
AKT is activated by estrogen treatment and BRCA1 downregulation, and its inhibition rescues the abnormalities associated with the loss of BRCA1. (A) MCF7 cells were transfected with control or BRCA1 siRNA, and then treated with E2 (100 nM) or irradiation (10 Gy). Protein expression patterns were analyzed by Western blotting, using β-actin as a control for equal loading. (B) Inhibition of AKT prevented E2-induced G1/S transition. MCF7 cells transfected with siRNA against BRCA1 were treated with E2 in the absence or presence of AKT inhibition (infection with AKT1-shRNA lentivirus or treatment with AKT inhibitor IV) and analyzed by flow cytometry with propidium iodide staining. (C) Percentage of cell distributions in different phases of the cell cycle. Results from three independent experiments are shown (**P < 0.01, *P < 0.05). (D) MCF7 cells transfected with scrambled or BRCA1 siRNA were treated with E2 or AKT inhibitor IV, after which protein expression patterns were analyzed by Western blotting. (E) E2-induced survival was measured in MCF7 cells transfected with scrambled or BRCA1 siRNA, treated with or without AKT inhibitor IV. Each number represents survival relative to that in the absence of E2 (**P < 0.01). (F) Phospho-histone H3 staining of cerebellar and liver tissues from WT, Brca1Δ11/Δ11, and Brca1Δ11/Δ11Akt1+/- embryos at 14.5 days post coitus (dpc). Proportions of phospho-histone H3-positive nuclei are indicated. Scale bars: 100 μm. (G) Hyperplastic mammary glands (upper panel) and tumor tissues (lower panel) from Brca1co/coMMTV-Cre mice were subjected to immunohistochemical staining with anti-phospho-AKT antibody. Scale bars: 50 μm. (H) Immortalized Brca1Δ11/Δ11 and Brca1+/+ MEFs were analyzed by Western blotting.
Figure 2
Figure 2
Downregulation of AKT suppresses mammary gland development and mammary tumor formation caused by the loss of BRCA1. (A) Whole-mount staining of mammary glands from 2-month-old Brca1co/coMMTV-Cre and Brca1co/coMMTV-Cre Akt1-/- mice. Arrows indicate where sprouting ducts are appeared in the mammary glands. (B) Branch software was used to estimate the total length (open) and branch numbers (filled) of ducts between the lymph node and end tip in mammary glands of 2-month-old mice with the indicated genotypes. The density of mammary gland ducts was significantly lower in mice with Akt1-mutant (**P < 0.01). (C) Kaplan-Meier curves of tumor-free survival. WT (N = 30) and Brca1co/coAkt1+/- (N = 30) mice were normal and did not develop tumors. By contrast, 54% (15 of 28) of Brca1co/coMMTV-Cre (N = 28) mice spontaneously developed mammary tumors by 16 months of age, whereas 22% (6 of 27) of Brca1co/coMMTV-Cre Akt1+/- mice developed mammary tumors by the same age. Log-rank tests revealed a significant difference (P = 0.007) in the tumor-free survival of Brca1co/coMMTV-Cre mice compared with Brca1co/coMMTV-Cre Akt1+/- mice. (D and E) Protein expression patterns in tumors from Brca1co/coMMTV-Cre and Brca1co/coMMTV-Cre Akt1+/- mice. (F) Histological analysis (H&E and trichrome staining) of two tumor cases from Brca1co/coMMTV-Cre and Brca1co/coMMTV-Cre Akt1+/- mice. The second set of two panels of H&E staining in tumors from Brca1co/coMMTV-Cre Akt1+/- mice represent magnifications of the boxed areas in adjacent images. Scale bars: 100 μm.
Figure 3
Figure 3
Inhibition of AKT decreases the survival of BRCA1-deficient tumor cells. The survival of (A) Brca1Δ11/Δ1153bp1-/- and (B) Brca1Δ11/Δ11Tp53-/- (closed) mammary tumor cell lines was estimated in the presence of rapamycin, LY294002, or AKT inhibitor IV. (C) Brca1Δ11/Δ1153bp1-/- and Brca1Δ11/Δ11Tp53-/- mammary tumor cells were exposed to irradiation or treated with the AKT inhibitor IV. Protein expression patterns were analyzed by Western blotting, using β-actin as a control for equal loading. (D) The survival of BRCA1-deficient MDA-MB436 tumor cells was estimated in the presence of rapamycin, LY294002, or AKT inhibitor IV. The IC50 values for rapamycin, LY294002, and AKT inhibitor IV were calculated to be 50 pM, 1.4 μM, and 1.25 μM, respectively.
Figure 4
Figure 4
Therapeutic effects of the AKT inhibitor MK-2206 on mammary tumors in Brca1co/coMMTV-Cre mice. (A) Brca1co/coMMTV-Cre female mice spontaneously developed mammary tumors beginning at 10 months of age. Upon tumor appearance, tumor-bearing mice were randomized into the following treatment groups: no treatment; the PARP inhibitor, olaparib (100 mg/kg, IP, 3 times/week); the AKT inhibitor, MK-2206 (240 mg/kg, oral, 3 times/week); or olaparib plus MK-2206. Tumor growth progression was monitored by weekly MRI scans. (B) Representative MRI scans of tumor-bearing mice at baseline (left) and after 4 weeks of the indicated treatments. The arrows indicate partial responses with necrosis in the tumors of mice co-treated with MK-2206 and olaparib. (C) Graphs show RTVs (ratios of tumor volumes) between post-treatment and baseline (at the start of treatment). Red lines represent the averages of cohorts.
Figure 5
Figure 5
Therapeutic effects of the AKT inhibitor MK-2206 on BRCA1-deficient tumor transplantation and adjuvant models. (A) Overview of the allograft model and drug treatments. Eighteen spontaneously developed mammary tumors were collected from Brca1co/coMMTV-Cre mice and transplanted into nude mice. Growth of the corresponding tumors in sham-treated mice versus mice treated with olaparib (100 mg/kg, IP, 3 times/week) or MK-2206 (120 mg/kg, oral, 3 times/week) was tested. When the tumor of any mouse implanted with the same original tumor reached ~3 cm3, all mice implanted with that tumor were sacrificed and examined. (B) Graph shows calculated RTVs (RTV of treated tumor/RTV of control tumor × 100) for tumors treated with olaparib and MK-2206. (C) Summary of the allograft experiment. The numbers represent means ± SE (**P < 0.01). (D) Overview of adjuvant therapy applied after surgery. Upon tumor appearance in Brca1co/coMMTV-Cre mutant mice, the tumors were surgically removed. One week post-surgery, mice were randomized into a control group (N = 10) or MK-2206 treatment group (N =10, 240 mg/kg, oral, 3 times/week). (E) Kaplan-Meier curves for recurrence-free survival. The overall recurrence-free periods were 29.3 days and 49.4 days in control and MK-2206-treated groups, respectively. Log-rank tests showed that tumor-free survival was significantly longer (P = 0.041) in the MK-2206 treatment group.
Figure 6
Figure 6
Analysis of MK-2206 response-associated biomarkers. (A) Protein expression patterns in tumors from the allograft model are shown. 'Responder' indicates that the tumor responded to MK-2206 with at least a 50% reduction in growth. C, controls (vehicle treatment); T, MK-2206 treatment. (B) Tumors from adjuvant therapy were analyzed by Western blotting. The numbers indicate the day of recurrence after surgery/MK-2206 treatment. (C) MK-2206 response-related genes were identified by screening for genes that were differentially expressed in baseline tumors of MK-2206-sensitive versus -insensitive tumors in allograft and adjuvant experiments. Red and blue numbers represent the numbers of genes that were expressed at higher and lower levels, respectively, in responders. (D) Heat map shows upregulation of seven selected genes in the MK-2206-responder group compared with the non-responder group in the allograft model (P < 0.05). Tumor samples are sorted with respect to their RTV to highlight the correlation with gene expression. These sensitive markers were also upregulated in the delayed-recurrence population in the adjuvant model (P < 0.05). All genes were validated by RT-qPCR (fold change > 1.5). (E) Summary of enriched gene ontology (GO) terms of the seven genes associated with tumor volumes (FDR < 0.05). (F) Integrated functional network analysis of the selected genes using the STRING protein interaction network and KEGG pathway.

References

    1. Deng CX. BRCA1: cell cycle checkpoint, genetic instability, DNA damage response and cancer evolution. Nucleic Acids Res. 2006;34:1416–26. - PMC - PubMed
    1. Caestecker KW, Van de Walle GR. The role of BRCA1 in DNA double-strand repair: past and present. Exp Cell Res. 2013;319:575–87. - PubMed
    1. Takaoka M, Miki Y. BRCA1 gene: function and deficiency. Int J Clin Oncol. 2018;23:36–44. - PubMed
    1. Miki Y, Swensen J, Shattuck-Eidens D, Futreal PA, Harshman K, Tavtigian S. et al. A strong candidate for the breast and ovarian cancer susceptibility gene BRCA1. Science. 1994;266:66–71. - PubMed
    1. Chen S, Parmigiani G. Meta-analysis of BRCA1 and BRCA2 penetrance. J Clin Oncol. 2007;25:1329–33. - PMC - PubMed

Publication types