. 2018 Nov 1:9:2543.
doi: 10.3389/fimmu.2018.02543. eCollection 2018.

Manipulation of Salmonella Typhi Gene Expression Impacts Innate Cell Responses in the Human Intestinal Mucosa

Affiliations

Manipulation of Salmonella Typhi Gene Expression Impacts Innate Cell Responses in the Human Intestinal Mucosa

Rosângela Salerno-Gonçalves et al. Front Immunol. .

Abstract

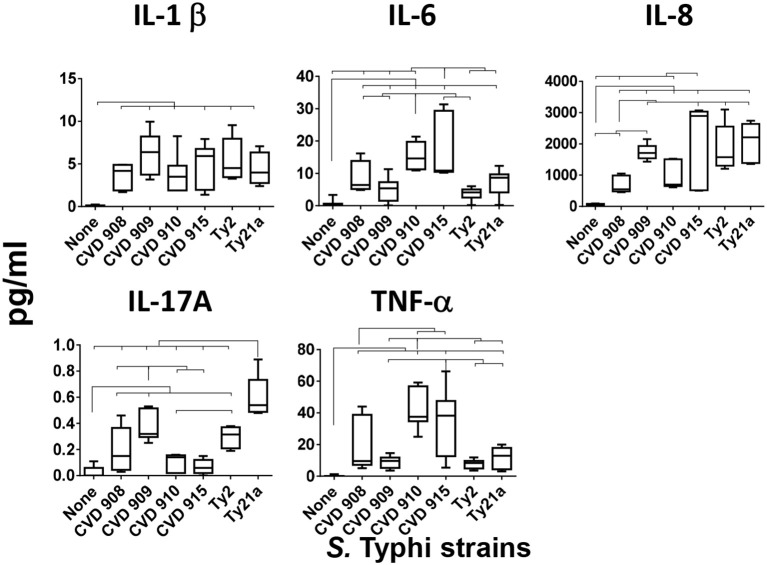
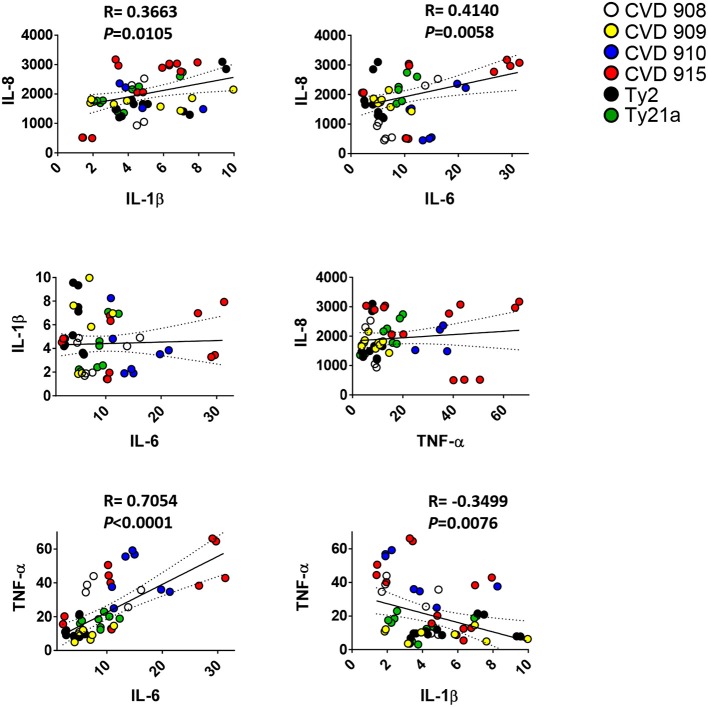
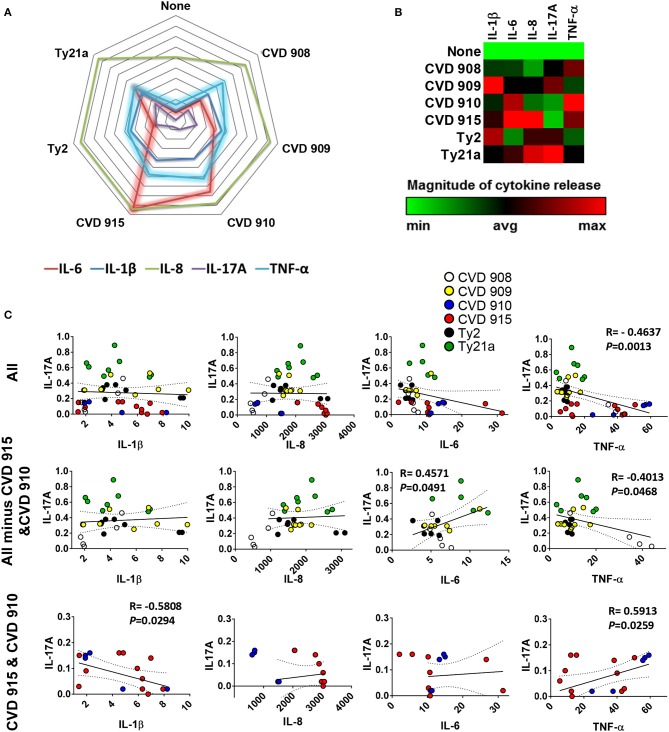
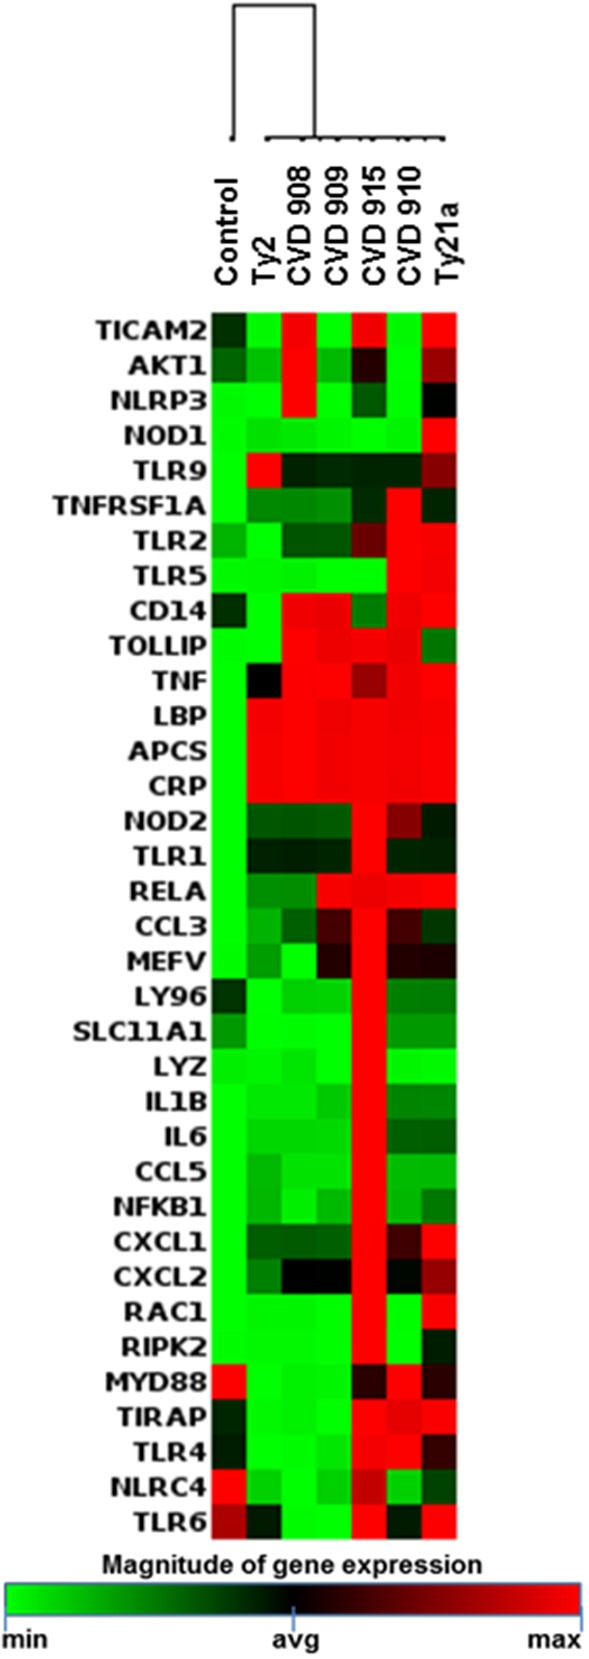
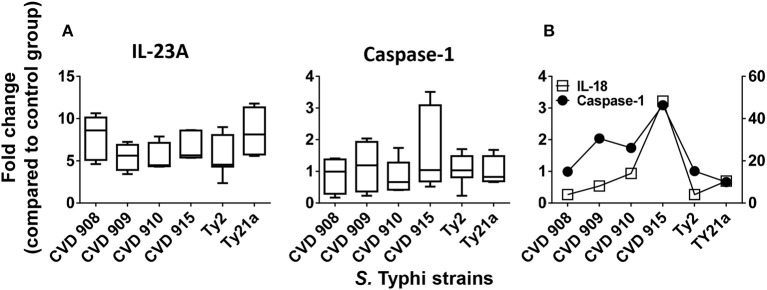
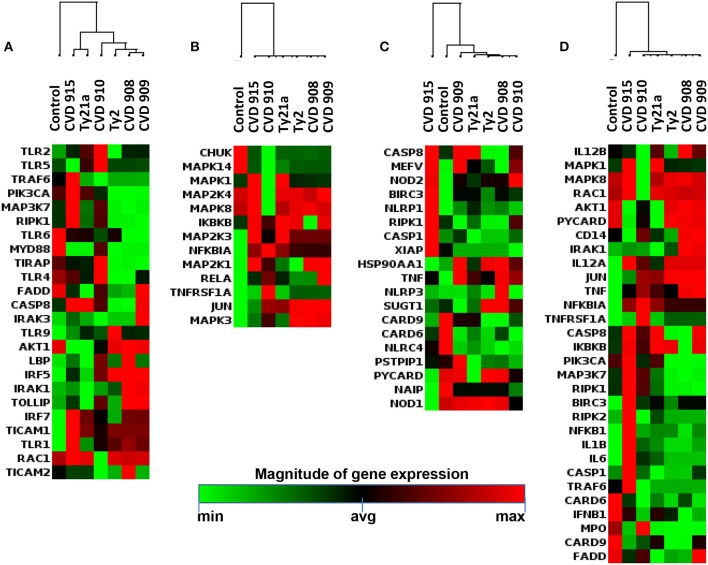
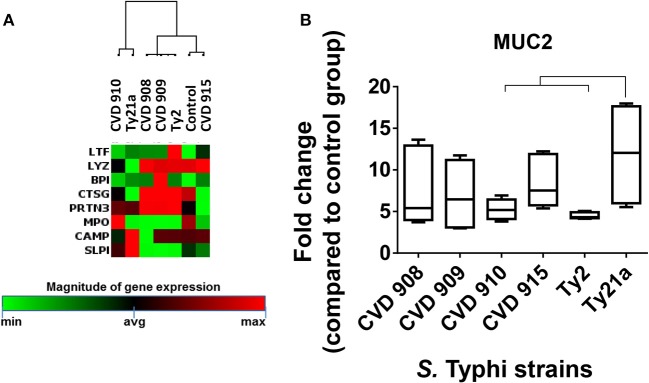
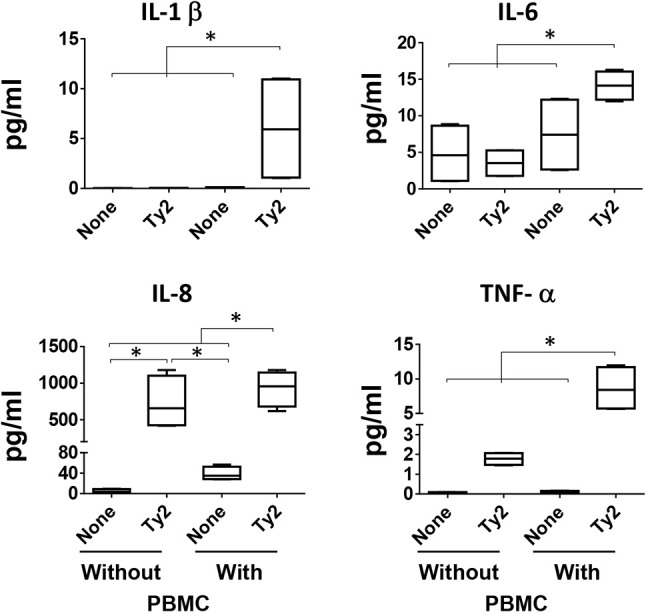
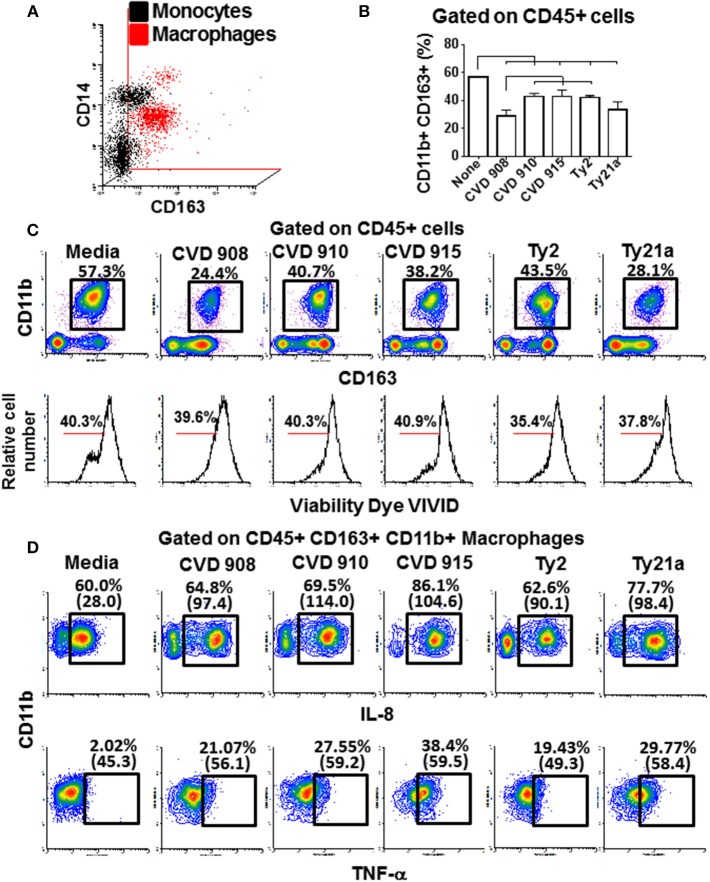
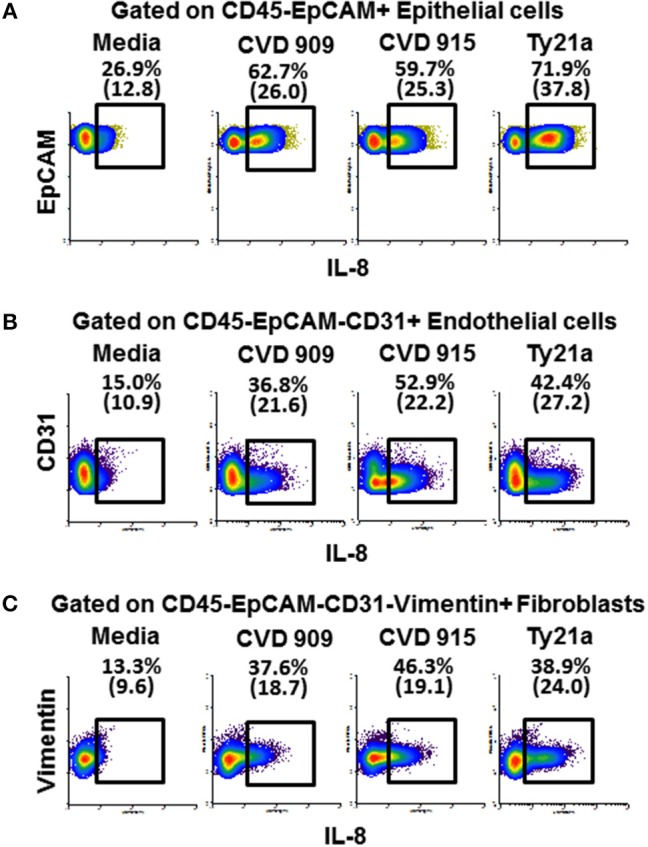
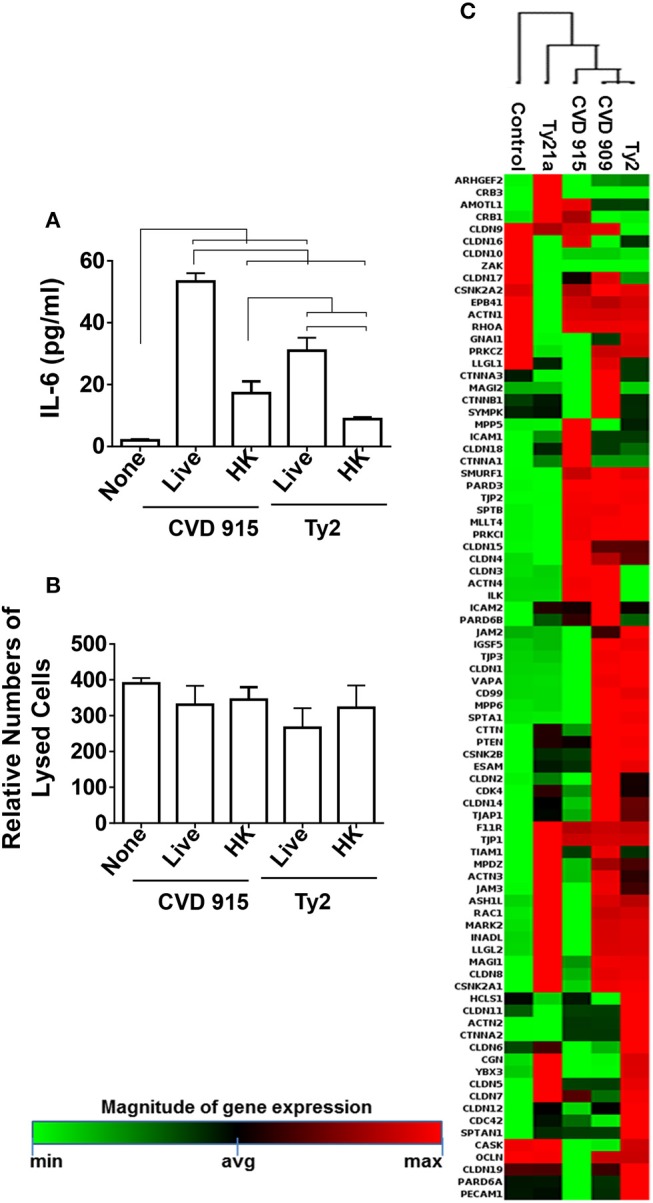
Although immunity induced by typhoid fever is moderated and short-lived, typhoid vaccination with the attenuated Ty21a oral vaccine generates long-lasting protection rates reaching up to 92%. Thus, there are important differences on how wild-type Salmonella and typhoid vaccine strains stimulate host immunity. We hypothesize that vaccine strains with different mutations might affect gut inflammation and intestinal permeability by different mechanisms. To test this hypothesis, we used an in vitro organotypic model of the human intestinal mucosa composed of human intestinal epithelial cells, lymphocytes/monocytes, endothelial cells, and fibroblasts. We also used six Salmonella enterica serovar Typhi (S. Typhi) strains: the licensed Ty21a oral vaccine, four typhoid vaccine candidates (i.e., CVD 908, CVD 909, CVD 910, and CVD 915) and the wild-type Ty2 strain. We found that genetically engineered S. Typhi vaccine strains elicit differential host changes not only in the intestinal permeability and secretion of inflammatory cytokines, but also in the phenotype and activation pathways of innate cells. These changes were distinct from those elicited by the parent wild-type S. Typhi and depended on the genetic manipulation. In sum, these results emphasize the importance of carefully selecting specific manipulations of the Salmonella genome in the development of typhoid vaccines.

Keywords: Salmonella; gut; human; innate immunity; mucosal immunity; typhoid vaccine.


Figures

Figure 1
Figure 1
Cytokine production after stimulation with different S. Typhi strains. Cells from the 3-D model were untreated (none) or exposed to CVD 908, CVD 909, CVD 910, CVD 915, Ty2, or Ty21a S. Typhi strains. After 4 h, levels of cytokines in the cultures supernatants were measured by using the commercial Meso Scale Discovery (MSD) multiplex-assay. Bar graphs extend from the 25 to 75th percentiles, and the line in the middle represents the median of the pooled data. The whiskers delineate the smallest to the largest value. The data represent up to 6 individual experiments for each of S. Typhi strains with one or two replicates. Horizontal lines represent significant differences (p < 0.05) between the indicated culture conditions.
Figure 2
Figure 2
Correlation among pro-inflammatory cytokine levels. Cells from the 3-D model were untreated (none) or exposed to CVD 908, CVD 909, CVD 910, CVD 915, Ty2, or Ty21a S. Typhi strains. After 4 h, the levels of IL-1-β, IL-6, IL-8, and TNF-α cytokines in the cultures supernatants were measured by the commercial Meso Scale Discovery (MSD) multiplex-assay. Correlations used the Pearson Product Moment tests. The data represent up to six individual experiments for each of S. Typhi strains with one or two replicates. P-values < 0.05 were considered significant.
Figure 3
Figure 3
Profile of cytokine response after stimulation with different S. Typhi strains. Cells from the 3-D model were untreated (none) or exposed to CVD 908, CVD 909, CVD 910, CVD 915, Ty2, or Ty21a S. Typhi strains. After 4 h, the levels of IL-1-β, IL-6, IL-8, IL-17A, and TNF-α cytokines in the cultures supernatants were measured by the commercial Meso Scale Discovery (MSD) multiplex-assay. (A) Spider plot and (B) heat map of the mean values of the cytokines. (C) Correlation between IL-17A and the other pro-inflammatory cytokine levels in the supernatants from 3-D mucosa organoids after stimulation with the different S. Typhi strains. Correlations used the Pearson Product Moment tests. The data represent up to six individual experiments for each of S. Typhi strains with one or two replicates. P-values < 0.05 were considered significant.
Figure 4
Figure 4
Inflammatory Responses after stimulation with different S. Typhi strains. Cells from the 3-D model were untreated (none) or exposed to CVD 908, CVD 909, CVD 910, CVD 915, Ty2, or Ty21a S. Typhi strains. After 4 h, tissues were collected and used to measure the gene expression by qRT-PCR. Data shown are unsupervised clustergram displaying hierarchical clustering of the genes related to the inflammatory response signaling as a heat map as a heat map. Geometric mean values of two independent experiments with two replicates. Results are shown as x-fold regulation relative to the control group. Genes detected by the Antimicrobial Responses RT2 Profiler PCR Array.
Figure 5
Figure 5
IL-23A and inflammasome-caspase-1 pathway after stimulation with different S. Typhi strains. Cells from the 3-D model were untreated (none) or exposed to CVD 908, CVD 909, CVD 910, CVD 915, Ty2, or Ty21a S. Typhi strains. After 4 h, tissues were collected and used to measure gene expression by qRT-PCR. (A) IL-23A and caspase-1 gene expression by qRT-PCR. Bar graphs extend from the 25 to 75th percentiles, and the line in the middle represents the median of the pooled data. The whiskers delineate the smallest to the largest value. The data represent up to six individual experiments for each of S. Typhi strains with one or two replicates. (B) A representative experiment showing the concomitant expression of IL-18 and Caspase-1.
Figure 6
Figure 6
Antimicrobial Responses after stimulation with different S. Typhi strains. Cells from the 3-D model were untreated (none) or exposed to CVD 908, CVD 909, CVD 910, CVD 915, Ty2, or Ty21a S. Typhi strains. After 4 h, tissues were collected and used to measure gene expression by qRT-PCR. Data shown are unsupervised clustergram displaying hierarchical clustering of the dataset as a heat map. Geometric mean values of two independent experiments with two replicates. Results are shown as x-fold regulation relative to the control group. Genes detected by the Antimicrobial Responses RT2 Profiler PCR Array: (A) Toll-Like Receptor (TLR) signaling. (B) Downstream signaling of antibacterial responses. (C) NOD-Like Receptor (NLR) signaling. (D) Apoptosis signaling.
Figure 7
Figure 7
Differential expression of mucus and antimicrobial peptide signaling after stimulation with different S. Typhi strains. Cells from the 3-D model were untreated (none) or exposed to CVD 908, CVD 909, CVD 910, CVD 915, Ty2, or Ty21a S. Typhi strains. After 4 h, tissues were collected and used to measure the gene expression by qRT-PCR. (A) Data shown are unsupervised clustergram displaying hierarchical clustering of the genes related to the antimicrobial signaling as a heat map. Geometric mean values of two independent experiments with two replicates. Results are shown as x-fold regulation relative to the control group. Genes detected by the Antibacterial Response RT2 Profiler PCR Array. (B) Mucus (MUC2) gene expression. Bar graphs extend from the 25 to 75th percentiles, and the line in the middle represents the median of the pooled data. The whiskers delineate the smallest to the largest value. The data represent six individual experiments with one or two replicates. Horizontal lines represent significant differences (p < 0.05) between the indicated culture conditions.
Figure 8
Figure 8
Impact of PBMC on cytokine production. During the building of the 3-D model, immune cells (i.e., PBMC) were added, or not, to the culture using a “minus/plus” one-factor approach. Once the 3-D models reached the maturity (~17 days after initiation of the culture), the models were exposed or not to S. Typhi Ty2 strain. After 4 h, cell-free supernatants were collected and used to measure IL-1β, IL-6, IL-8, and TNF-α secretion by MSD. Bar graphs extend from the 25 to 75th percentiles, and the line in the middle represents the median of the pooled data. The whiskers delineate the smallest to the largest value. Data are representative of two independent experiments with two replicates. *p < 0.05, Horizontal lines represent significant differences between the indicated culture conditions.
Figure 9
Figure 9
Macrophage phenotype, migration and production of cytokine after stimulation with different S. Typhi strains. The 3-D model was left untreated (media) or exposed to CVD 908, CVD 910, CVD 915, Ty2, or Ty21a S. Typhi strains. After 4 h, tissues were collected and disaggregated and used to perform flow cytometry. (A) Upper panel, comparison between macrophages present in the 3-D model and monocytes present in the blood. Lower panel, macrophage vialitity detected using violet fluorescent dye ViViD. (B) Levels of resident macrophages in various culture conditions. Horizontal lines represent significant differences (p < 0.05) between the indicated culture conditions. (C) Representative experiment showing the levels of resident macrophages present in the 3-D tissues. (D) IL-8 and TNF-α intracellular staining. Numbers between in parentheses represent mean fluorescence intensity.
Figure 10
Figure 10
Expression of IL-8 by epithelial and stromal cells after stimulation with different S. Typhi strains. The 3-D model was left untreated (media) or exposed to CVD 909, CVD 915, or Ty21a S. Typhi strains. After 4 h, tissues were collected and disaggregated and used to perform IL-8 intracellular staining and flow cytometric analysis. Cells were gated based on their scatter characteristics and specific lineage differentiation markers: (A) CD45-EpCAM+ for epithelial cells, (B) CD45-EpCAM-CD31+ for endothelial cells, and (C) CD45-EpCAM-CD31-Vimentin+ for fibroblasts. Numbers in parentheses represent mean fluorescence intensity.
Figure 11
Figure 11
Effect of S. Typhi exposure on the epithelial cell barrier. Cells from the 3-D model were untreated (none) or exposed to live or heat-killed (HK) S. Typhi strain CVD 915 or Ty2. (A) After 4 h, levels of IL-6 in the cultures supernatants were measured by Meso Scale Discovery (MSD) assay. Bars represent mean ± SE. Horizontal lines represent significant differences (p < 0.05) between the indicated culture conditions. (B) The cell viability was also measured in supernatants by commercial LDH assay. Bars represent means ± SE of 1 experiment with three replicates. (C) Cells from the 3-D model were untreated (none) or exposed to CVD 909, CVD 915, Ty2, or Ty21a S. Typhi strains. After 4 h, tissues were collected and used to measure the gene expression by qRT-PCR. Data shown represents an unsupervised clustergram displaying hierarchical clustering of the dataset as a heat map. Geometric mean values of two independent experiments with two replicates. Results are shown as x-fold regulation relative to the control group. Genes expression was detected by using the Tight Junctions RT2 Profiler PCR Array.

References

    1. Marmion DE, Naylor GR, Stewart IO. Second attacks of typhoid fever. J Hyg. (1953) 51:260–7. 10.1017/S0022172400015680 - DOI - PMC - PubMed
    1. Dupont HL, Hornick RB, Snyder MJ, Dawkins AT, Heiner GG, Woodward TE. Studies of immunity in typhoid fever. Protection induced by killed oral antigens or by primary infection. Bull World Health Organ. (1971) 44:667–72. - PMC - PubMed
    1. Levine MM, Ferreccio C, Black RE, Germanier R. Large-scale field trial of Ty21a live oral typhoid vaccine in enteric-coated capsule formulation. Lancet (1987) 1:1049–52. 10.1016/S0140-6736(87)90480-6 - DOI - PubMed
    1. Sztein MB, Salerno-Goncalves R, Mcarthur MA. Complex adaptive immunity to enteric fevers in humans: lessons learned and the path forward. Front Immunol. (2014) 5:516. 10.3389/fimmu.2014.00516 - DOI - PMC - PubMed
    1. Levine MM. Typhoid fever vaccines. In: Plotkin SA, Orenstein WA, Offit PA, Edwards KM, editors. Plokin's Vaccines. Philadelphia, PA: Elsevier, Inc; (2018). 1114–44.

Publication types