

From statistical inference to a differential learning rule for stochastic neural networks
- PMID: 30443331
- PMCID: PMC6227809
- DOI: 10.1098/rsfs.2018.0033
From statistical inference to a differential learning rule for stochastic neural networks
Abstract
Stochastic neural networks are a prototypical computational device able to build a probabilistic representation of an ensemble of external stimuli. Building on the relationship between inference and learning, we derive a synaptic plasticity rule that relies only on delayed activity correlations, and that shows a number of remarkable features. Our delayed-correlations matching (DCM) rule satisfies some basic requirements for biological feasibility: finite and noisy afferent signals, Dale's principle and asymmetry of synaptic connections, locality of the weight update computations. Nevertheless, the DCM rule is capable of storing a large, extensive number of patterns as attractors in a stochastic recurrent neural network, under general scenarios without requiring any modification: it can deal with correlated patterns, a broad range of architectures (with or without hidden neuronal states), one-shot learning with the palimpsest property, all the while avoiding the proliferation of spurious attractors. When hidden units are present, our learning rule can be employed to construct Boltzmann machine-like generative models, exploiting the addition of hidden neurons in feature extraction and classification tasks.
Keywords: associative memory; attractor networks; learning.
Conflict of interest statement
We declare we have no competing interests.
Figures
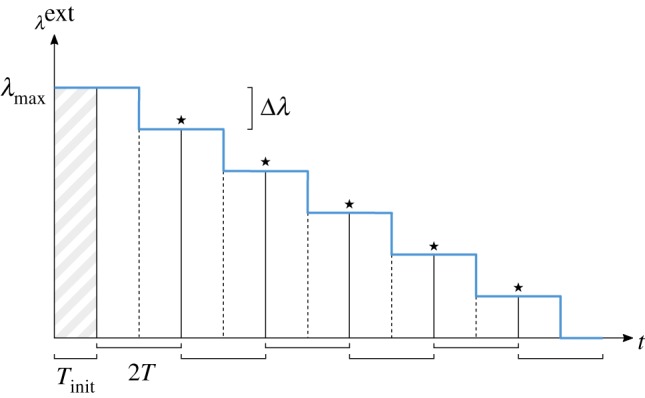
 as a function of the time t of the network dynamics. The first time period (
 time steps, shaded) serves for initializing the network state in the proximity of the pattern. The protocol then proceeds in windows of 2T steps, each one divided in two phases. In the middle of each window, the field intensity drops by
  . The time-delayed correlations are recorded separately for the two phases. The parameters are updated at the end of each window, in correspondence of the
  symbols, according to equation (2.6). (Online version in colour.)
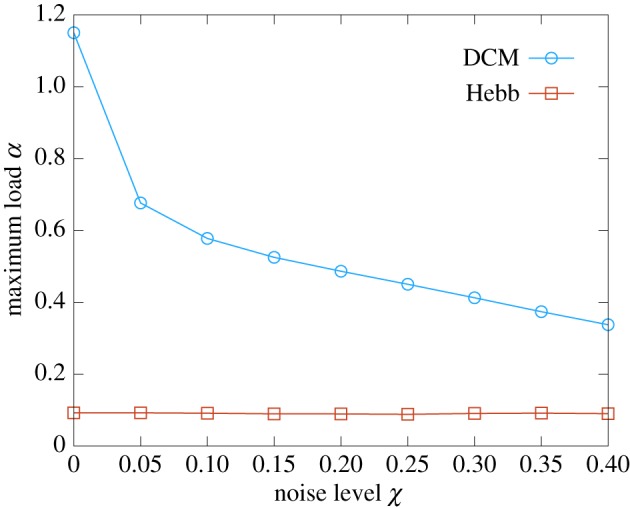
 operatively measures the width of the basins of attraction (it is the fraction of corrupted bits that the network is able to correct, see the text for a more precise definition). Each curve is an average over 10 samples (error bars are smaller than point size). The inverse temperature parameter is set to
  in order to fall within the retrieval phase of the Hopfield model. The critical capacity at zero temperature is lower than the Gardner bound,
  , because of the stochastic component of the dynamics. (Online version in colour.)
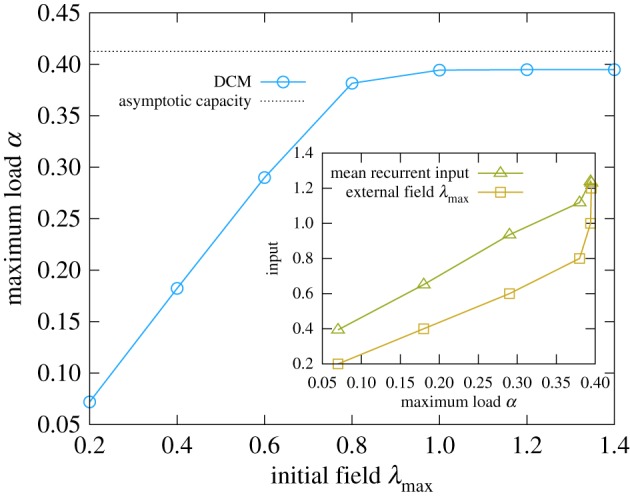
 . The noise level in the retrieval phase is set to
  and the temperature to
  . The curve was obtained by averaging over 100 samples. The inset shows a comparison between the recurrent and external components of the inputs, for the same data points of the main panel. The mean recurrent input was computed as the 2-norm of the mean values. This shows that the DCM rule is effective even for relatively small stimuli. (Online version in colour.)
 , while the sparsity was fixed at
  in order to avoid finite size effects with the relatively small networks. The curves are interrupted at the value of α where the algorithm starts failing. (Online version in colour.)
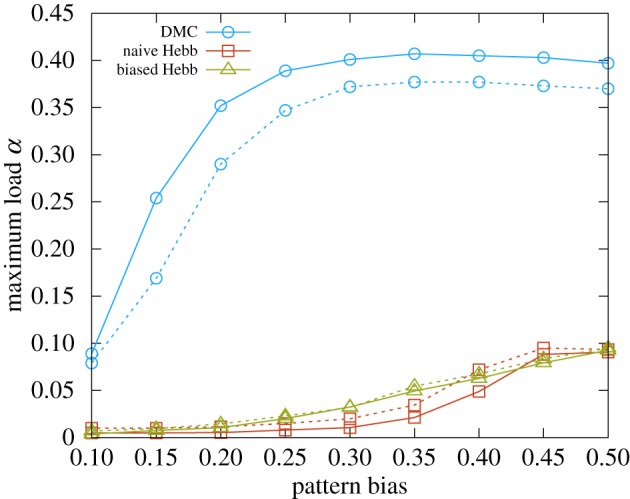
 . The blue curves show the scaling properties of the capacity of the DCM rule as a function of the bias. The drop in the performance for small biases is due to finite size effects, and the performance improves with N. The red and green curves show the results for the naive Hebb rule and the generalized Hebb rule adapted to the biased case, respectively (see the electronic supplementary material, section IV D). For larger N, the capacity for all unbalanced cases is expected to drop to 0. All the curves were obtained by averaging over 10 samples (error bars are smaller than the point size). (Online version in colour.)
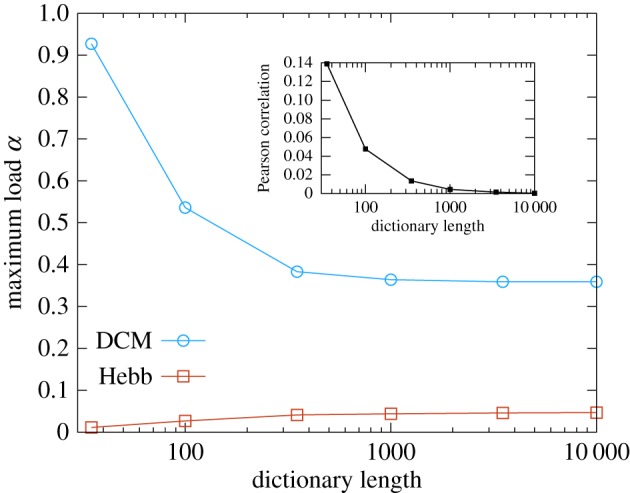
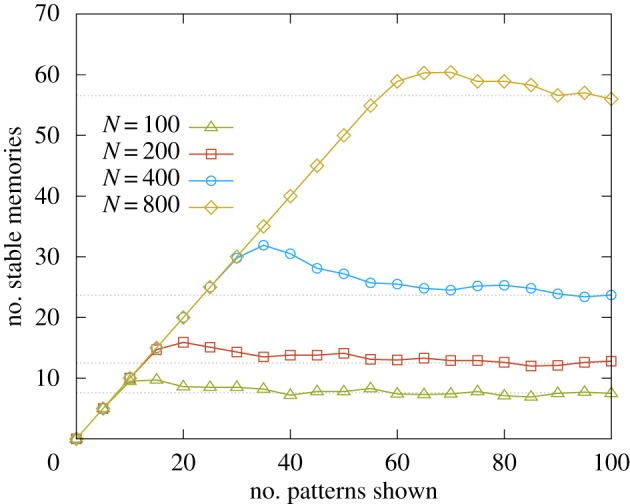
 neurons. The full curves show the results for N = 100, 200, 400 and 800, illustrating the scaling properties of the palimpsest capacity. The dashed grey curves are extrapolated as the mean of the last three measurements. All the points are obtained by averaging over 10 samples. (Online version in colour.)
Similar articles
-
Network capacity analysis for latent attractor computation.Network. 2003 May;14(2):273-302. Network. 2003. PMID: 12790185
-
Learning attractors in an asynchronous, stochastic electronic neural network.Network. 1998 May;9(2):183-205. doi: 10.1088/0954-898x/9/2/003. Network. 1998. PMID: 9861985
-
Memory dynamics in attractor networks with saliency weights.Neural Comput. 2010 Jul;22(7):1899-926. doi: 10.1162/neco.2010.07-09-1050. Neural Comput. 2010. PMID: 20235821
-
NeuCube: a spiking neural network architecture for mapping, learning and understanding of spatio-temporal brain data.Neural Netw. 2014 Apr;52:62-76. doi: 10.1016/j.neunet.2014.01.006. Epub 2014 Jan 20. Neural Netw. 2014. PMID: 24508754 Review.
-
Modelling the formation of working memory with networks of integrate-and-fire neurons connected by plastic synapses.J Physiol Paris. 2003 Jul-Nov;97(4-6):659-81. doi: 10.1016/j.jphysparis.2004.01.021. J Physiol Paris. 2003. PMID: 15242673 Review.
References
-
- Flight MH. 2008. Synaptic transmission: on the probability of release. Nat. Rev. Neurosci. 9, 736–737.
-
- Gerstner W, Kistler WM. 2002. Spiking neuron models: single neurons, populations, plasticity. Cambridge, UK: Cambridge University Press.
Associated data
LinkOut - more resources
Full Text Sources
