

Photocage-initiated time-resolved solution X-ray scattering investigation of protein dimerization
- PMID: 30443351
- PMCID: PMC6211537
- DOI: 10.1107/S2052252518012149
Photocage-initiated time-resolved solution X-ray scattering investigation of protein dimerization
Abstract
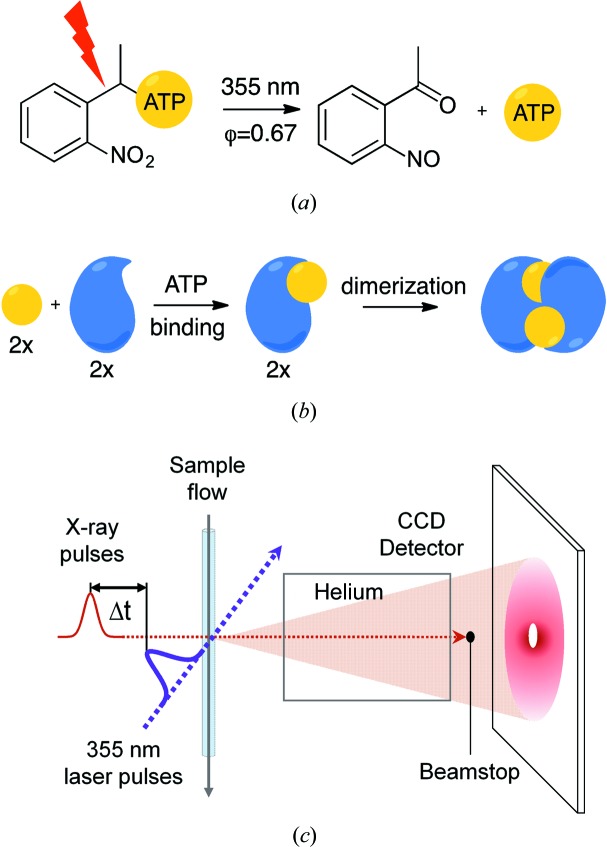
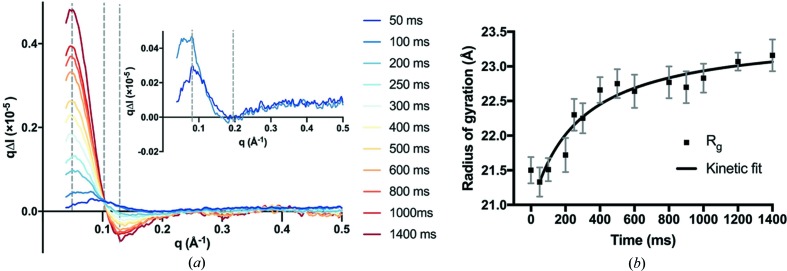
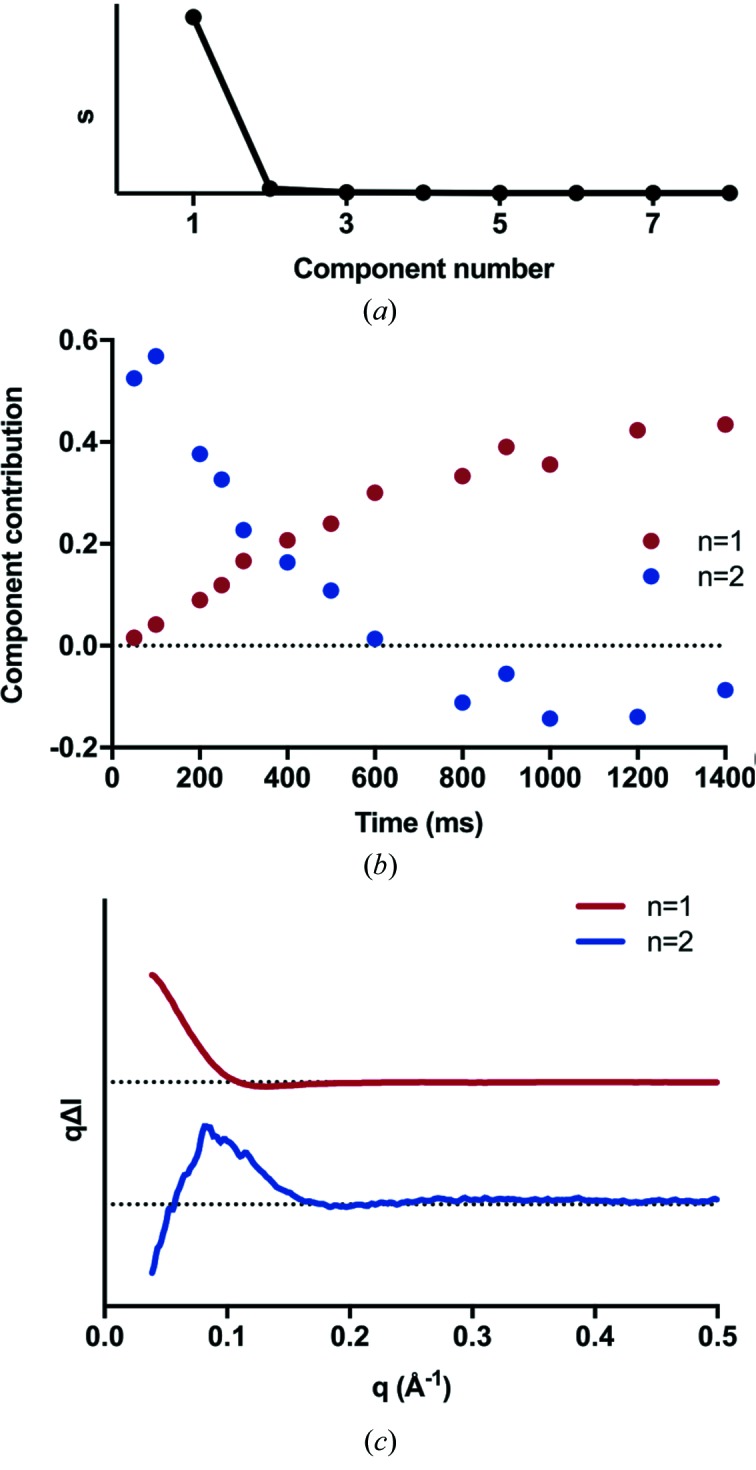
This work demonstrates a new method for investigating time-resolved structural changes in protein conformation and oligomerization via photocage-initiated time-resolved X-ray solution scattering by observing the ATP-driven dimerization of the MsbA nucleotide-binding domain. Photocaged small molecules allow the observation of single-turnover reactions of non-naturally photoactivatable proteins. The kinetics of the reaction can be derived from changes in X-ray scattering associated with ATP-binding and subsequent dimerization. This method can be expanded to any small-molecule-driven protein reaction with conformational changes traceable by X-ray scattering where the small molecule can be photocaged.
Keywords: X-ray solution scattering; biophysics; photocaging; structural biology.
Figures
Similar articles
-
Stopped-flow-time-resolved SAXS for studies of ligand-driven protein dimerization.Methods Enzymol. 2022;677:251-262. doi: 10.1016/bs.mie.2022.08.032. Epub 2022 Oct 29. Methods Enzymol. 2022. PMID: 36410951
-
A proposed time-resolved X-ray scattering approach to track local and global conformational changes in membrane transport proteins.Structure. 2008 Jan;16(1):21-8. doi: 10.1016/j.str.2007.10.016. Structure. 2008. PMID: 18184580
-
Protein structural dynamics revealed by time-resolved X-ray solution scattering.Acc Chem Res. 2015 Aug 18;48(8):2200-8. doi: 10.1021/acs.accounts.5b00198. Epub 2015 Jul 2. Acc Chem Res. 2015. PMID: 26134248 Free PMC article.
-
Using photocaging for fast time-resolved structural biology studies.Acta Crystallogr D Struct Biol. 2021 Oct 1;77(Pt 10):1218-1232. doi: 10.1107/S2059798321008809. Epub 2021 Sep 22. Acta Crystallogr D Struct Biol. 2021. PMID: 34605426 Free PMC article. Review.
-
Time-resolved and in-situ X-ray scattering methods beyond photoactivation: Utilizing high-flux X-ray sources for the study of ubiquitous non-photoactive proteins.Protein Pept Lett. 2016;23(3):242-54. doi: 10.2174/0929866523666160106153847. Protein Pept Lett. 2016. PMID: 26732244 Review.
Cited by
-
Tracking Ca2+ ATPase intermediates in real time by x-ray solution scattering.Sci Adv. 2020 Mar 20;6(12):eaaz0981. doi: 10.1126/sciadv.aaz0981. eCollection 2020 Mar. Sci Adv. 2020. PMID: 32219166 Free PMC article.
-
Identifying protein conformational states in the Protein Data Bank: Toward unlocking the potential of integrative dynamics studies.Struct Dyn. 2024 May 17;11(3):034701. doi: 10.1063/4.0000251. eCollection 2024 May. Struct Dyn. 2024. PMID: 38774441 Free PMC article.
-
Temperature-jump solution X-ray scattering reveals distinct motions in a dynamic enzyme.Nat Chem. 2019 Nov;11(11):1058-1066. doi: 10.1038/s41557-019-0329-3. Epub 2019 Sep 16. Nat Chem. 2019. PMID: 31527847 Free PMC article.
-
Unfolding of the Villin Headpiece Domain: Revealing Structural Heterogeneity with Time-Resolved X-Ray Solution Scattering and Markov State Modeling.Chemphyschem. 2025 Jun 23;26(12):e202500049. doi: 10.1002/cphc.202500049. Epub 2025 May 20. Chemphyschem. 2025. PMID: 40192555 Free PMC article.
-
Chemical screening by time-resolved X-ray scattering to discover allosteric probes.Nat Chem Biol. 2024 Sep;20(9):1199-1209. doi: 10.1038/s41589-024-01609-1. Epub 2024 Apr 26. Nat Chem Biol. 2024. PMID: 38671223 Free PMC article.
References
-
- Clapp, L. H. & Gurney, A. M. (1992). Am. J. Physiol. 262, H916. - PubMed
-
- Goldman, Y. E., Hibberd, M. G., McCray, J. A. & Trentham, D. R. (1982). Nature, 300, 701–705. - PubMed
-
- Jones, E., Oliphant, T. & Peterson, P. (2001). SciPy: Open source scientific tools for Python. http://www.scipy.org/.
LinkOut - more resources
Full Text Sources
