

Single-particle imaging without symmetry constraints at an X-ray free-electron laser
- PMID: 30443357
- PMCID: PMC6211532
- DOI: 10.1107/S205225251801120X
Single-particle imaging without symmetry constraints at an X-ray free-electron laser
Abstract
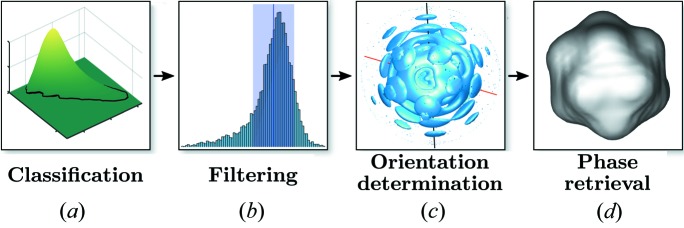
The analysis of a single-particle imaging (SPI) experiment performed at the AMO beamline at LCLS as part of the SPI initiative is presented here. A workflow for the three-dimensional virus reconstruction of the PR772 bacteriophage from measured single-particle data is developed. It consists of several well defined steps including single-hit diffraction data classification, refined filtering of the classified data, reconstruction of three-dimensional scattered intensity from the experimental diffraction patterns by orientation determination and a final three-dimensional reconstruction of the virus electron density without symmetry constraints. The analysis developed here revealed and quantified nanoscale features of the PR772 virus measured in this experiment, with the obtained resolution better than 10 nm, with a clear indication that the structure was compressed in one direction and, as such, deviates from ideal icosahedral symmetry.
Keywords: XFELs; single-particle imaging; three-dimensional virus reconstructions.
Figures
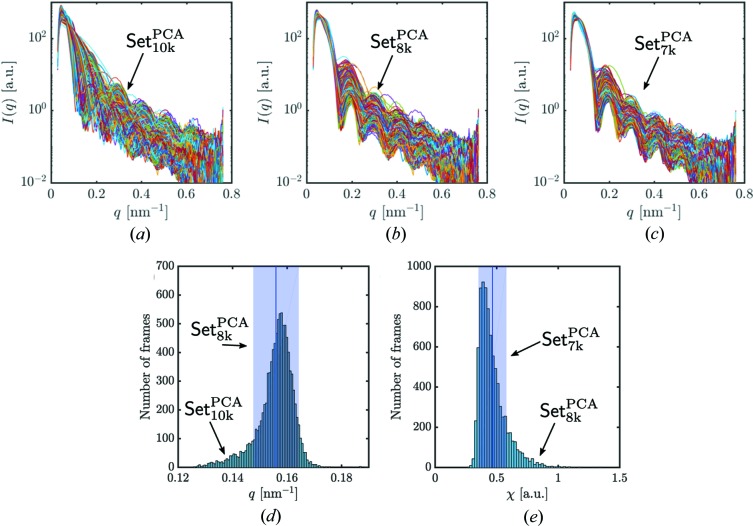
 r.m.s. around the mean value) were selected for further analysis.
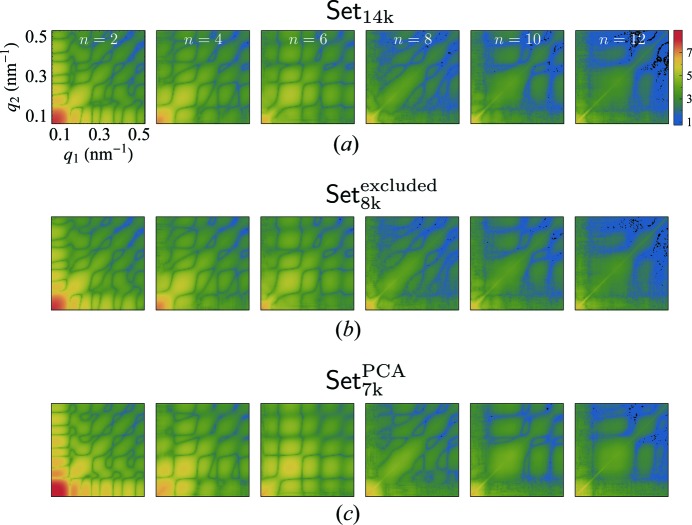
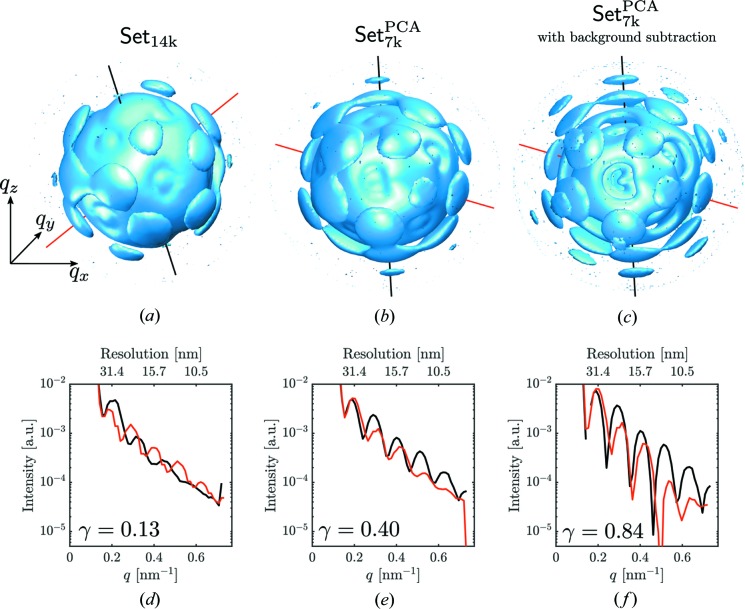
 for even order difference spectra Fourier components. (a) Set14k and (b) Set8k
excluded have very similar features which suggests that Set8k
excluded with presumably non-single hits dominates the properties of Set14k. (c) Set7k
PCA consists of the PCA single-hit selection and shows more pronounced features.
for even order difference spectra Fourier components. (a) Set14k and (b) Set8k
excluded have very similar features which suggests that Set8k
excluded with presumably non-single hits dominates the properties of Set14k. (c) Set7k
PCA consists of the PCA single-hit selection and shows more pronounced features.
References
-
- Als-Nielsen, J. & McMorrow, D. (2011). Elements of Modern X-ray Physics, 2nd ed. Chichester: Wiley.
-
- Altarelli, M., Brinkmann, R., Chergui, M., Decking, W., Dobson, B., Düsterer, S., Grübel, G., Graeff, W., Graafsma, H., Hajdu, J., Marangos, J., Pflüger, J., Redlin, H., Riley, D., Robinson, I., Rossbach, J., Schwarz, A., Tiedtke, K., Tschentscher, T., Vartaniants, I., Wabnitz, H., Weise, H., Wichmann, R., Witte, K., Wolf, A., Wulff, M. & Yurkov, M. (2006). Editors. XFEL: The European X-ray Free-Electron Laser. Technical Design Report 2006–097. Hamburg: DESY.
-
- Altarelli, M., Kurta, R. P. & Vartanyants, I. A. (2010). Phys. Rev. B, 82, 104207.
-
- Aquila, A., Barty, A., Bostedt, C., Boutet, S., Carini, G., dePonte, D., Drell, P., Doniach, S., Downing, K. H., Earnest, T., Elmlund, H., Elser, V., Gühr, M., Hajdu, J., Hastings, J., Hau-Riege, S. P., Huang, Z., Lattman, E. E., Maia, F. R. N. C., Marchesini, S., Ourmazd, A., Pellegrini, C., Santra, R., Schlichting, I., Schroer, C., Spence, J. C. H., Vartanyants, I. A., Wakatsuki, S., Weis, W. I. & Williams, G. J. (2015). Struct. Dyn. 2, 041701. - PMC - PubMed
