. 2018 Nov 13;3(6):e00232-18.
doi: 10.1128/mSystems.00232-18. eCollection 2018 Nov-Dec.

Reevaluating the Salty Divide: Phylogenetic Specificity of Transitions between Marine and Freshwater Systems

Affiliations

Reevaluating the Salty Divide: Phylogenetic Specificity of Transitions between Marine and Freshwater Systems

Sara F Paver et al. mSystems. .

Abstract

Marine and freshwater microbial communities are phylogenetically distinct, and transitions between habitat types are thought to be infrequent. We compared the phylogenetic diversity of marine and freshwater microorganisms and identified specific lineages exhibiting notably high or low similarity between marine and freshwater ecosystems using a meta-analysis of 16S rRNA gene tag-sequencing data sets. As expected, marine and freshwater microbial communities differed in the relative abundance of major phyla and contained habitat-specific lineages. At the same time, and contrary to expectations, many shared taxa were observed in both habitats. Based on several metrics, we found that Gammaproteobacteria, Alphaproteobacteria, Bacteroidetes, and Betaproteobacteria contained the highest number of closely related marine and freshwater sequences, suggesting comparatively recent habitat transitions in these groups. Using the abundant alphaproteobacterial group SAR11 as an example, we found evidence that new lineages, beyond the recognized LD12 clade, are detected in freshwater at low but reproducible abundances; this evidence extends beyond the 16S rRNA locus to core genes throughout the genome. Our results suggest that shared taxa are numerous, but tend to occur sporadically and at low relative abundance in one habitat type, leading to an underestimation of transition frequency between marine and freshwater habitats. Rare taxa with abundances near or below detection, including lineages that appear to have crossed the salty divide relatively recently, may possess adaptations enabling them to exploit opportunities for niche expansion when environments are disturbed or conditions change. IMPORTANCE The distribution of microbial diversity across environments yields insight into processes that create and maintain this diversity as well as potential to infer how communities will respond to future environmental changes. We integrated data sets from dozens of freshwater lake and marine samples to compare diversity across open water habitats differing in salinity. Our novel combination of sequence-based approaches revealed lineages that likely experienced a recent transition across habitat types. These taxa are promising targets for studying physiological constraints on salinity tolerance. Our findings contribute to understanding the ecological and evolutionary controls on microbial distributions, and open up new questions regarding the plasticity and adaptability of particular lineages.

Keywords: 16S rRNA; SAR11; aquatic ecology; aquatic microbiology; biogeography; environmental transitions; microbial ecology; tag sequencing.


Figures

FIG 1
FIG 1
Median relative abundance of phyla/proteobacterial classes in freshwater and marine samples collected from surface (a) and deep (b) waters. The deepest hypolimnion (below thermocline) sample collected from stratified lakes and marine samples collected at depths >75m were classified as “deep” samples. Diagonal lines indicate a 1:1 relationship.
FIG 2
FIG 2
Species accumulation curves for taxonomic groups that contain shared marine and freshwater MED nodes as the number of freshwater sites included in the analysis increases (a) and as the number of marine sites included in the analysis increases (b). The percentage of sequences shared between habitats with all sites analyzed is included to the right of each curve; the total number of MED nodes within each group in freshwater and marine habitats, respectively, is indicated in parentheses.
FIG 3
FIG 3
Maximum sequence identity threshold (i.e., finest-scale resolution) at which pairs of marine and freshwater samples share common taxa. Box plots indicate the median, quartiles, and range of values observed for all marine-freshwater sample pairs. Colored boxes indicate phyla/proteobacterial classes that contain 5 or more shared MED nodes while gray boxes indicate groups that contain 1 to 3 shared MED nodes. The heatmap to the right illustrates the number of freshwater (F) and marine (M) samples containing representatives of each phylum/proteobacterial class. *, Actinobacteria cutoff values were calculated with a preclustered data set (see Fig. S5 for comparison of all groups using a preclustered data set).
FIG 4
FIG 4
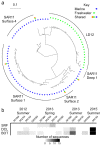
Observations of non-LD12 SAR11. (a) 16S rRNA V4 region gene tree constructed using representative sequences from each SAR11 node. The first ring indicates whether nodes were found only in marine (blue) or freshwater samples (green) while the second ring indicates nodes that are shared across habitat types (orange). (b) Number of non-LD12 SAR11 clade sequences detected at four stations (MI18M, MI27M, MI41M, ON33M) and three depths (SRF, surface; DCL, deep chlorophyll maximum layer; BOT, near-bottom) on Lakes Michigan and Ontario.
FIG 5
FIG 5
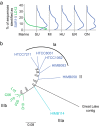
Metagenomic evidence for non-LD12 SAR11 in the Laurentian Great Lakes. (a) Percentage of classified reads identified as LD12 (green) in an open ocean sample (Marine), compared to marine (i.e., non-LD12) SAR11 (blue) in each of the five Laurentian Great Lakes (SU, Superior; MI, Michigan; HU, Huron; ER, Erie; ON, Ontario). Ridge plots present the distribution of identified reads across all protein clusters with greater than 100 reads classified as SAR11 or LD12 at a likelihood value of 0.95. (b) Neighbor-joining consensus tree of 1.2-kb nucleotide sequences from the protein cluster identified as COG2609 (pyruvate dehydrogenase complex, dehydrogenase E1 component). Strain names are colored based on phylogenetic classification within the SAR11 clade: green, LD12 sequences from group IIIb; light blue, group IIIa, sister group to IIIb; medium blue, all other marine SAR11 clades included in the analysis (Ia, II); black, a contig assembled from the Lake Erie metagenome. Consensus support values (%) are indicated on branches.

Similar articles

Cited by

References

    1. Grossart H-P. 2010. Ecological consequences of bacterioplankton lifestyles: changes in concepts are needed. Environ Microbiol Rep 2:706–714. doi:10.1111/j.1758-2229.2010.00179.x. - DOI - PubMed
    1. Cole JJ. 1982. Interactions between bacteria and algae in aquatic ecosystems. Annu Rev Ecol Syst 13:291–314. doi:10.1146/annurev.es.13.110182.001451. - DOI
    1. Koblížek M. 2015. Ecology of aerobic anoxygenic phototrophs in aquatic environments. FEMS Microbiol Rev 39:854–870. doi:10.1093/femsre/fuv032. - DOI - PubMed
    1. Mizuno CM, Rodriguez-Valera F, Ghai R. 2015. Genomes of planktonic Acidimicrobiales: widening horizons for marine actinobacteria by metagenomics. mBio 6:e02083-14. doi:10.1128/mBio.02083-14. - DOI - PMC - PubMed
    1. Salcher MM, Neuenschwander SM, Posch T, Pernthaler J. 2015. The ecology of pelagic freshwater methylotrophs assessed by a high-resolution monitoring and isolation campaign. ISME J 9:2442–2453. doi:10.1038/ismej.2015.55. - DOI - PMC - PubMed