. 2019 Jan;23(1):93-103.
doi: 10.1111/jcmm.13887. Epub 2018 Nov 15.

MiR-130b promotes the progression of oesophageal squamous cell carcinoma by targeting SASH1

Affiliations

MiR-130b promotes the progression of oesophageal squamous cell carcinoma by targeting SASH1

Yuxing Zhu et al. J Cell Mol Med. 2019 Jan.

Abstract

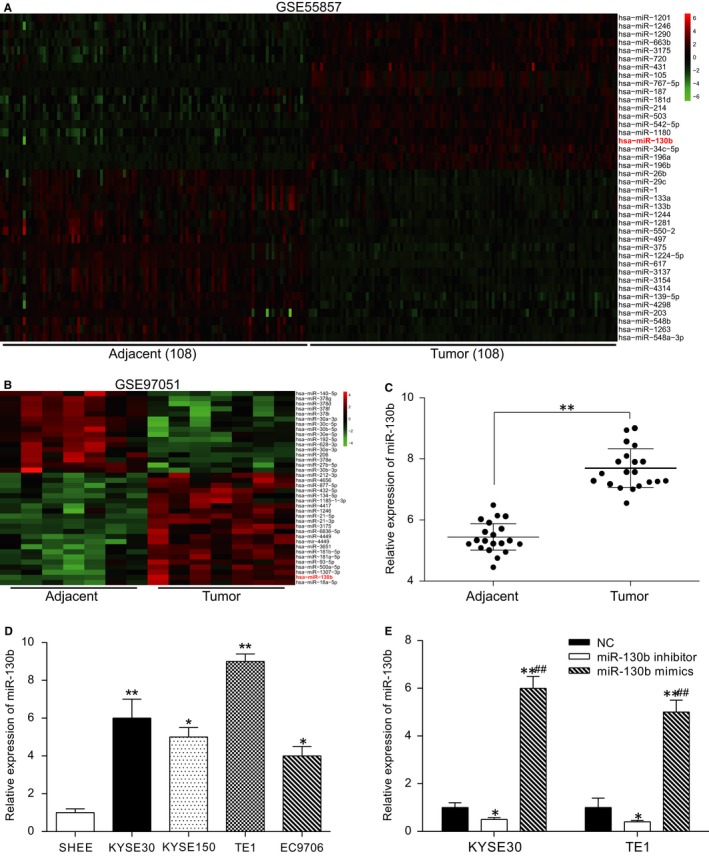
MiR-130b and SAM and SH3 domain containing 1 (SASH1) play an important role in many types of human cancers. The aim of our research was to study their interactions in the process of the proliferation and aggressiveness of oesophageal squamous cell carcinoma (ESCC) cells. Microarray analysis was done to screen the differentially expressed genes in the ESCC tissues. miR-130b and SASH1 mRNA levels in the ESCC tissues and cells were detected by qRT-PCR. Dual luciferase reporter system was used to verify the target relationship between miR-130b and SASH1. The effects of miR-130b on SASH1 expression were explored by western blot in KYSE30 and TE1 cell lines. CCK-8 assay, flow cytometry, Transwell, and wound healing assays were conducted to explore the effects of miR-130b and SASH1 in vitro. In addition, in vivo experiments were conducted to study the roles of miR-130b and SASH1. miR-130b was highly expressed, while SASH1 was the opposite in both the ESCC tissues and cells. The expression of SASH1 was inhibited by the direct binding of miR-130b. The inhibition of miR-130b reduced the proliferation and aggressiveness of ESCC cells, while it also induced apoptosis and cell cycle arrest in the ESCC cells by suppressing SASH1. The in vivo assay suggested that the overexpression of miR-130b promoted the growth of ESCC tumours. MiR-130b was up-regulated in the ESCC tumour tissues and cells, acting as a tumour promoter. A stimulating effect was demonstrated on ESCC cell growth and aggressiveness by suppressing SASH1, which is an anti-oncogene.

Keywords: SASH1; MiR-130b; esophageal squamous cell carcinoma.


Figures

Figure 1
Figure 1
MiR‐130b is highly expressed in ESCC tissues and cell lines. (A) Data from GSE55857: the differentially expressed miRNAs are illustrated in a heatmap. MiR‐130b was part of the overexpression category. (B) Data from GSE97051: the differentially expressed miRNAs are illustrated in a heatmap. MiR‐130b was part of the overexpression category. (C) The qRTPCR results showed the overexpression of miR‐130b in the tumour tissues. **P < 0.01, compared with the adjacent tissues. (D) The expression level of miR‐130b in the ESCC cell lines (KYSE30, KYSE150, TE1, EC9706 and SHEE) was examined by qRTPCR. *P < 0.05, **P < 0.01, compared with the SHEE cell line. (E) The expression level of miR‐130b in the KYSE30 and TE1 cells transfected with the miR‐130b mimics or the miR‐130b inhibitor was determined using qRTPCR. *P < 0.05, **P < 0.01, compared with the NC group; ## P < 0.01, compared with the miR‐130b inhibitor group
Figure 2
Figure 2
MiR‐130b promotes the proliferation, migration and invasion of ESCC cells. (A) The CCK‐8 assay results showed the proliferation of the KYSE30 and TE1 cells for the different groups. *P < 0.05, compared with the NC group; ## P < 0.01, compared with the miR‐130b inhibitor group. (B) The Transwell assay results demonstrated the cell invasion of the different groups. The quantification results are shown in the histogram. *P < 0.05, **P < 0.01, compared with the NC group; ## P < 0.01, compared with the miR‐130b inhibitor group. (C) The wound healing assay results demonstrated the cell migration distance of the different groups. The quantification results are shown in the histogram. *P < 0.05, **P < 0.01, compared with the NC group; ## P < 0.01, compared with the miR‐130b inhibitor group
Figure 3
Figure 3
MiR‐130b inhibits ESCC cell cycle blockade and apoptosis. Flow cytometry was used to assess apoptosis and cell cycle. (A) The apoptosis rates of the cells in the different groups are shown. Propidium iodide (PI) and annexin V‐FITC were the dyes. The histogram shows the apoptosis statistics. (B) The cell cycle distribution of the cells in the different groups is shown. A histogram was given. *P < 0.05, **P < 0.01, compared with the NC group; ## P < 0.01, compared with the miR‐130b inhibitor group
Figure 4
Figure 4
SASH1 is a direct target of miR‐130b. (A) The miR‐130b, wild‐type 3′UTR and mutated 3′UTR sequences of SASH1 were obtained from TargetScan and are illustrated. (B) The dual luciferase reporter gene assay results showed a direct binding interaction between miR‐130b and SASH1. *P < 0.05, compared with the NC mimics group. (C) The expression of miR‐130b and SASH1 were negatively correlated. (D) The qRTPCR results showed the mRNA levels of SASH1 in the KYSE30 and TE1 cells. *P < 0.05, compared with the NC group. (E) The protein expression levels of SASH1 in the KYSE30 and TE1 cells in the different groups
Figure 5
Figure 5
MiR‐130b promotes the proliferation, migration and invasion of ESCC cells by targeting SASH1. (A) The relative mRNA levels of SASH1 in the different groups for the KYSE30 and TE1 cells were examined using qRTPCR and are presented in the histogram. (B) The CCK‐8 assay results are shown, demonstrating the proliferation of the KYSE30 and TE1 cells in the different groups. (C) The invasiveness results are shown. A histogram was also shown to demonstrate the statistics. (D) The migration test results are shown. A histogram is also given. *P < 0.05, **P < 0.01, compared with the NC group
Figure 6
Figure 6
MiR‐130b inhibits cell cycle blockade and apoptosis in the ESCC cells by targeting SASH1. Apoptosis and cell cycle were determined using flow cytometry. (A) The apoptosis rate of the cells in the different groups are shown. Propidium iodide (PI) and annexin V‐FITC were the dyes that were used. The histogram shows the apoptosis rate. (B) The cell cycle distribution of the cells in the different groups are shown. A histogram is given. *P < 0.05, compared with the NC group
Figure 7
Figure 7
MiR‐130b facilitates the proliferation of ESCC cells in vivo. (A) The tumours that were harvested from the nude mice were photographed and are presented here. (B) The tumour volumes of the mice in the different groups are illustrated in the line diagram. (C) The tumour weights of the mice in the different groups are illustrated in the histogram. **P < 0.01, compared with the NC group

Similar articles

Cited by

References

    1. Enzinger PC, Mayer RJ. Esophageal cancer. N Engl J Med. 2003;349:2241‐2252. - PubMed
    1. Xu Y, Yu X, Chen Q, et al. Neoadjuvant versus adjuvant treatment: which one is better for respectable esophageal squamous cell carcinoma? World J Surg Oncol. 2012;10:173. - PMC - PubMed
    1. Matsushima K, Isomoto H, Kohno S, et al. MicroRNAs and esophageal squamous cell carcinoma. Digestion. 2010;82:138‐144. - PubMed
    1. Zhang L, Zhou Y, Cheng C, et al. Genomic analyses reveal mutational signatures and frequently altered genes in esophageal squamous cell carcinoma. Am J Hum Genet. 2015;96:597‐611. - PMC - PubMed
    1. Luthra R, Wu TT, Luthra MG, et al. Gene expression profiling of localized esophageal carcinomas: association with pathologic response to preoperative chemoradiation. J Clin Oncol. 2006;24:259‐267. - PubMed

Publication types

MeSH terms