. 2019 Feb;13(2):322-337.
doi: 10.1002/1878-0261.12405. Epub 2018 Dec 21.

Pirin: a potential novel therapeutic target for castration-resistant prostate cancer regulated by miR-455-5p

Affiliations

Pirin: a potential novel therapeutic target for castration-resistant prostate cancer regulated by miR-455-5p

Takayuki Arai et al. Mol Oncol. 2019 Feb.

Abstract

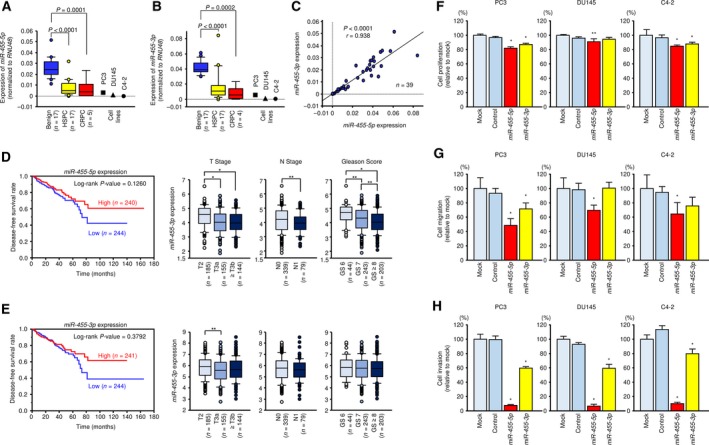
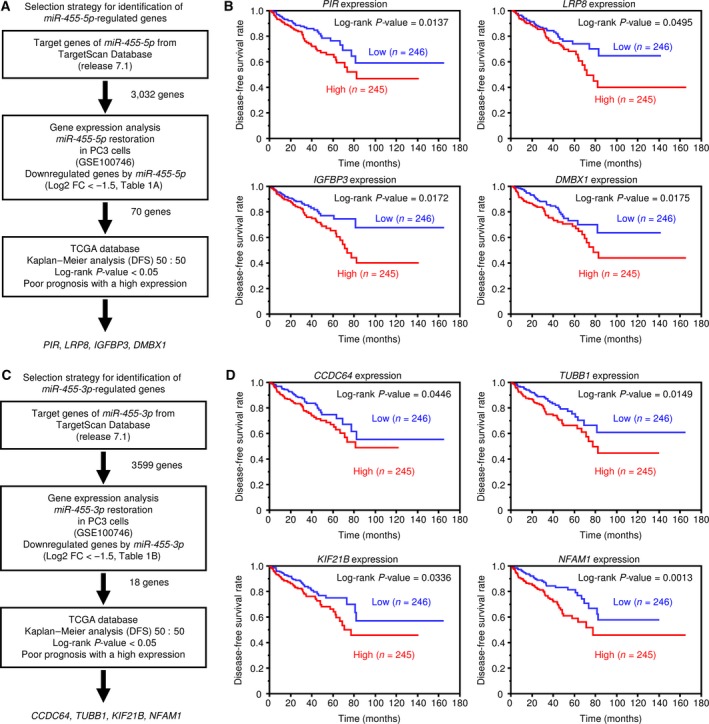
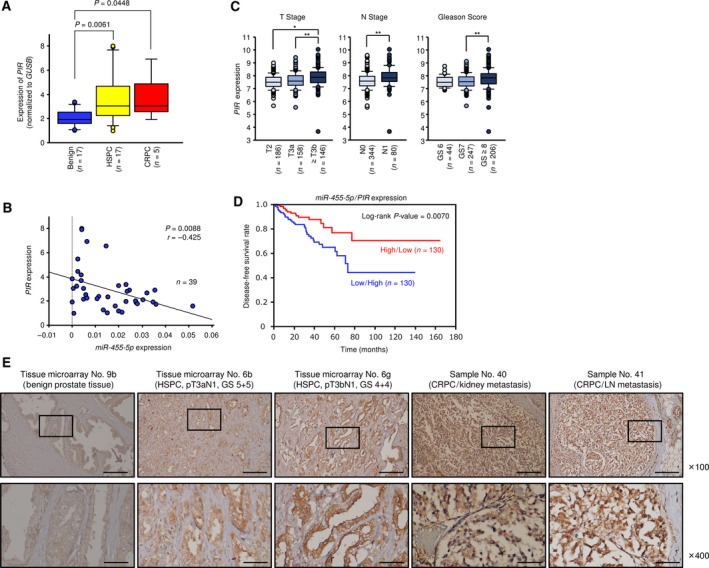
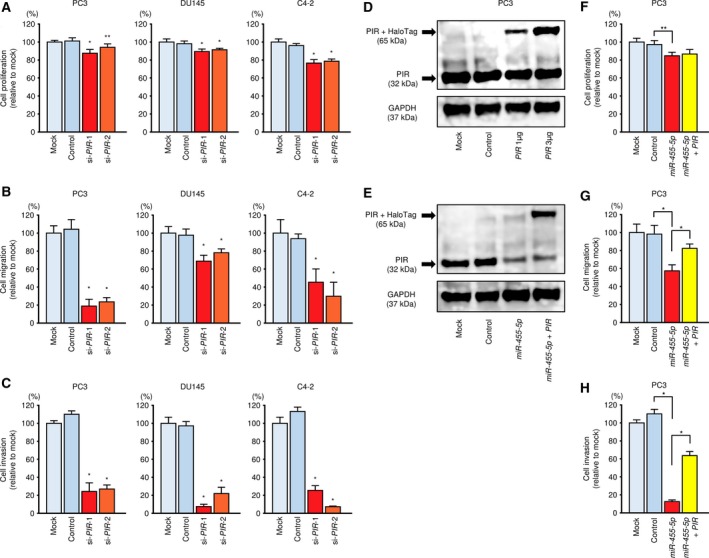
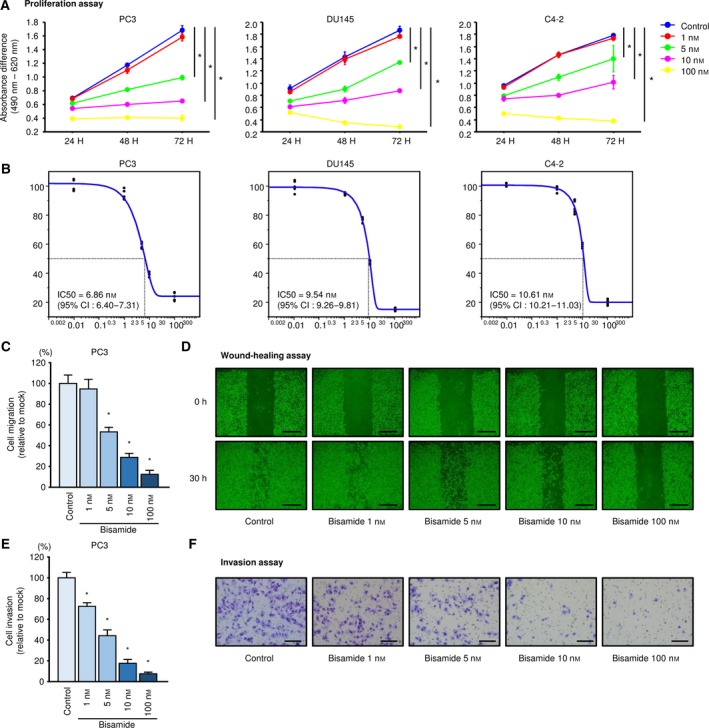
Androgen deprivation therapy is frequently used to treat prostate cancer (PCa), but resistance can occur, a condition known as castration-resistant prostate cancer (CRPC). Thus, novel approaches for identification of CRPC are important for designing effective PCa treatments. Analysis of microRNA (miRNA) expression signatures by RNA sequencing showed that both passenger and guide strands of the miR-455-duplex (miR-455-5p and miR-455-3p, respectively) acted as antitumor miRNAs in PCa cells. The involvement of miRNA passenger strands in cancer pathogenesis is a novel concept for miRNA functionality. Based on a large patient cohort in The Cancer Genome Atlas, expression of eight miR-455-5p/-3p target genes (PIR: P = 0.0137, LRP8: P = 0.0495, IGFBP3: P = 0.0172, DMBX1: P = 0.0175, CCDC64: P = 0.0446, TUBB1: P = 0.0149, KIF21B: P = 0.0336, and NFAM1: P = 0.0013) was significantly associated with poor prognosis of PCa patients. Here, we focused on PIR (pirin), a highly conserved member of the cupin superfamily. PIR expression was directly regulated by miR-455-5p, and PIR overexpression was detected in hormone-sensitive prostate cancer (HSPC) surgical specimens and CRPC autopsy specimens. Loss-of-function assays using siRNA or an inhibitor (bisamide) showed that downregulation of PIR expression blocked cancer cell migration and invasion. Moreover, the miR-455-5p/PIR axis contributed to cancer cell aggressiveness. These results suggest that PIR might be a promising diagnostic marker for HSPC and CRPC. Furthermore, CRPC treatment strategies targeting PIR may be possible in the future. Identification of antitumor miRNAs, including miRNA passenger strands, may contribute to the development of new diagnostic markers and therapeutic strategies for CRPC.

Keywords: miR-455-5p; bisamide; castration-resistant prostate cancer; pirin.


Figures

Figure 1
Figure 1
Expression of miR‐455‐5p/‐3p in clinical PCa specimens and functional analysis of miR‐455‐5p/‐3p in PCa cell lines. Expression levels of (A) miR‐455‐5p and (B) miR‐455‐3p in PCa clinical specimens and cell lines determined using qRTPCR. RNU48 was used as an internal control. P‐values were calculated using Bonferroni‐adjusted Mann–Whitney U‐test. (C) Correlations between the relative expression levels of miR‐455‐5p and miR‐455‐3p analyzed by using Spearman's rank test. (D) Kaplan–Meier patient survival curves for DFS rates based on miR‐455‐5p expression (left) and relationships between miR‐455‐5p expression and T stage, N stage, and Gleason score (right) in PCa patients from the TCGA database. (E) Kaplan–Meier patient survival curves for DFS rates based on miR‐455‐3p expression (left) and relationships between expression of miR‐455‐3p and T stage, N stage, and Gleason score (right). *< 0.0001 and **< 0.05. P‐values were calculated using Mann–Whitney U‐test or Bonferroni‐adjusted Mann–Whitney U‐test. (F–H) Cell proliferation, migration, and invasion assays in cells transfected with miR‐455‐5p/‐3p. Error bars are represented as mean ± SD (n = 5, n = 8, and n = 8, respectively). *< 0.0001 and **< 0.05, relative to both mock and control. P‐values were calculated using Bonferroni‐adjusted Mann–Whitney U‐test.
Figure 2
Figure 2
Identification of miR‐455‐5p/‐3p target genes and relationship between putative target genes and DFS rates. (A) Flowchart of the strategy used to identify miR‐455‐5p target genes. (B) Kaplan–Meier patient survival curves for DFS rates based on PIR, LRP8, IGFBP3, and DMBX1 expression in PCa patients from the TCGA database. (C) Flowchart of the strategy to identify miR‐455‐3p target genes. (D) Kaplan–Meier patient survival curves for DFS rates based on CDC64, TUBB1, KIF21B, and NFAM1 expression.
Figure 3
Figure 3
Expression of PIR in clinical PCa specimens and relationship between PIR and clinicopathological factors. (A) Expression levels of PIR in PCa clinical specimens and cell lines. GUSB was used as an internal control. P‐values were calculated using Bonferroni‐adjusted Mann–Whitney U‐test. (B) Negative correlation between miR‐455‐5p and PIR expression analyzed by using Spearman's rank test. (C) Relationships between PIR expression and T stage, N stage, and Gleason score in PCa patients from the TCGA database. *< 0.0001, **< 0.001. P‐values were calculated using Mann–Whitney U‐test or Bonferroni‐adjusted Mann–Whitney U‐test. (D) Kaplan–Meier patient survival curves for DFS rates by a combination of miR‐455‐5p and PIR expression (miR‐455‐5p high/PIR low versus miR‐455‐5p low/PIR high). (E) Immunochemical staining of PIR in prostate specimens. Scale bars of ×100 and ×400 represent 200 and 50 μm, respectively.
Figure 4
Figure 4
Functional analysis of PIR in PCa cells. (A–C) Knockdown assay with si‐PIR. Cell proliferation, migration, and invasion assays following transfection with si‐PIR‐1 and si‐PIR2. Error bars are represented as mean ± SD (n = 5, n = 8, and n = 8, respectively). *< 0.0001 and **< 0.001, relative to both mock and control. P‐values were calculated using Bonferroni‐adjusted Mann–Whitney U‐test. (D) PIR protein expression was evaluated by western blot analysis of PC3 cells 48 h after forward transfection with the PIR vector. GAPDH was used as a loading control. (E) PIR protein expression was evaluated by western blot analysis of PC3 cells 72 h after reverse transfection with miR‐455‐5p and 48 h after forward transfection with the PIR vector. (F–H) Rescue experiments with miR‐455‐5p and PIR vector. Cell proliferation, migration, and invasion assays following transfection with miR‐455‐5p and PIR vector. Error bars are represented as mean ± SD (n = 5, n = 8, and n = 8, respectively). *< 0.0001, **< 0.001. P‐values were calculated using Bonferroni‐adjusted Mann–Whitney U‐test.
Figure 5
Figure 5
Effects of the small‐molecule PIR inhibitor bisamide (CCT251236) on PCa proliferation, migration, and invasion. (A) Proliferation curves over time according to the results of XTT assays following bisamide treatment in PC3, DU145, and C4‐2 were generated using the absorbance difference between 490 and 620 nm. Error bars are represented as mean ± SD (n = 5). *< 0.0001, relative to control at 72 h. P‐values were calculated using Bonferroni‐adjusted Mann–Whitney U‐test. (B) Dose‐dependent curves of bisamide on cell proliferation at 72 h in PC3, DU145, and C4‐2. The IC50 was calculated using jmp software. (C) Cell migration assays using bisamide in PC3. Error bars are represented as mean ± SD (n = 8). *< 0.0001, relative to control. P‐values were calculated using Bonferroni‐adjusted Mann–Whitney U‐test. (D) Phase micrographs of wound‐healing assays using bisamide in PC3. Scale bars represent 500 μm. (E) Cell invasion assays using bisamide in PC3. Error bars are represented as mean ± SD (n = 8). *< 0.0001, relative to control. P‐values were calculated using Bonferroni‐adjusted Mann–Whitney U‐test. (F) Phase micrographs of invasion assays using bisamide in PC3. Scale bars represent 200 μm.

References

    1. Adeniran C and Hamelberg D (2017) Redox‐specific allosteric modulation of the conformational dynamics of kappaB DNA by pirin in the NF‐kappaB supramolecular complex. Biochemistry 56, 5002–5010. - PubMed
    1. Arai T, Fuse M, Goto Y, Kaga K, Kurozumi A, Yamada Y, Sugawara S, Okato A, Ichikawa T, Yamanishi T et al (2018a) Molecular pathogenesis of interstitial cystitis based on microRNA expression signature: miR‐320 family‐regulated molecular pathways and targets. J Hum Genet 63, 543–554. - PubMed
    1. Arai T, Okato A, Kojima S, Idichi T, Koshizuka K, Kurozumi A, Kato M, Yamazaki K, Ishida Y, Naya Y et al (2017) Regulation of spindle and kinetochore‐associated protein 1 by antitumor miR‐10a‐5p in renal cell carcinoma. Cancer Sci 108, 2088–2101. - PMC - PubMed
    1. Arai T, Okato A, Yamada Y, Sugawara S, Kurozumi A, Kojima S, Yamazaki K, Naya Y, Ichikawa T and Seki N (2018b) Regulation of NCAPG by miR‐99a‐3p (passenger strand) inhibits cancer cell aggressiveness and is involved in CRPC. Cancer Med 7, 1988–2002. - PMC - PubMed
    1. Cheeseman MD, Chessum NE, Rye CS, Pasqua AE, Tucker MJ, Wilding B, Evans LE, Lepri S, Richards M, Sharp SY et al (2017) Discovery of a chemical probe bisamide (CCT251236): an orally bioavailable efficacious pirin ligand from a heat shock transcription factor 1 (HSF1) phenotypic screen. J Med Chem 60, 180–201. - PMC - PubMed

Publication types

Associated data