. 2018 Nov 16;16(11):e2006898.
doi: 10.1371/journal.pbio.2006898. eCollection 2018 Nov.

Identification of molecular determinants that govern distinct STIM2 activation dynamics

Affiliations

Identification of molecular determinants that govern distinct STIM2 activation dynamics

Sisi Zheng et al. PLoS Biol. .

Abstract

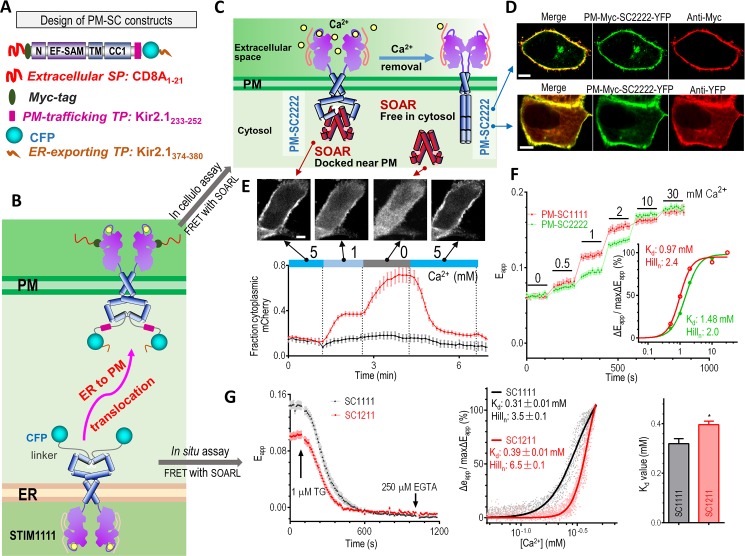
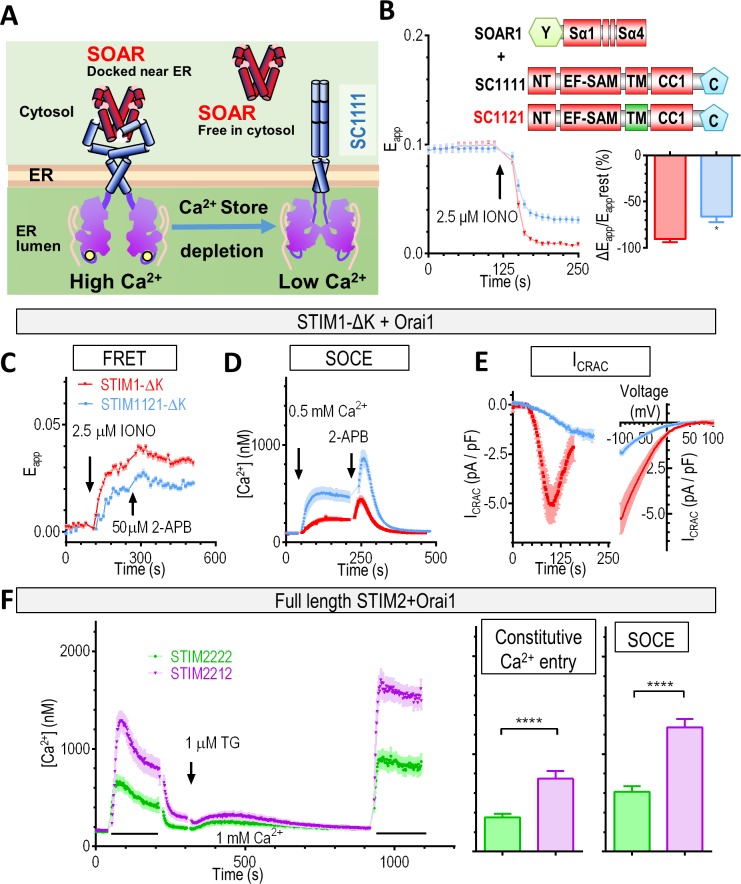
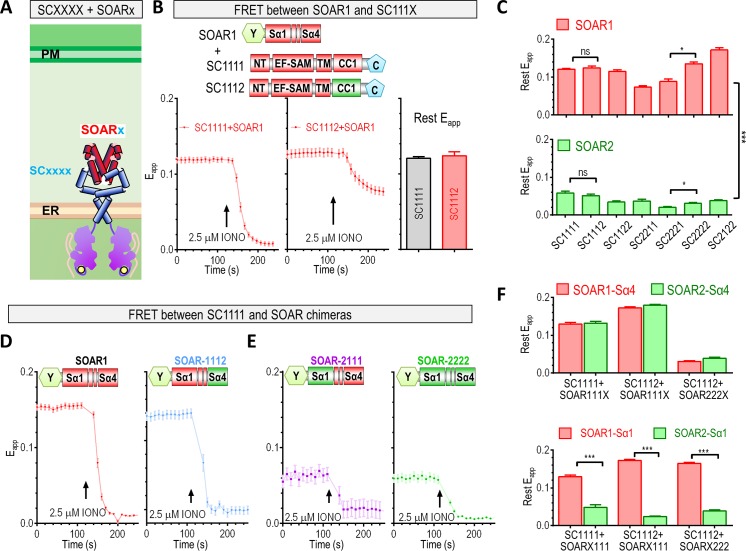
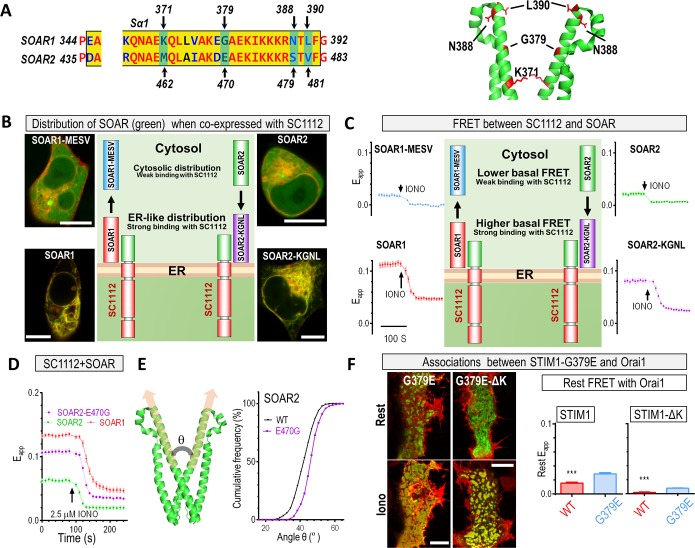
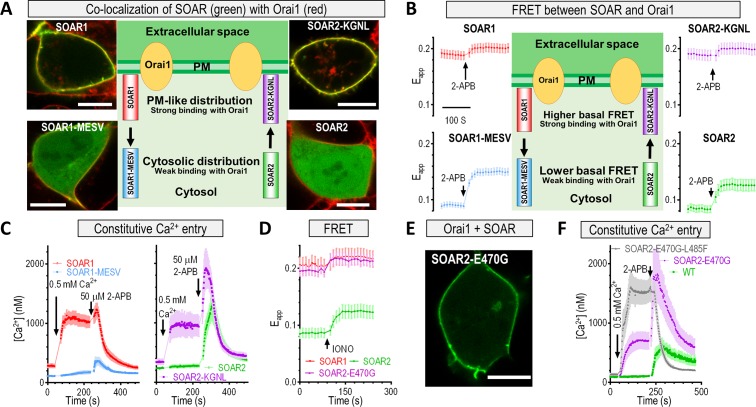
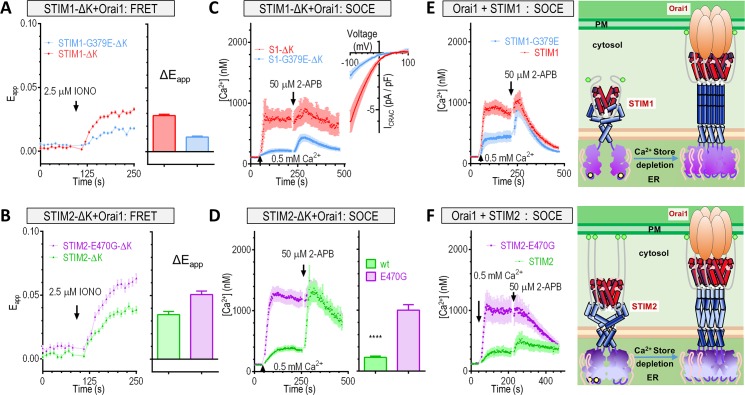
The endoplasmic reticulum (ER) Ca2+ sensors stromal interaction molecule 1 (STIM1) and STIM2, which connect ER Ca2+ depletion with extracellular Ca2+ influx, are crucial for the maintenance of Ca2+ homeostasis in mammalian cells. Despite the recent progress in unraveling the role of STIM2 in Ca2+ signaling, the mechanistic underpinnings of its activation remain underexplored. We use an engineering approach to direct ER-resident STIMs to the plasma membrane (PM) while maintaining their correct membrane topology, as well as Förster resonance energy transfer (FRET) sensors that enabled in cellulo real-time monitoring of STIM activities. This allowed us to determine the calcium affinities of STIM1 and STIM2 both in cellulo and in situ, explaining the current discrepancies in the literature. We also identified the key structural determinants, especially the corresponding G residue in STIM1, which define the distinct activation dynamics of STIM2. The chimeric E470G mutation could switch STIM2 from a slow and weak Orai channel activator into a fast and potent one like STIM1 and vice versa. The systemic dissection of STIM2 activation by protein engineering sets the stage for the elucidation of the regulation and function of STIM2-mediated signaling in mammals.


Conflict of interest statement

The authors have declared that no competing interests exist.

Figures

Fig 1
Fig 1. In cellulo and in situ determination of the apparent Ca2+ affinities of STIMs using engineered nanosensors.
(A) Diagram showing the design of the engineered PM-anchoring SCs. Myc tag and three SPs or TPs that aided ER extrusion and PM export of the SCs were engineered into SCs. (B) A cartoon of the different cellular distributions of SCs (ER) and PM-anchoring SCs (PM). (C) A diagram of the design of the PM-localized nanosensors for the quantification of Ca2+ affinities of STIM in cellulo. A sensor has two components: a YFP-tagged cytosolic SOAR/CAD or SOAR1L (STIM1343-491) domain and a CFP-tagged, PM-anchoring SC localized in the PM, with the Ca2+-sensing EF-SAM facing the extracellular space. Sensing of the changes in extracellular Ca2+ levels by the EF-SAM of the PM-anchoring SC initiates conformational changes in the SC to disrupt its interaction with SOAR1L. This results in the redistribution of SOAR within cells and impacts the FRET signals between the nanosensor pair. More details of the design strategy are given in S2 Fig. (D) Typical confocal images of cellular distribution of PM-SC2222-YFP expressed in HeLa cells (representative for at least 38 cells). The localization of SC2222 is revealed both by antibodies in live cells immunostaining without PM permeabilization against its N-terminal Myc tag (top right image, middle images) and coexpressed YFP-nanobody mCh-tagged LAG9 distribution around the PM (bottom right image). Scale bar, 10 μm. (E) Upon co-transfection with PM-localized SC1111-CFP (PM-SC1111) in HeLa cells, the cellular distribution of mCh-CAD changes with changing extracellular Ca2+ concentrations. Top images: typical cellular distribution of mCh-CAD in bath solutions with different Ca2+ content (approximately 55 cells examined). The Ca2+ concentration is stated underneath each image. Bottom trace: Changes in the relative ratio of cytoplasmic mCh fluorescence to PM mCh fluorescence with changes in extracellular Ca2+ concentrations. The black trace shows the CAD signal when not coexpressed with PM-SC1111; the red trace represents the CAD signal when coexpressed with PM-SC1111. (F) FRET responses between YFP-SOAR1L and engineered PM-STIMCC1–CFP constructs. Left: representative traces; right: dose response curves (n = 3, more than 43 cells examined in each group). (G) In situ determination of Ca2+ affinities of STIM constructs. In HeLa SK cells coexpressing R-CEPIA1er, YFP-SOAR1L, and SC1111-CFP or SC1211-CFP, ER Ca2+ levels and FRET signals between SCs and SOAR1L were monitored simultaneously. Left: Typical traces of the rest state and TG-induced responses for FRET signals between YFP-SOAR1L and SC1111-CFP or SC1211-CFP. Middle: Typical relationships between the ER Ca2+ levels and the relative changes in Eapp signals, calculated from left trace. Solid lines are fits of data points using the Hill equation. Right: Statistical analysis for the Ca2+ affinities of the ER-distributed STIM constructs (n = 3, *P < 0.05, paired t test). Individual numerical values underlying (E), (F), and (G) may be found in S1 Data. CAD, CRAC-activating domain; CC1, coiled-coil 1; CRAC, Ca2+-release–activated Ca2+ current; CFP, cyan fluorescent protein; EF-SAM, EF-hand and sterile alpha motif domain; ER, endoplasmic reticulum; FRET, Förster resonance energy transfer; mCh, mCherry; PM, plasma membrane; SAM, sterile alpha motif; SC, STIM1-CC1 construct; SOAR, STIM-Orai–activating region; SK, STIM1 and STIM2 double knockout; SP, signal peptide; STIM, stromal interaction molecule; TG, thapsigargin; TP, target peptide; YFP, yellow fluorescent protein.
Fig 2
Fig 2. The STIM2-TM domain activates the cytosolic region of STIMs less efficiently than that of STIM1.
(A) A diagram of colocalization of the ER-localized SC1111 and SOAR under resting or Ca2+ store-depleted condition. (B) When the STIM1-TM is replaced with that of STIM2, IONO-mediated Ca2+ store depletion induced slower and smaller decrease in the FRET signals between SC1211 and SOAR than SC1111 and SOAR. Left: typical traces; right: statistics of the rate of FRET decrease (n = 4, *P < 0.02, t test; –90.47% ± 6.66% versus –66.13% ± 11.93%). (C–E) HEK293-Orai1-CFP stable cells transiently expressing STIM1111-ΔK (STIM1-ΔK)-YFP or STIM1121-ΔK-YFP. (C) Typical FRET signals of STIM1121-ΔK and Orai1 before and after Ca2+ store depletion. IONO induced a smaller FRET increase in STIM1121-ΔK–expressing cells than in STIM1-ΔK–expressing cells (0.028 ± 0.001 versus 0.018 ± 0.001, n = 4, ****P < 0.0001, t test). (D) Typical SOCE responses as indicated by Fura-2 imaging. TG-induced SOCE responses were reduced in cells expressing STIM1121-ΔK (358.7 ± 49.35 versus 117.7 ± 12.94, n = 4, ****P < 0.0001, t test). Cells were pretreated with 1 μM TG for 10 min to deplete the ER Ca2+ stores before the measurements. TG was also present during the recordings. (E) Average whole-cell ICRAC recordings. Left: average time course of whole-cell ICRAC currents measured at –100 mV. Currents mediated by STIM1121-ΔK developed significantly more slowly than control (time to peak, 72 ± 7 s versus 147 ± 9 s, n = 7, ****P < 0.0001, t test), with the maximal current density also reduced (–5.5 ± 0.8 pA/pF versus –1.5 ± 0.1 pA/pF, n = 7, *****P < 0.0004, t test). To aid comparison, the individual traces were aligned according to the onset of ICRAC (+36 s). Right: average I–V relationships at the peak of ICRAC. (F) Ca2+ responses of HEK293-Orai1-CFP stable cells transiently expressing STIM2222-ΔK (STIM2-ΔK)-YFP or STIM2212-ΔK-YFP. Left: representative traces. Middle: statistics for constitutive Ca2+ entry, Right: statistics for SOCE (n = 3, ****P < 0.0001, t test). Individual numerical values underlying (B–F) may be found in S1 Data. 2-APB, 2-Aminoethoxydiphenyl borate; CC1, coiled-coil 1; CRAC, Ca2+-release–activated Ca2+ current; ER, endoplasmic reticulum; FRET, Förster resonance energy transfer; HEK293, human embryonic kidney 293 cells; IONO, ionomycin; I–V, current–voltage; NT, N terminus; SAM, sterile alpha motif; SC, STIM1-CC1 construct; SOAR, STIM-Orai–activating region; SOCE, store-operated Ca2+ entry; STIM, stromal interaction molecule; TG, thapsigargin; TM, transmembrane region; YFP, yellow fluorescent protein.
Fig 3
Fig 3. SOAR α1 helix defines its ability to interact with the STIM-CC1 region.
(A–C) Comparative analysis of the effect of CC1 or SOAR α1 exchange on the resting FRET signals between STIM1-CC1 and SOAR molecules. (A) A diagram showing the FRET-based nanosensors used. (B) The effect of CC1 exchange on FRET signals between SC111x and SOAR molecules. Left and middle: typical traces; right: statistical analysis for the resting FRET reading (n = 3, P = 0.50, t test). (C) Statistical analysis showing the effects of CC1 or SOAR exchange on the resting FRET signals (Eapp) between STIM1-CC1 and SOAR molecules (n = 3, *P < 0.05, ***P < 0.001, t test). (D–F) Comparison of the effects of SOAR α1 or α4 exchanges on FRET signals between STIM1-CC1 and SOAR molecules: (D) exchange of the SOAR α4 region; (E) exchange of the SOAR α1 region. (F) Statistics showing the effects of SOAR α1 or α4 exchanges on resting FRET signals (Eapp) between SOAR and SCs. Top panel: the effect of SOAR α4 exchange; bottom panel: the effect of SOAR α1 exchange (n = 3, ***P < 0.001, t test). Individual numerical values underlying (B)–(F) may be found in S1 Data. C, cyan fluorescent protein; CC1, coiled-coil 1; ER, endoplasmic reticulum; FRET, Förster resonance energy transfer; IONO, ionomycin; ns, not significant; NT, N terminus; PM, plasma membrane; SAM, sterile alpha motif; SC, STIM1-CC1 construct; SOAR, STIM-Orai–activating region; STIM, stromal interaction molecule; TM, transmembrane region; Y, yellow fluorescent protein.
Fig 4
Fig 4. E470 residue in SOAR2 α1 region weakens its interactions with STIMCC1.
(A) Four critical residues in the SOAR α1 region. Left: alignment of a partial sequence of the α1 region of SOAR1 and SOAR2, with the four critical residues indicated by arrows. Right: cartoon of a portion of a SOAR1 dimer crystal structure, with the four residues marked in red. (B–C) Comparative analysis of YFP-SOAR1, YFP-SOAR1-MESV, YFP-SOAR2, and YFP-SOAR2-KGNL constructs coexpressed with SC1112-CFP in HEK293 cells. (B) Typical confocal images of the distribution of the cytosolic SOAR constructs (green) and SC1112-CFP (red) (scale bar, 10 μm). Middle: cartoons illustrating the effects of substitutions on subcellular distributions of SOAR molecules coexpressed with SC1112-CFP (at least 12 cells for each condition were examined each time; n = 3). (C) Representative traces of FRET signals between SC1112-CFP and SOAR constructs. Middle: cartoons illustrating the effects of substitutions on FRET signal. (D) Typical traces showing the effect of E470G substitution on the FRET signals between SC1112-CFP and SOAR2. (E) Results of computer simulations demonstrating the effect of the E470G substitution on the angle between SOAR2 monomers. (F) FRET signals (bar graphs) and confocal images (left) demonstrating the associations or colocalization of Orai1 and STIM variants. Scale bar, 10 μm (n = 3, ***P < 0.001, t test). Individual numerical values underlying (C)–(F) may be found in S1 Data. CC1, coiled-coil 1; CFP, cyan fluorescent protein; ER, endoplasmic reticulum; FRET, Förster resonance energy transfer; HEK293, human embryonic kidney cells; IONO, ionomycin; KGNL, M462K-E470G-S479N-V481L; MESV, K371M-G379E-N388S-L390V;SC, STIM1-CC1 construct; SOAR, STIM-Orai–activating region; STIM, stromal interaction molecule; WT, wild type; YFP, yellow fluorescent protein.
Fig 5
Fig 5. SOAR2-E470 determines the weak efficacy of SOAR2 to couple and activate Orai1 channels.
(A–C) Comparative analysis of YFP-SOAR1, YFP-SOAR1-MESV, YFP-SOAR2, and YFP-SOAR2-KGNL constructs transiently expressed in HEK293-Orai1-CFP stable cells. A) Typical confocal images of the distribution of the cytosolic SOAR constructs and Orai1-CFP (scale bar, 10 μm). Middle: cartoons illustrating the effects of substitutions on the subcellular distribution of the SOAR molecules coexpressed with Orai1 (n = 3, at least 40 cells examined for each construct). (B) Representative traces of FRET signals between Orai1-CFP and SOAR constructs. Middle: cartoons illustrating the effects of substitutions on FRET signals. (C) Typical traces of a constitutive Ca2+ influx. (D–F) Analysis of SOAR2-E470G or SOAR2-E470G-L485F variants transiently expressed in HEK293-Orai1-CFP stable cells. (D) Representative traces of FRET signals between Orai1-CFP and SOAR2-E470G or WT SOAR. (E) Confocal images of the typical distribution of SOAR2-E470G molecules expressed in HEK293-Orai1-CFP stable cells (n = 3, at least 47 cells examined for each construct). Scale bar, 10 μm. (F) Typical traces of a constitutive Ca2+ influx mediated by WT SOAR or corresponding variants. Individual numerical values underlying (B–F) may be found in S1 Data. 2-APB, 2-Aminoethoxydiphenyl borate; CFP, cyan fluorescent protein; FRET, Förster resonance energy transfer; HEK293, human embryonic kidney 293 cells; IONO, ionomycin; KGNL, M462K-E470G-S479N-V481L; MESV, K371M-G379E-N388S-L390V; PM, plasma membrane; SOAR, STIM-Orai–activating region; STIM, stromal interaction molecule; WT, wild type; YFP, yellow fluorescent protein.
Fig 6
Fig 6. STIM2-E470 restricts STIM2 activation and its ability to induce SOCE.
In HEK293 Orai1-CFP stable cells, the effects of G379E or E470G substitutions on the coupling of transiently expressed STIM or STIM-ΔK with Orai1 were examined. (A–B) Rest and IONO-induced FRET signals between Orai1 and (A) STIM1 or STIM1-G379E or (B) STIM2 or STIM2-E470G. Each left: typical traces; each right: statistical analysis. (C–D) SOCE responses. (C) Typical SOCE (left) or average ICRAC (right) responses for STIM1-ΔK and STIM1-G379E-ΔK. For Ca2+ imaging traces (left), the ER Ca2+ store was emptied by a 10 min incubation in 1 μM TG before the recordings (n = 3). I–V relationships at the peak of whole cell current are also shown (right, n = 6). (D) SOCE responses for STIM2-ΔK and STIM2-E470G-ΔK. Left, typical traces; right, statistical analysis (****P < 0.0001, t test, n = 3). (E–F) Typical traces showing the effects of STIM1-G379E or STIM2-E470G substitutions on SOCE responses mediated by Orai1 and full-length STIM. Diagrams on the right: A model illustrating distinct SOCE activation modes mediated by STIMs (please refer to S5C Fig for a simplified version). Upon store depletion, similar to STIM1 (top panel), the cytosolic region of STIM2 (bottom panel) also undergoes conformational changes to further engage and activate Orai1 channels. The activation of STIM2 has several distinct features. First, the relatively lower Ca2+ affinity of STIM2-EF-SAM keeps STIM2 partially and constitutively active. Second, the SOAR2-E470 narrows down activation dynamics of STIM2 with two effects: At rest, it impairs the efficient caging by CC1, presenting SOAR2 close to the PM. Upon activation, it restricts the Orai1-binding efficacy of SOAR, keeping SOAR2 from getting too close to Orai1 on the PM. Thus, the SOAR2 region of STIM2 only needs to move a smaller distance to switch STIM2 from a store-replete mode to a store-depleted one, leading to a faster STIM2-mediated SOCE process so that partially emptied ER Ca2+ stores can be efficiently refilled via STIM2-activated SOCE. Individual numerical values underlying (A)–(F) may be found in S1 Data. 2-APB, 2-Aminoethoxydiphenyl borate; CC1, coiled-coil 1; CFP, cyan fluorescent protein; CRAC, Ca2+-release–activated Ca2+ current; EF-SAM, EF-hand and sterile alpha motif domain; ER, endoplasmic reticulum; FRET, Förster resonance energy transfer; HEK293, human embryonic kidney 293 cells; IONO, ionomycin; I–V, current–voltage; PM, plasma membrane; SAM, sterile alpha motif; SOAR, STIM-Orai–activating region; SOCE, store-operated Ca2+ entry; STIM, stromal interaction molecule; TG, thapsigargin; WT, wild type.

Similar articles

Cited by

References

    1. Prakriya M, Lewis RS. Store-Operated Calcium Channels. Physiol Rev. 2015;95(4):1383–436. Epub 2015/09/25. 10.1152/physrev.00020.2014 ; PubMed Central PMCID: PMC4600950. - DOI - PMC - PubMed
    1. Parekh AB, Putney JW Jr. Store-operated calcium channels. Physiol Rev. 2005;85(2):757–810. Epub 2005/03/25. doi: 85/2/757 [pii] 10.1152/physrev.00057.2003 . - DOI - PubMed
    1. Garrity AG, Wang W, Collier CM, Levey SA, Gao Q, Xu H. The endoplasmic reticulum, not the pH gradient, drives calcium refilling of lysosomes. Elife. 2016;5:e15887 Epub 2016/05/24. 10.7554/eLife.15887 ; PubMed Central PMCID: PMC4909396. - DOI - PMC - PubMed
    1. Amcheslavsky A, Wood ML, Yeromin AV, Parker I, Freites JA, Tobias DJ, et al. Molecular biophysics of Orai store-operated Ca2+ channels. Biophysical journal. 2015;108(2):237–46. Epub 2015/01/22. 10.1016/j.bpj.2014.11.3473 ; PubMed Central PMCID: PMC4302196. - DOI - PMC - PubMed
    1. Soboloff J, Rothberg BS, Madesh M, Gill DL. STIM proteins: dynamic calcium signal transducers. Nat Rev Mol Cell Biol. 2012;13(9):549–65. Epub 2012/08/24. 10.1038/nrm3414 [pii]. ; PubMed Central PMCID: PMC3458427. - DOI - PMC - PubMed

Publication types

MeSH terms