. 2018 Nov 16;13(11):e0207178.
doi: 10.1371/journal.pone.0207178. eCollection 2018.

Sensitivity of nasal airflow variables computed via computational fluid dynamics to the computed tomography segmentation threshold

Affiliations

Sensitivity of nasal airflow variables computed via computational fluid dynamics to the computed tomography segmentation threshold

Giancarlo B Cherobin et al. PLoS One. .

Abstract

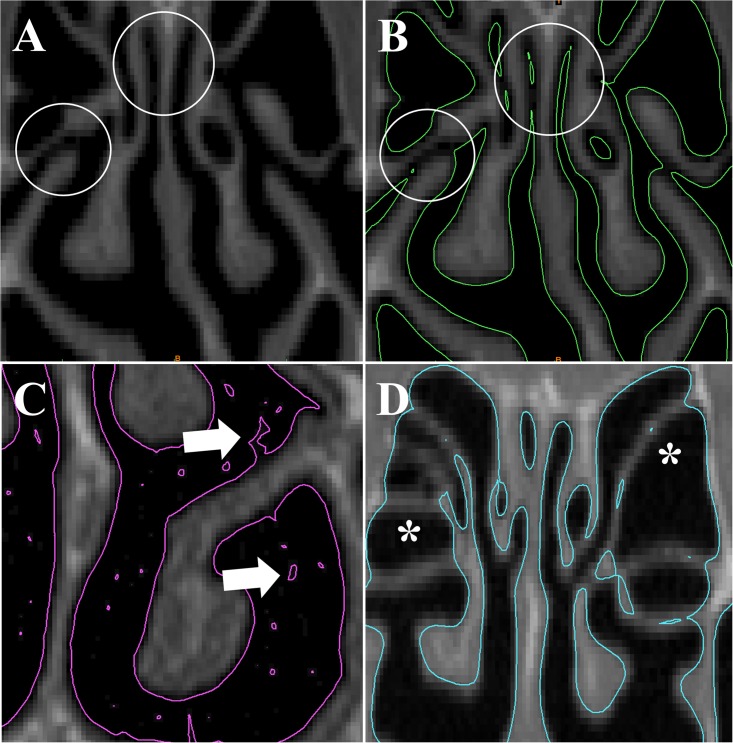
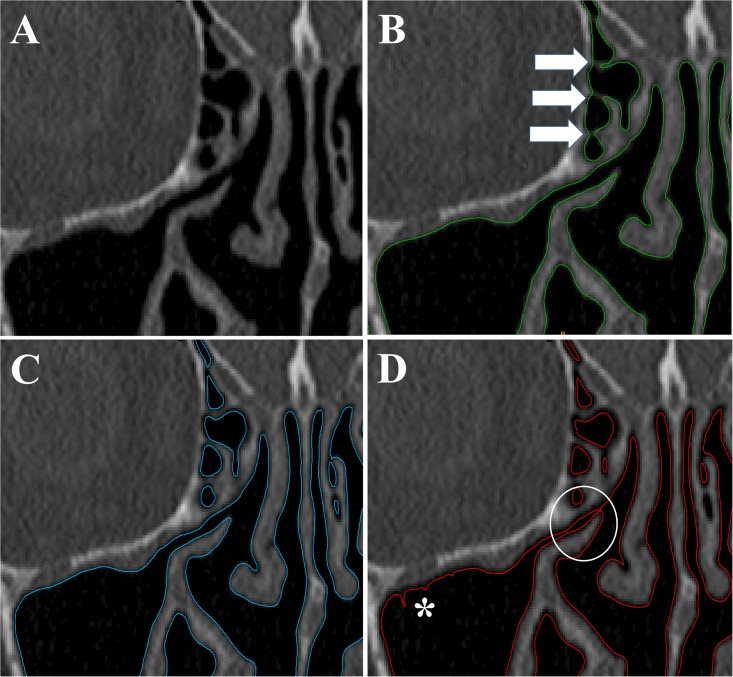
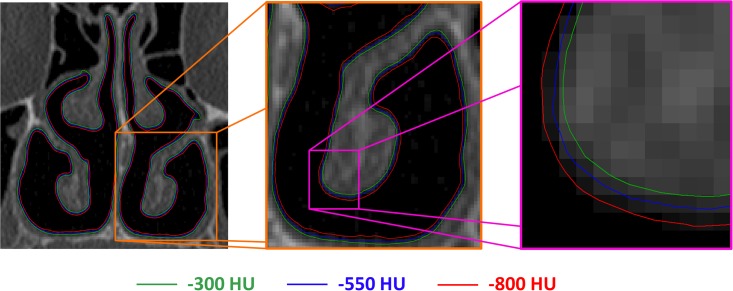
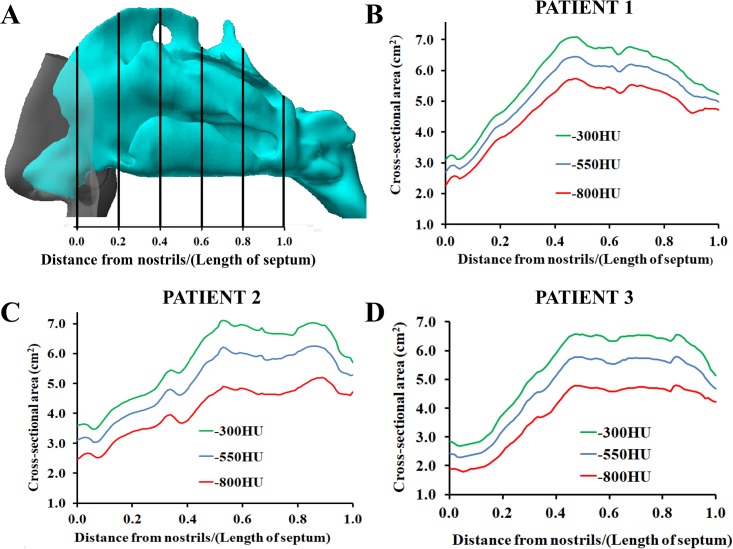
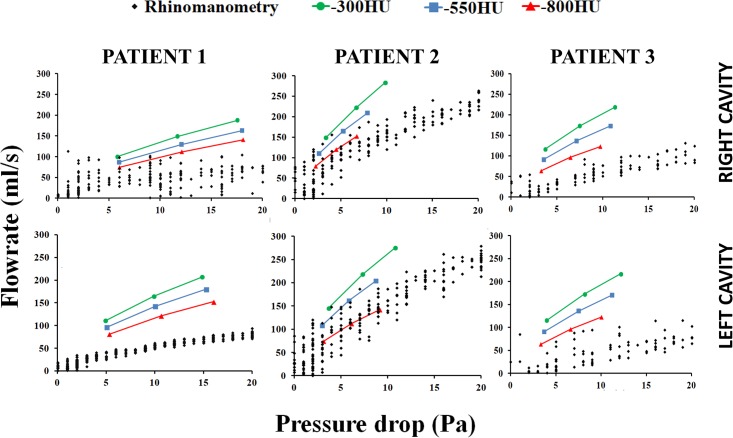
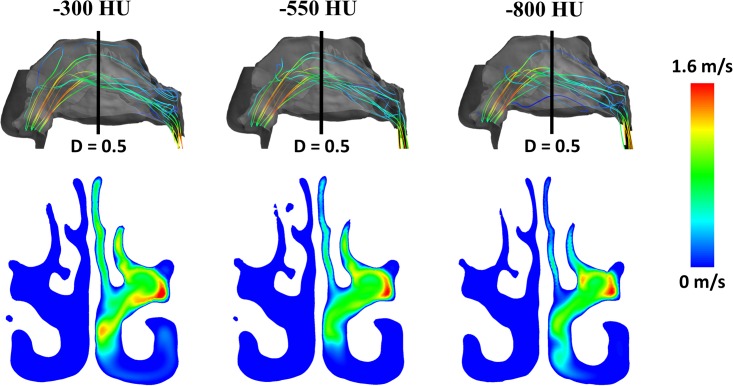
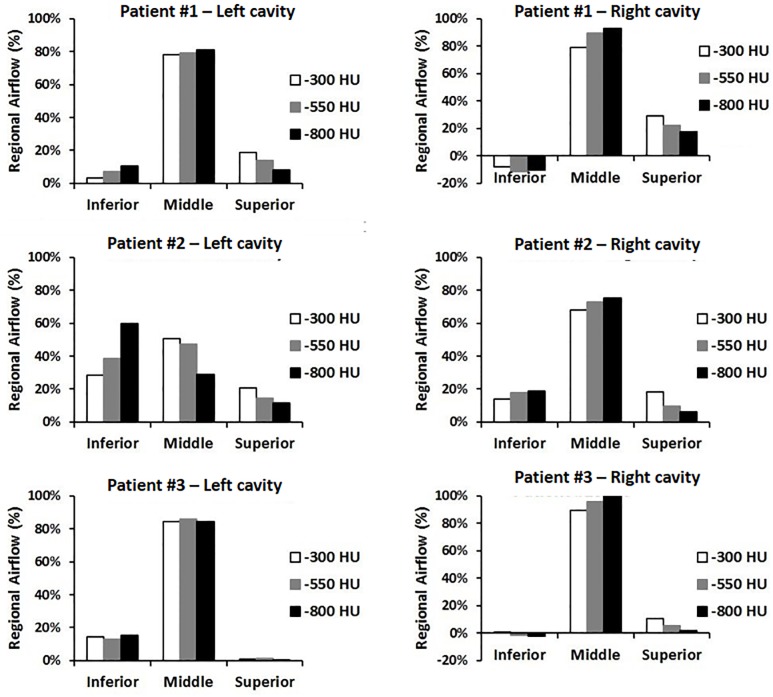
Computational fluid dynamics (CFD) allows quantitative assessment of transport phenomena in the human nasal cavity, including heat exchange, moisture transport, odorant uptake in the olfactory cleft, and regional delivery of pharmaceutical aerosols. The first step when applying CFD to investigate nasal airflow is to create a 3-dimensional reconstruction of the nasal anatomy from computed tomography (CT) scans or magnetic resonance images (MRI). However, a method to identify the exact location of the air-tissue boundary from CT scans or MRI is currently lacking. This introduces some uncertainty in the nasal cavity geometry. The radiodensity threshold for segmentation of the nasal airways has received little attention in the CFD literature. The goal of this study is to quantify how uncertainty in the segmentation threshold impacts CFD simulations of transport phenomena in the human nasal cavity. Three patients with nasal airway obstruction were included in the analysis. Pre-surgery CT scans were obtained after mucosal decongestion with oxymetazoline. For each patient, the nasal anatomy was reconstructed using three different thresholds in Hounsfield units (-800HU, -550HU, and -300HU). Our results demonstrate that some CFD variables (pressure drop, flowrate, airflow resistance) and anatomic variables (airspace cross-sectional area and volume) are strongly dependent on the segmentation threshold, while other CFD variables (intranasal flow distribution, surface area) are less sensitive to the segmentation threshold. These findings suggest that identification of an optimal threshold for segmentation of the nasal airway from CT scans will be important for good agreement between in vivo measurements and patient-specific CFD simulations of transport phenomena in the nasal cavity, particularly for processes sensitive to the transnasal pressure drop. We recommend that future CFD studies should always report the segmentation threshold used to reconstruct the nasal anatomy.


Conflict of interest statement

The authors have declared that no competing interests exist.

Figures

Fig 1
Fig 1. Common artifacts observed when segmenting the nasal cavity from CT scans.
(A) Coronal CT of patient #2 shows a patent ostiomeatal complex and a patent olfactory cleft (circles). (B) Contours of 3D reconstruction created with thresholding range -1024HU to -950HU show discontinuities in the airspace (circles). (C) In patient #1, the 3D reconstruction created with the same thresholding range has surface irregularities and noise (arrows). (D) In patient #3, the 3D model created using the thresholding range -1024HU to -200HU did not segment the walls of the ethmoid sinuses correctly.
Fig 2
Fig 2. Effects of segmentation threshold on 3D reconstruction of the nasal cavity.
A wide range of segmentation thresholds (namely -800HU to -300HU) provides acceptable 3D reconstructions of the human nasal cavity. (A) Coronal CT of patient #1 after mucosal decongestion showing the middle turbinate, ethmoid sinuses, and part of the right maxillary sinus. (B,C,D) Contours of 3D models created using three different thresholds (-300 HU, -550 HU and, -800 HU). At the upper limit of acceptable thresholds (-300 HU, panel B), thin soft tissue walls are incorrectly identified as air (arrows). At the center of the range (-550 HU, panel C), a good 3D reconstruction is obtained with few or no artifacts. At the lower limit of acceptable thresholds (-800HU, panel D), narrow passages become partially or completely obstructed (circle) and irregularities appears at air-tissue boundary (asterisk).
Fig 3
Fig 3. Outline of 3D reconstructions obtained with three different thresholds.
Coronal CT scan of patient #1 showing the outlines of the 3D reconstructions created with segmentation thresholds -300 HU (green), -550 HU (blue), and -800 HU (red). The close-up view (right-side panel) reveals a nearly uniform distance of 1 to 2 pixels between the models created with segmentation thresholds -300 HU and -800 HU.
Fig 4
Fig 4. Airspace cross-sectional areas after mucosal decongestion with Oxmetazoline as a function of distance from nostrils.
(A) Definition of the relative distance from nostrils. (B,C,D) In all three patients, the airspace cross-sectional area increased systematically throughout the nasal cavity as the segmentation threshold was increased from -800HU to -300HU.
Fig 5
Fig 5. Flow-pressure curve measured with rhinomanometry and calculated with CFD in 3D models reconstructed with segmentation thresholds of -300HU, -550HU, and -800HU.
Note the systematic increase in nasal airflow (reduction in nasal resistance) as the segmentation threshold increases from -800HU to -300HU.
Fig 6
Fig 6. Inspiratory streamlines (top) and air velocity colormap at coronal section D = 0.5 (bottom).
The main air stream flowed near the middle turbinate in patient #1 independently of the segmentation threshold (-300HU, -550HU, and -800HU). The right nostril was assumed to be blocked to reproduce rhinomanometry measurements of unilateral resistance in the left cavity (see text for details).
Fig 7
Fig 7. The coronal section D = 0.5 was divided in three regions (inferior, middle, superior) for the analysis of intranasal airflow distribution.
The left and right cavities were analyzed independently. Each region corresponded to 1/3 of the nasal height. The inferior region corresponds to the nasal floor and the lower portion of the inferior turbinate. The middle region corresponds to the area surrounding the lower portion of the middle turbinate. The superior region corresponds to the olfactory cleft and upper portion of the middle meatus.
Fig 8
Fig 8. Intranasal airflow distribution at coronal section D = 0.5.
In most nasal cavities, the middle region was the main airflow pathway. Intranasal airflow distribution was nearly independent of the segmentation threshold. Negative values correspond to regions of retrograde flow.

Similar articles

Cited by

References

    1. Elad D, Wolf M, Keck T. Air-conditioning in the human nasal cavity. Respir Physiol Neurobiol. 2008;163(1–3):121–7. Epub 2008/06/21. 10.1016/j.resp.2008.05.002 . - DOI - PubMed
    1. Garcia GJ, Rhee JS, Senior BA, Kimbell JS. Septal deviation and nasal resistance: an investigation using virtual surgery and computational fluid dynamics. Am J Rhinol Allergy. 2010;24(1):e46–53. Epub 2010/01/30. 10.2500/ajra.2010.24.3428 . - DOI - PubMed
    1. Zhao K, Scherer PW, Hajiloo SA, Dalton P. Effect of anatomy on human nasal air flow and odorant transport patterns: implications for olfaction. Chem Senses. 2004;29(5):365–79. Epub 2004/06/18. 10.1093/chemse/bjh033 . - DOI - PubMed
    1. Garcia GJM, Schroeter JD, Kimbell JS. Olfactory deposition of inhaled nanoparticles in humans. Inhalation Toxicology. 2015;27(8):394–403. 10.3109/08958378.2015.1066904 . - DOI - PMC - PubMed
    1. Schroeter JD, Garcia GJM, Kimbell JS. Effects of surface smoothness on inertial particle deposition in human nasal models. J Aerosol Sci. 2011;42(1):52–63. 10.1016/j.jaerosci.2010.11.002 - DOI - PMC - PubMed

Publication types