. 2018 Nov 15;175(5):1321-1335.e20.
doi: 10.1016/j.cell.2018.10.015.

Food Perception Primes Hepatic ER Homeostasis via Melanocortin-Dependent Control of mTOR Activation

Affiliations

Food Perception Primes Hepatic ER Homeostasis via Melanocortin-Dependent Control of mTOR Activation

Claus Brandt et al. Cell. .

Abstract

Adaptation of liver to the postprandial state requires coordinated regulation of protein synthesis and folding aligned with changes in lipid metabolism. Here we demonstrate that sensory food perception is sufficient to elicit early activation of hepatic mTOR signaling, Xbp1 splicing, increased expression of ER-stress genes, and phosphatidylcholine synthesis, which translate into a rapid morphological ER remodeling. These responses overlap with those activated during refeeding, where they are maintained and constantly increased upon nutrient supply. Sensory food perception activates POMC neurons in the hypothalamus, optogenetic activation of POMC neurons activates hepatic mTOR signaling and Xbp1 splicing, whereas lack of MC4R expression attenuates these responses to sensory food perception. Chemogenetic POMC-neuron activation promotes sympathetic nerve activity (SNA) subserving the liver, and norepinephrine evokes the same responses in hepatocytes in vitro and in liver in vivo as observed upon sensory food perception. Collectively, our experiments unravel that sensory food perception coordinately primes postprandial liver ER adaption through a melanocortin-SNA-mTOR-Xbp1s axis. VIDEO ABSTRACT.


Conflict of interest statement

DECLARATION OF INTERESTS

The authors declare no competing interests.

Figures

Figure 1.
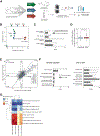
Figure 1.. Food Perception Activates an ER-Stress Gene-Expression Signature in Liver
(A) Experimental set-up and workflow. (B) PC-analysis sample plot of all the time points. (C) Bar plot representing the number of significantly changed transcripts at a FDR < 5% and Log2-fold > 1. (D) Point plot showing the averaged Log2 ratiowith 95% confidence interval (CI) compared tofasted micefortranscripts assigned tothe indicated GO terms. Line plots visualize the time profiles of individual genes. (E) Verification ofgenes byquantitative real-time PCR; mean indicated by a horizontal line, and data represented as boxplots with individual values (n = 6 animals/ group) relative to hprt expression. (F) Xbp1 mRNA expression following refeeding or caged food presentation (n = 10–11 animals/group) relative to hprt expression. (G) Xbp1 splicing assay showing the PCR products of Xbp1(u) and Xbp1(s) (n = 3/group). Statistical analysis: (D) mean ± 95% CI. (E and F); *p < 0.05, **p < 0.01, and ***p < 0.001; one-wayANOVAfollowed by Dunnet’s multiple comparisonstest. Data in (E) and (F): Box-whisker plots with upper and lower quartile, median, the minimum and maximum values, and all individual data points
Figure 2.
Figure 2.. Sensory Food Perception Activates Hepatic mTOR Signaling
(A) Workflow of SILAC-based phosphoproteomics. (B) PC analysis plot. (C) Gene Ontology-Restricted analysis of the whole data. Identified enriched Gene Ontology terms determined by Fisher’s exact test comparing significantly regulated phosphorylation sites to the complete dataset. p values were corrected by the Benjamini-Hochberg procedure. (D) Boxplot showing the distribution of phosphorylation sites displaying an Akt substrate motif (RXRXX (S/T)). (E) Scatterplot of the Log2 ratios of fasted/refed versus caged food/fasted. (F) Fisher’s exact test results represented in a bar chart showing significantly enriched Gene Ontology terms and kinase motifs in the group of phosphorylation sites that were either similarly or exclusively regulated. (G) Heatmap of a 2D annotation enrichment analysis combining the 30 min time point of the RNA-seq data and the 30 min time point of the phosphoproteomics data (FDR < 0.02).
Figure 3.
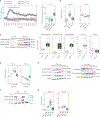
Figure 3.. Food Perception-Induced Xbp1 Splicing Is Attenuated upon mTOR Inhibition
(A) Representative western blots using liver extracts from fasted mice or those refed or caged-food exposed for 5 min, showing pmTOR (Ser2448), pAkt (Ser473), pP70S6K (Thr389), pS6 (Ser235/236), (Ser240/244), and the corresponding beta-actin loading control. (B) Same as in (A) with the exception that mice were refed or exposed to caged food for 10 min (n = 6 mice/condition). See Figure S6 for western blots of total proteins. (C) Representative western blots using liver extracts from Rapamycin-treated mice that were fasted or refed or exposed to caged food for 30 min. Full blots used for quantification are represented in Figure S6. (D) Quantification of pP70S6K (Thr389) and pS6 (Ser235/236) as assessed by western blots and Xbp1(u) and Xbp1(s) expression as assessed by qPCR in liver of mice exposed to caged food or refed with or without rapamycin administration (n = 10 mice/condition). See Figure S6 for all western blots used for quantification. Statiscal analysis: *p < 0.05, **p < 0.01, and ***p <0.001; One-way ANOVA followed by Dunnet’s multiple comparisons test in (A)-(C); in (D), two-way ANOVA followed by Sidak’s multiple comparisons test. Data presented as box plots. See also Figures S3 and S6.
Figure 4.
Figure 4.. Food Perception Promotes Hepatic Phosphatidylcholine Synthesis
(A) Workflow for determination of lipid signatures by LC-MS. (B) Histogram showing the descriptive power (DP) and number of annotated compounds. (C) Lipid class distribution showing numbers within each lipid class. (D) PC-analysis sample plot of all lipids. (E) PC-analysis sample plot considering only the class of phosphatidylcholines. (F) PCA drivers of phosphatidylcholines—chain length is color encoded, and the number of double bounds is represented by the scatter point size. (G and H) PC-analysis sample plots of diacylglycerols and phosphatidylethanolamines.
Figure 5.
Figure 5.. Food Perception RapidlyActivates POMC Neurons
(A) Confocal imagesshowing Cre-dependent, virally mediated expression of GCaMP6s by immunohistochemistry(GFP; green), Pomc (magenta), and Agrp (blue) mRNA expression as assessed by FISH as well as fiber placement. (B) Ca2+ responses to faked food, caged food, or accessible food presentation in POMC neurons in fasted mice expressing GCaMP6s or GFP. Areas underthe curve (AUC) of the individual mice (n = 3) are shown. Arrows indicate the time points of the respective food stimulus. (C) Representative images of Pomc and Fos mRNA expression in the ARC of fasted, fake-food-exposed, caged-food-exposed, or refed mice (30 min) (n = 4/each group). (D) Top left, quantification of Fos/Pomc mRNA-expressing cells. Top right, spliced Xbp1(s) in liverfrom the same mice (n = 4; forthe fasted group n = 3). Bottom, Spearman correlation between Fos-positive POMC neurons in the ARC and Xbp1(s) in the livers from the same animals. Statistical analysis: (B and D) *p < 0.05, **p < 0.01, One-way ANOVA followed by Dunnet’s multiple comparisons test. Data in (B) are individual values and in (D) are Box-whisker plots.
Figure 6.
Figure 6.. POMC Neuron Activation Promotes Hepatic mTOR Signaling and Xbp1 Splicing
(A) Expression of ChR2 in POMC neurons as assessed by GFP and POMC immunohistochemistry as well as fiber placement. (B) Representative western blots for pP70S6K(Thr389) and pS6 (Ser235/236) from liver lysates of ChR2POMC and ChR2WT mice after photostimulation for 30 min. (C) Quantification of Xbp1(s) and Xbp1(u) mRNA in livers of ChR2POMC and ChR2WT mice after photostimulation. Western blot analysis for pS6(Ser235/236) and pP70S6K(Thr389) (n = 7 mice/group). See Figure S6 for all western blots used for quantification and additional loading controls. (D) Representative western blots for pS6 (Ser235/236) in livers of fasted, exposed to caged food, or refed (30 min) control and MC4R-deficient mice. Lower panel shows the quantification of results obtained under the same conditions (n = 6–8 mice/group). See Figure S6 for all western blots used for quantification. (E) Analysis of hepatic Xbp1(s) and Xbp1(u) expression in livers of the same mice as analyzed in (D). Statistical analysis: (C) *p < 0.05 and **p < 0.01 indicate significantly different from ChR2WT group by unpaired two-sided Student’s t test. (D) *p < 0.05 and **p < 0.01; two-way ANOVA followed by Sidak’s multiple comparisons test. (E) *p < 0.05 and **p < 0.01; one-way ANOVA followed by Dunnet’s multiple comparisons test. In (C)–(E), data are presented as box plots.
Figure 7.
Figure 7.. Norepinephrine Activates mTOR Signaling and Xbp1 Splicing in Liver
(A) Changes in hepatic SNA after intravenous (i.v.) administration of CNO (3 mg/kg) or vehicle in hM3DqPOMC mice (n = 6) or hM3DqWT control mice (n = 7). Data are presented as mean with 95% CI. (B) mRNA expression (qPCR) of Xbp1(s) and Xbp1(u) in liver of mice fasted for 16 hr followed by intraperitoneal (i.p.) administration of either saline or alpha1- adrenergic receptor blocker (Alphal, Prazosin) followed by a second i.p. administration (30 min later) of saline or NE. (C) Western blots of pmTOR(Ser2448), pP70S6K(Thr389), and pS6(Ser235/236) and loading control (Calnexin). mRNA expression of Xbp1(s) and Xbp1(u) in fasted hM3DqAlfp and hM3DqWT control mice sacrificed 30 min after CNO (3 mg/kg) i.p. administration (n = 5 for hM3DqWT and n = 8 for hM3DqAlfp). See Figure S6 for additional loading controls. (D) Xbp1(s) and Xbp1(u) expression in Hepa1–6 cells treated with 10 μM NE for the indicated times. (E) Representative western blots from Hepa1–6 cells treated with 10 μM NE for different periods. (F) Representative western blots of Hepa1–6 cells pre-treated with 100 nM rapamycin for 30 min followed by 10 μM NE for 30 min. (G) Xbp1(s) and Xbp1(u) expression from Hepa1–6 cells pre-treated with 20 nM rapamycin for 30 min followed by 10 μM NE administration for 30 min. Statistical analysis: (A) Left: **p < 0.01 and ***p < 0.001; two-way ANOVAfollowed by Turkey’s multiple comparisons test. Right (AUC): **p < 0.01 and ***p < 0.001; one-way ANOVA followed by Turkey’s multiple comparisons test. (B) *p < 0.05 from (Sal/Sal) and §p < 0.05 from (Sal/Alpha1); one-way ANOVA followed by Turkey’s multiple comparisons test. (C) **p < 0.01 and ***p < 0.001; unpaired two-sided Student’s t test. (D and G) *p < 0.05 and **p < 0.01; one-way ANOVA followed by Dunnet’s multiple comparisons test. (A): Data on the left are presented as mean ± 95% confidence intervals; (A, right), (B), (C), (D), and (G): Data are presented as box plots. See also Figures S5 and S6.

Comment in

Similar articles

Cited by

References

    1. Ahrén B, and Holst JJ (2001). The cephalic insulin response to meal ingestion in humans is dependent on both cholinergic and noncholinergic mechanisms and is important for postprandial glycemia. Diabetes 50, 1030–1038. - PubMed
    1. Balch WE, Morimoto RI, Dillin A, and Kelly JW (2008). Adapting proteo-stasis for disease intervention. Science 319, 916–919. - PubMed
    1. Balthasar N, Coppari R, McMinn J, Liu SM, Lee CE, Tang V, Kenny CD, McGovern RA, Chua SC Jr., Elmquist JK, and Lowell BB (2004). Leptin receptor signaling in POMC neurons is required for normal body weight homeostasis. Neuron 42, 983–991. - PubMed
    1. Belgardt BF, and Brüning JC (2010). CNS leptin and insulin action in the control of energy homeostasis. Ann. N Y Acad. Sci. 1212, 97–113. - PubMed
    1. Bell BB, Harlan SM, Morgan DA, Guo DF, and Rahmouni K (2018). Differential contribution of POMC and AgRP neurons to the regulation of regional autonomic nerve activity by leptin. Mol. Metab. 8, 1–12. - PMC - PubMed

Publication types

MeSH terms