. 2018 Nov 1;76(8):fty082.
doi: 10.1093/femspd/fty082.

Listeriolysin O-dependent host surfaceome remodeling modulates Listeria monocytogenes invasion

Affiliations

Listeriolysin O-dependent host surfaceome remodeling modulates Listeria monocytogenes invasion

Andreas Kühbacher et al. Pathog Dis. .

Abstract

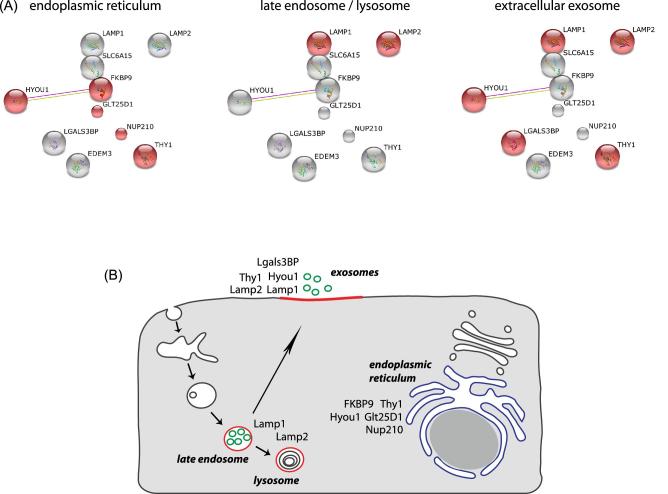
Listeria monocytogenes is a pathogenic bacterium that invades epithelial cells by activating host signaling cascades, which promote bacterial engulfment within a phagosome. The pore-forming toxin listeriolysin O (LLO), which is required for bacteria phagosomal escape, has also been associated with the activation of several signaling pathways when secreted by extracellular bacteria, including Ca2+ influx and promotion of L. monocytogenes entry. Quantitative host surfaceome analysis revealed significant quantitative remodeling of a defined set of cell surface glycoproteins upon LLO treatment, including a subset previously identified to play a role in the L. monocytogenes infection process. Our data further shows that the lysosomal-associated membrane proteins LAMP-1 and LAMP-2 are translocated to the cellular surface and those LLO-induced Ca2+ fluxes are required to trigger the surface relocalization of LAMP-1. Finally, we identify late endosomes/lysosomes as the major donor compartments of LAMP-1 upon LLO treatment and by perturbing their function, we suggest that these organelles participate in L. monocytogenes invasion.


Figures

Figure 1.
Figure 1.
Changes of the cell surface proteome after LLO treatment A, HeLa cells were treated with 1nM LLO or medium only for 20 min. Subsequently cells were detached and processed for cell surface capturing of glycoproteins followed by mass spectrometry-based proteomics analysis. The log2 fold change and adjusted P-value of differentially changed protein cell surface expression are shown. Tests for differential expression were performed using a linear mixed model and P-values were adjusted using Benjamini and Hochberg method. B, Log2 fold change of significantly enriched and depleted proteins at the cell surface (black bars, all panels) and the corresponding Z-score of infection from previously published genome-wide siRNA screens (white bars, left and center panels). Proteins are divided in four categories: (i) increased cell surface enrichment and positive Z-score; (ii) decreased cell surface exposure and negative Z-score; (iii) increased cell surface enrichment and negative Z-score and (iv) decreased cell surface exposure and positive Z-score. The right panel shows molecules which display significant changes at the cell surface distribution but which were not present in our previous siRNA screen. Dotted line: + 1 and -1 Z-score limit.
Figure 2.
Figure 2.
Assignment of translocated proteins to cellular components. A, String network (stringency: 0.4) of significantly enriched cell surface proteins upon LLO treatment. Proteins belonging to the indicated cellular components are highlighted in red. B, Schematic representation of a human cell indicating the proteins signifcantly enriched at the cell surface upon LLO treatment, and the cellular components to which these proteins are associated.
Figure 3.
Figure 3.
Translocation of late endosomal/lysosomal compartments to the cell surface in response to LLO. A, Cells grown on glass coverslips in a 24 well plate were treated for 20 min with 1 nM LLO. Subsequently, cells were fixed and immunostained for extracellular LAMP-1 and for DNA using Dapi after permeabilization Bar: 10 μm (magnification bar: 1 μm). B, HeLa cells were treated with 1 nM LLO or LLOW492A (binds to cells but is not able to form pores) for different time intervals (right), or were treated independently with different concentrations of LLO or LLOW492A for 20 min (left). Subsequently, cells were detached, fixed and stained for LAMP-1 or LAMP-2 in the absence of cell permeabilization. Fluorescence was measured by flow cytometry and values are given as fold change of the geometric mean of the fluorescent signal, compared to non-treated cells. Results represent the average of at least three independent experiments + /- standard error of the mean. C, HeLa cells transfected with EGFP-LAMP-1 were grown for 24 h in 35 mm imaging dishes. Dishes were then transferred to a 37°C pre-warmed microscope in a 5% CO2-containing atmosphere and image stacks were taken before and after addition of LLO to a final concentration of 1 nM. The boxed region in the upper panels is enlarged in the lower panels. Bar: 1 μm. D, HeLa cells were pretreated for 20 min with 20mM HEPES or 10 mM EGTA and 20mM HEPES and subsequently left untreated or treated for 20 min with 1 nM LLO in the presence of the different pretreatments. Following this, cells were detached, fixed and fluorescently stained for surface accessible LAMP-1 in the absence of permeabilization. The fluorescent signal was measured by flow cytometry. Geometric mean of fluorescence intensity was normalized to the average of all samples. Bars represent the average and geometric mean of three independent experiments (Student's t-test: *, < 0.05). E, HeLa cells were treated with 1 nM LLO for 20 min and the β-hexosaminidase activity in the cellular supernatant (and cell lysates) was measured fluorometrically. Values represent the fold change of the ratio of β-hexosaminidase activity of supernatants/cell lysates. Results show the average of three independent experiments relative to the mock control + /- SEM. F, Exosomes were purified from the supernatant of control and LLO-treated cells by ultracentrifugation, seeded on glass coverslips, fixed, stained for CD63 and quantified by microscopy. Bars represent the mean and standard deviation of six visual fields of a representative experiment.
Figure 4.
Figure 4.
Late endosomes/lysosomes fuse with the plasma membrane at the L. monocytogenes entry site during invasion. A, HeLa cells grown on coverslips were infected with L. monocytogenes EGDe.PrfA* for 20 min. To synchronize infection cells were centrifuged for 5 min at room temperature after inoculation. Cells were then fixed, stained for extracellular LAMP-1 and then permeabilized and stained for DNA allowing to visualize total bacteria using Dapi. The arrow points towards a group of LAMP-1 positive bacteria Bar: 10 μm (magnification bar: 1 μm). B, Cells were infected as in A and stained for extracellular LAMP-1 and extracellular bacteria without permeabilization. Subsequently cells were permeabilized and stained for total DNA. The arrow points towards a LAMP-1-positive extracellular L. monocytogenes in the process of cell invasion. Bar: 10 μm (magnification bar: 1 μm). C, HeLa cells grown on 35 mm imaging dishes and transfected with EGFP-LAMP-1 were infected with L. monocytogenes EGDe.PrfA* and centrifuged for 5 min at room temperature to synchronize infection before image acquisition in a spinning disk microscope at 37°C. Upper panel: phase contrast channel; lower panel: GFP channel. Arrows point to LAMP-1-positive vesicles that associate with- and seemingly fuse with the L. monocytogenes-containing vacuole during the course of bacterial invasion. Bar: 1 μm. D, HeLa cells were pretreated for 20 min with 20mM HEPES or 10 mM EGTA and 20mM HEPES and left uninfected or infected for 20 min with L. monocytogenes EGDe.PrfA* in the presence of the different treatments. Following this, cells were detached, fixed and fluorescently stained for surface accessible LAMP-1 in the absence of permeabilization. The fluorescent signal was measured by flow cytometry. Geometric mean of fluorescence intensity was normalized to the average of all samples. Bars represent the mean and SEM of three independent experiments.
Figure 5.
Figure 5.
Perturbation of late endosomal/lysosomal compartments blocks LAMP-1 translocation and reduces L. monocytogenes invasion. HeLa cells were let untreated or were incubated with 5 mg/ml HRP for 1.5 h followed by 30 min of chase in the absence of the enzyme and 30 min of lysosomal/late endosomal cross-linking by DAB/H2O2 exposure on ice. Cells were then treated with mock DMEM or treated with 1 nM LLO in DMEM for 20 min (A) or infected for 20 min with L. monocytogenes EGDe.PrfA* (B). After fixation cells were stained for LAMP-1 and analyzed by flow cytometry. Geometric mean of fluorescence intensity was normalized to the average of all samples. Mean and SEM of three independent experiments are presented (Student's t-test: *, < 0.05). C, Cells treated with HRP and DAB/H2O2 (as in A and B) were infected with L. monocytogenes EGDe.PrfA* for 40 min and extracellular bacteria were stained differentially (A). Results represent the average intracellular bacteria (% of total) + /- standard error of the mean (Student's t-test: ***, < 0.001).

Similar articles

Cited by

References

    1. Bierne H, Gouin E, Roux P et al. . A role for cofilin and LIM kinase in Listeria-induced phagocytosis. J Cell Biol 2001;155:101–12. - PMC - PubMed
    1. Bierne H, Miki H, Innocenti M et al. . WASP-related proteins, Abi1 and Ena/VASP are required for Listeria invasion induced by the Met receptor. J Cell Sci 2005;118:1537–47. - PubMed
    1. Bonazzi M, Kühbacher A, Toledo-Arana A et al. . A common Clathrin-mediated machinery co-ordinates cell-cell adhesion and bacterial internalization. Traffic 2012;13:1653–66. - PMC - PubMed
    1. Bonazzi M, Vasudevan L, Mallet A et al. . Clathrin phosphorylation is required for actin recruitment at sites of bacterial adhesion and internalization. J Cell Biol 2011;195:525–36. - PMC - PubMed
    1. Braun V, Deschamps C, Raposo G et al. . AP-1 and ARF1 control endosomal dynamics at sites of FcR–mediated phagocytosis. MBoC 2007;18:4921–31. - PMC - PubMed

Publication types