

Pair Matcher (PaM): fast model-based optimization of treatment/case-control matches
- PMID: 30445488
- PMCID: PMC6596890
- DOI: 10.1093/bioinformatics/bty946
Pair Matcher (PaM): fast model-based optimization of treatment/case-control matches
Abstract
Motivation: In clinical trials, individuals are matched using demographic criteria, paired and then randomly assigned to treatment and control groups to determine a drug's efficacy. A chief cause for the irreproducibility of results across pilot to Phase-III trials is population stratification bias caused by the uneven distribution of ancestries in the treatment and control groups.
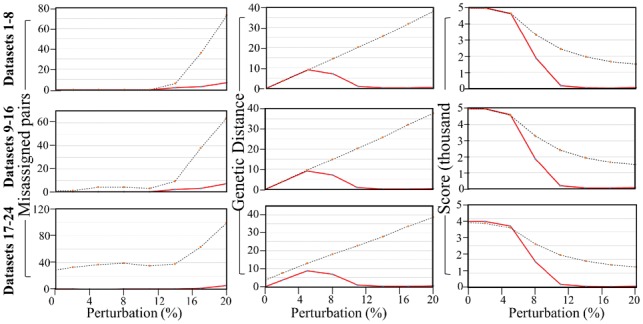
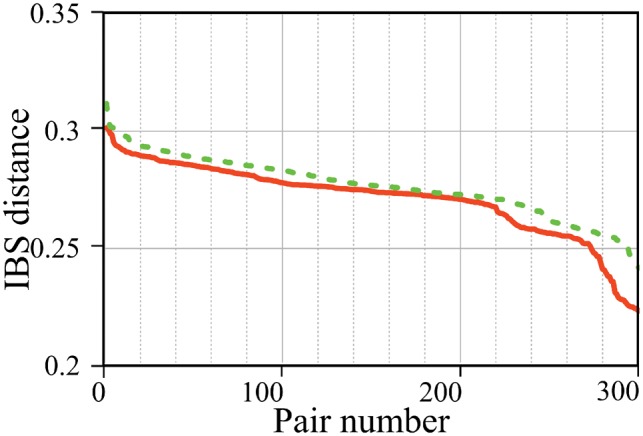
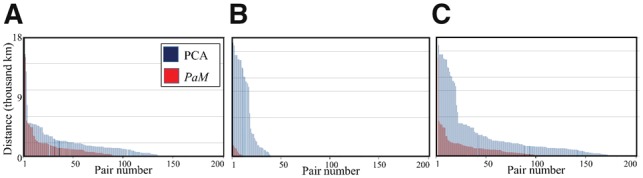
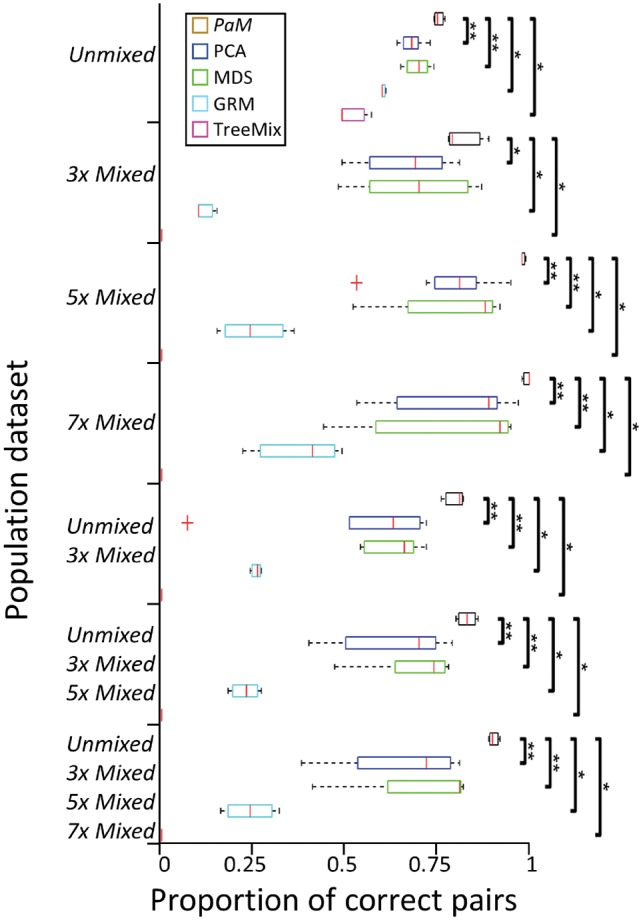
Results: Pair Matcher (PaM) addresses stratification bias by optimizing pairing assignments a priori and/or a posteriori to the trial using both genetic and demographic criteria. Using simulated and real datasets, we show that PaM identifies ideal and near-ideal pairs that are more genetically homogeneous than those identified based on competing methods, including the commonly used principal component analysis (PCA). Homogenizing the treatment (or case) and control groups can be expected to improve the accuracy and reproducibility of the trial or genetic study. PaM's ancestral inferences also allow characterizing responders and developing a precision medicine approach to treatment.
Availability and implementation: PaM is freely available via Rhttps://github.com/eelhaik/PAM and a web-interface at http://elhaik-matcher.sheffield.ac.uk/ElhaikLab/.
Supplementary information: Supplementary data are available at Bioinformatics online.
© The Author(s) 2018. Published by Oxford University Press.
Figures

Similar articles
-
Efficient toolkit implementing best practices for principal component analysis of population genetic data.Bioinformatics. 2020 Aug 15;36(16):4449-4457. doi: 10.1093/bioinformatics/btaa520. Bioinformatics. 2020. PMID: 32415959 Free PMC article.
-
Folic acid supplementation and malaria susceptibility and severity among people taking antifolate antimalarial drugs in endemic areas.Cochrane Database Syst Rev. 2022 Feb 1;2(2022):CD014217. doi: 10.1002/14651858.CD014217. Cochrane Database Syst Rev. 2022. PMID: 36321557 Free PMC article.
-
FlashPCA2: principal component analysis of Biobank-scale genotype datasets.Bioinformatics. 2017 Sep 1;33(17):2776-2778. doi: 10.1093/bioinformatics/btx299. Bioinformatics. 2017. PMID: 28475694
-
PCAmatchR: a flexible R package for optimal case-control matching using weighted principal components.Bioinformatics. 2021 May 23;37(8):1178-1181. doi: 10.1093/bioinformatics/btaa784. Bioinformatics. 2021. PMID: 32926120 Free PMC article.
-
AlgoRun: a Docker-based packaging system for platform-agnostic implemented algorithms.Bioinformatics. 2016 Aug 1;32(15):2396-8. doi: 10.1093/bioinformatics/btw120. Epub 2016 Mar 2. Bioinformatics. 2016. PMID: 27153722 Free PMC article.
Cited by
-
Principal Component Analyses (PCA)-based findings in population genetic studies are highly biased and must be reevaluated.Sci Rep. 2022 Aug 29;12(1):14683. doi: 10.1038/s41598-022-14395-4. Sci Rep. 2022. PMID: 36038559 Free PMC article.
-
Systems biology analysis of human genomes points to key pathways conferring spina bifida risk.Proc Natl Acad Sci U S A. 2021 Dec 21;118(51):e2106844118. doi: 10.1073/pnas.2106844118. Proc Natl Acad Sci U S A. 2021. PMID: 34916285 Free PMC article.
-
Population genetic considerations for using biobanks as international resources in the pandemic era and beyond.BMC Genomics. 2021 May 17;22(1):351. doi: 10.1186/s12864-021-07618-x. BMC Genomics. 2021. PMID: 34001009 Free PMC article. Review.
-
Unraveling the complex genetics of neural tube defects: From biological models to human genomics and back.Genesis. 2021 Nov;59(11):e23459. doi: 10.1002/dvg.23459. Epub 2021 Oct 29. Genesis. 2021. PMID: 34713546 Free PMC article. Review.
-
AncestryGeni: a novel genetic ancestry classification pipeline for small and noisy sequence data.Bioinformatics. 2025 Jul 1;41(7):btaf391. doi: 10.1093/bioinformatics/btaf391. Bioinformatics. 2025. PMID: 40627371 Free PMC article.
References
-
- Campbell C.D., et al. (2005) Demonstrating stratification in a European American population. Nat. Genet., 37, 868–872. - PubMed
Publication types
MeSH terms
Grants and funding
LinkOut - more resources
Full Text Sources
Miscellaneous
