. 2019 Feb 1;36(2):283-303.
doi: 10.1093/molbev/msy208.

The Genome Landscape of Tibetan Sheep Reveals Adaptive Introgression from Argali and the History of Early Human Settlements on the Qinghai-Tibetan Plateau

Affiliations

The Genome Landscape of Tibetan Sheep Reveals Adaptive Introgression from Argali and the History of Early Human Settlements on the Qinghai-Tibetan Plateau

Xiao-Ju Hu et al. Mol Biol Evol. .

Abstract

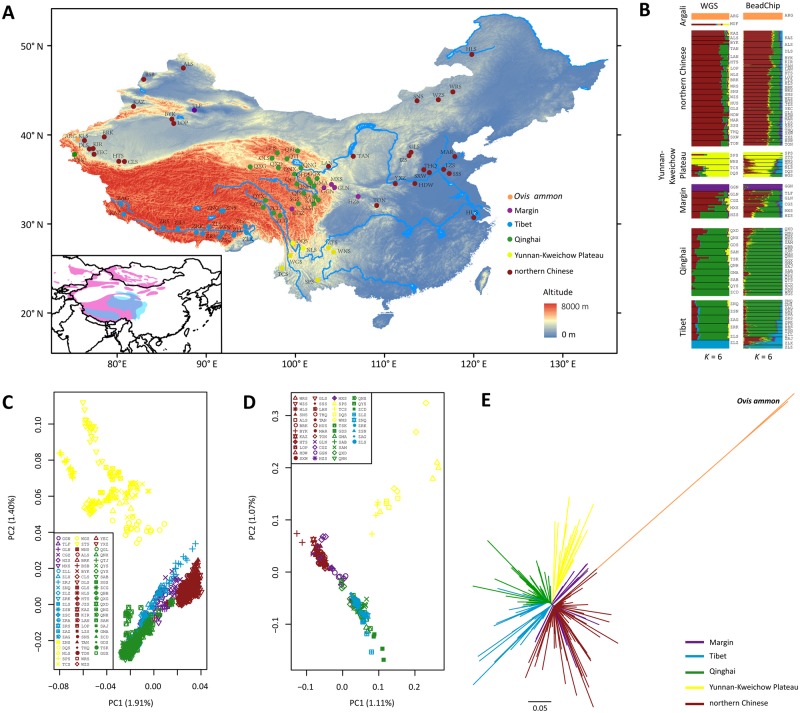
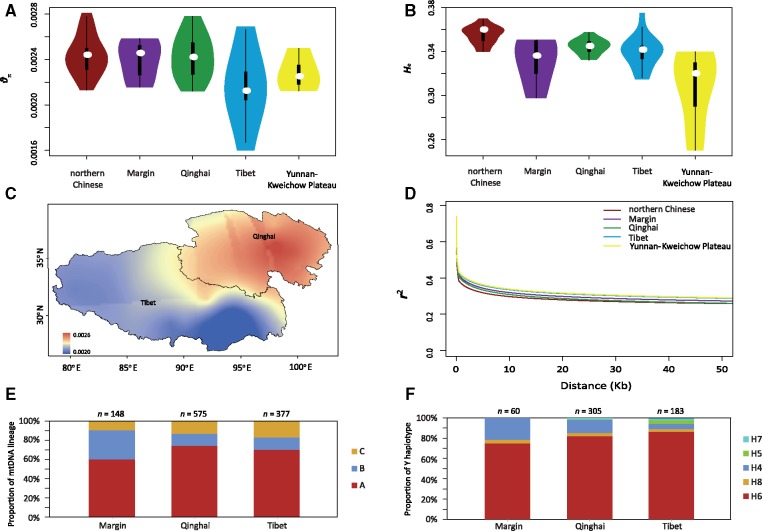
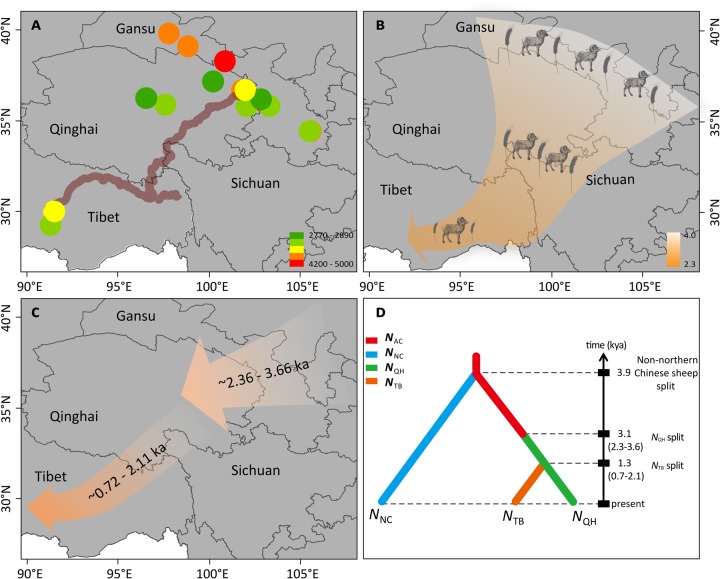
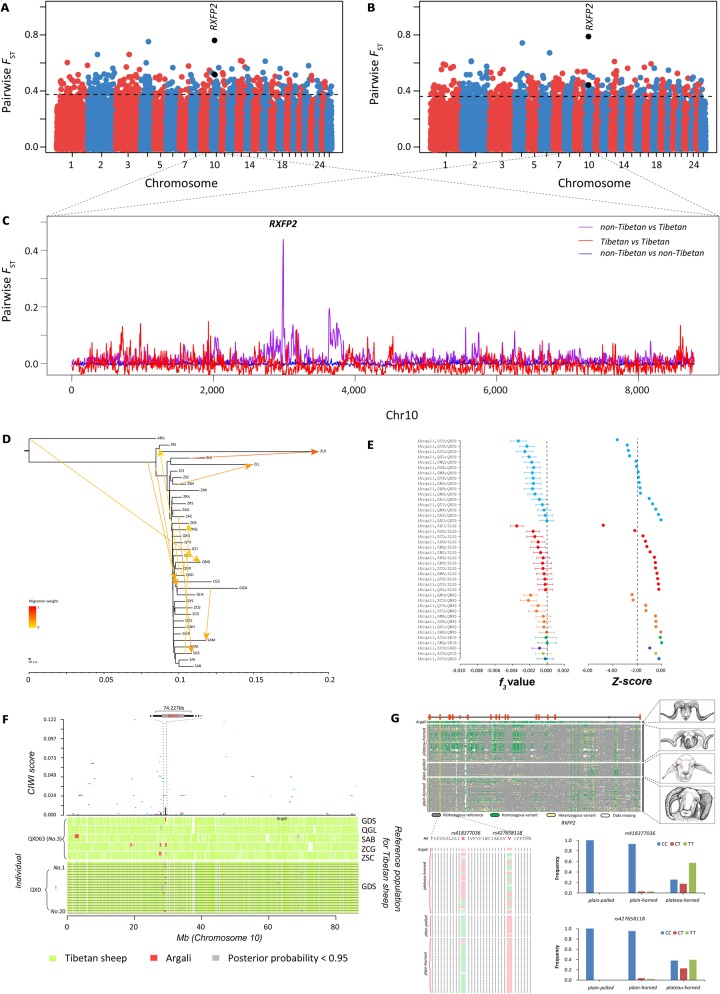
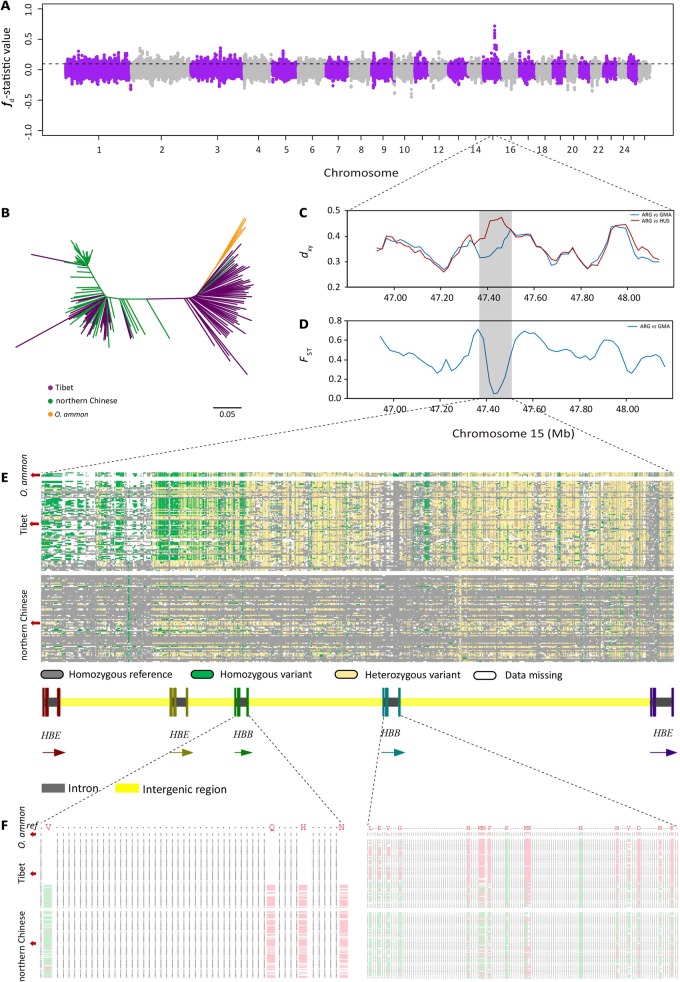
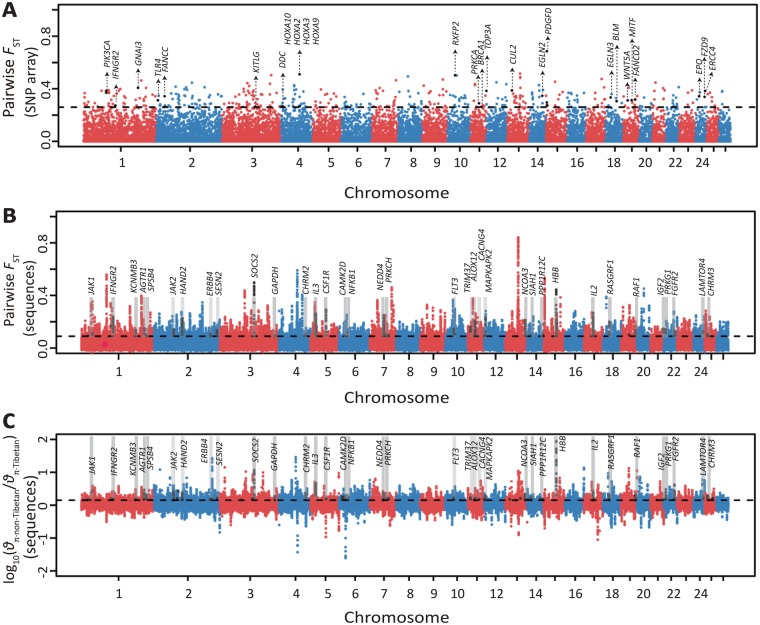
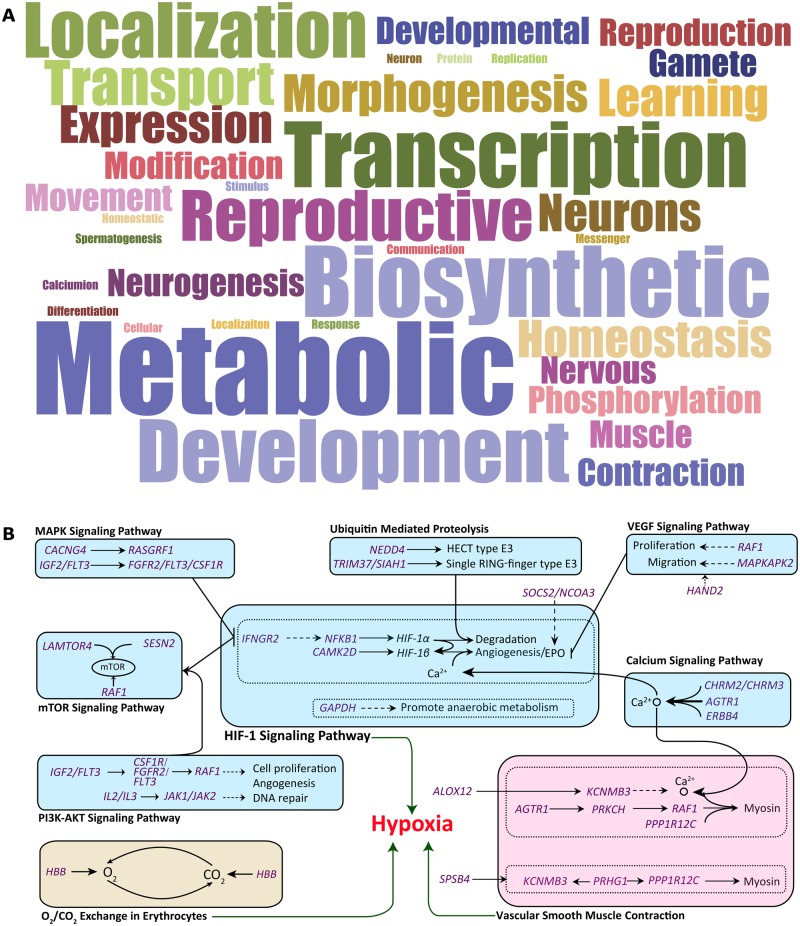
Tibetan sheep are the most common and widespread domesticated animals on the Qinghai-Tibetan Plateau (QTP) and have played an essential role in the permanent human occupation of this high-altitude region. However, the precise timing, route, and process of sheep pastoralism in the QTP region remain poorly established, and little is known about the underlying genomic changes that occurred during the process. Here, we investigate the genomic variation in Tibetan sheep using whole-genome sequences, single nucleotide polymorphism arrays, mitochondrial DNA, and Y-chromosomal variants in 986 samples throughout their distribution range. We detect strong signatures of selection in genes involved in the hypoxia and ultraviolet signaling pathways (e.g., HIF-1 pathway and HBB and MITF genes) and in genes associated with morphological traits such as horn size and shape (e.g., RXFP2). We identify clear signals of argali (Ovis ammon) introgression into sympatric Tibetan sheep, covering 5.23-5.79% of their genomes. The introgressed genomic regions are enriched in genes related to oxygen transportation system, sensory perception, and morphological phenotypes, in particular the genes HBB and RXFP2 with strong signs of adaptive introgression. The spatial distribution of genomic diversity and demographic reconstruction of the history of Tibetan sheep show a stepwise pattern of colonization with their initial spread onto the QTP from its northeastern part ∼3,100 years ago, followed by further southwest expansion to the central QTP ∼1,300 years ago. Together with archeological evidence, the date and route reveal the history of human expansions on the QTP by the Tang-Bo Ancient Road during the late Holocene. Our findings contribute to a depth understanding of early pastoralism and the local adaptation of Tibetan sheep as well as the late-Holocene human occupation of the QTP.


Figures

<sc>Fig</sc>. 1.
Fig. 1.
Geographic locations and population genetic structure of the sheep populations studied. (A) Sampling sites and geographic distribution of Chinese sheep and argali (Ovis ammon). The scaled graph in the lower left indicates the distribution region of Tibetan sheep (in skyblue) and argali (in pink). (B) Population genetic structure of Chinese sheep and particularly Tibetan sheep inferred from the ADMIXTURE analyses (K =6) using whole-genome sequences (left) and Ovine SNP50K arrays (right). (C) Plots of principal components 1 and 2 from PCA analysis of 1,495 Chinese sheep individuals using the Ovine SNP50K arrays. (D) Plots of principal components 1 and 2 from PCA analysis of 181 Chinese sheep individuals using whole-genome sequences. (E) Neighbor-joining phylogenetic tree of 1,495 Chinese sheep individuals based on Reynolds’ distance estimated from the Ovine SNP50K array data, with O. ammon as the outgroup. See supplementary table S1, Supplementary Material online, for the abbreviations of the sheep populations.
<sc>Fig</sc>. 2.
Fig. 2.
Geographic pattern of genetic diversity for Chinese sheep. (A) Nucleotide diversity (θπ) distributions in Chinese sheep groups and Tibetan sheep subgroups from various regions of China. The white dot indicates the median value of each group/subgroup. (B) Heterozygosity (He) distributions in Chinese sheep groups and Tibetan sheep subgroups from various regions of China. The white dot indicates the median value of each group/subgroup. (C) Synthetic maps illustrating the geographic variation in nucleotide diversity (θπ) in the Tibet and Qinghai subgroups of Tibetan sheep. (D) Linkage disequilibrium (LD) decay for five geographic groups/subgroups of populations measured by r2. (E) The proportions of mtDNA lineages in the three subgroups of Tibetan sheep (Tibet, Qinghai, and margin subgroups). (F) The proportions of Y-chromosome haplotypes in three subgroups of Tibetan sheep (Tibet, Qinghai, and margin subgroups).
<sc>Fig</sc>. 3.
Fig. 3.
Integrated diagram of the inferred demographic history of the late-Holocene human and sheep populations on the Qinghai-Tibetan Plateau (QTP). (A) Distribution and approximate dates of prehistoric archeological sites of sheep in the QTP and surrounding areas. The thick brown line indicates the Tang–Bo Ancient Road (Chen et al. 2015; Zhang et al. 2017). (B) A proposed demographic scenario for the development of agriculture on the QTP based on archeological records of domestic animals (e.g., sheep, cattle, pig, and dog) and crops (e.g., millet, barley, and wheat) (supplementary table S2, Supplementary Material online), with sheep and wheat as representative species shown on the figure. (C) A proposed demographic scenario of sheep on the QTP based on genetic data in this study. (D) The best-supported demographic model of Chinese sheep populations inferred from the approximate Bayesian computation (ABC) approach.
<sc>Fig</sc>. 4
Fig. 4
Identification of genomic regions at the RXFP2 locus introgressed into Tibetan sheep from argali. (A) Genome-wide distribution of pairwise FST values between plain-polled and plateau-horned sheep computed by the Ovine SNP50K arrays (see detailed information in supplementary table S36, Supplementary Material online). (B) Genome-wide distribution of pairwise FST values between plain-horned and plateau-horned sheep computed by the Ovine SNP50K arrays (see detailed information in supplementary table S37, Supplementary Material online). (C) Smoothed FST values between the Tibetan and non-Tibetan sheep populations across chromosome 10. (D) Inferred neighbor-joining phylogenetic tree showing the genetic relationships among Chinese sheep populations with 10 migration edges. ARG (Ovis ammon) was used as the outgroup to root the tree. (E) Outgroup f3 statistics between ARG and all Tibetan sheep populations using the Ovine SNP50K arrays, with significant results (f3 value < 0) shown on the figure. (F) Evidence of introgression at the RXFP2 locus identified by PCAdmix and CIWI approaches. The distribution of the concordance score (A-scores) and CIWI score across chromosome 10 is plotted at the top of the panel and indicates the concordance of ancestry assignment among 20 individuals from a Tibetan sheep population (Dulan population, QXD). The A-scores estimated by five alternative reference populations (Guide [GDS], Maqin [QGL], Hongyuan [SAB], Gonjo [ZCG], and Comai population [ZSC]) are displayed by five colored segments, and the CIWI score inferred from the A-score is shown by the black line. Distribution of PCAdmix results for QXD63 (No. 3) across chromosome 10 is shown on the middle of the panel. PCAdmix results of QXD63 (No. 3) were estimated by five alternative reference populations (GDS, QGL, SAB, ZCG, and ZSC). The distribution of PCAdmix results of 20 individuals from QXD across chromosome 10 is plotted at the bottom of the panel. GDS was used as a reference population to perform the PCAdmix analysis. (G) The patterns of genotypes of the introgressed genomic region (chr10: 29,435,112–29,509,145) among 165 domestic sheep and 4 argali as well as the horn type phenotype (also see supplementary fig. S21, Supplementary Material online) are shown on the top. The alignment of protein sequences from the RXFP2 genes from 165 domestic sheep and 4 argali is plotted at the lower left. The amino acids of two nonsynonymous substitutions (rs418377036 and rs427658118) in the sheep reference genome Oar v.4.0 are marked in red. Amino acids identical to or different from those in the reference genome are indicated by green and pink, respectively. The genotype frequency distributions of rs418377036 and rs427658118 among sheep groups with different horn phenotypes are plotted at the lower right.
<sc>Fig</sc>. 5
Fig. 5
Identification of genomic regions at the HBB locus introgressed into Tibetan sheep from argali. (A) Genome-wide distribution of fd values calculated for 100-kb windows with a 20-kb step across the genome for a Tibetan sheep population (Gansu Maqu population, GMA). Each dot represents a 100-kb window and the dashed line indicates the significance threshold (P <0.05). (B) Neighbor joining (NJ) tree of 165 domestic sheep individuals from northern China and Tibet and 4 argali individuals based on pairwise p-distances using the SNPs in the introgressed genomic region (chr15: 47,400,001–47,500,000). (C) Mean pairwise sequence divergence (dxy) of the introgressed genomic region on chromosome 15 between argali and two Chinese sheep populations. The Hu sheep (HUS) and Gansu Maqu (GMA) populations represent northern Chinese sheep from the low-altitude region and Tibetan sheep with signatures of argali introgression, respectively. (D) Population differentiation (FST) around the introgressed genomic region on chromosome 15 between argali and Gansu Maqu (GMA) populations. (E) The pattern of genotypes among 165 domestic sheep and 4 argali of the introgressed genomic region (chr15: 47,431,866–47,485,446). (F) Alignment of protein sequences in the HBB genes from 165 domestic sheep and 4 argali. The amino acids of 21 nonsynonymous substitutions in the sheep reference genome Oar v.4.0 are marked in red. Amino acids identical to or different from those in the reference genome are indicated by green and pink, respectively.
<sc>Fig</sc>. 6.
Fig. 6.
Manhattan plot of selective sweeps in the Tibetan sheep. (A) Genome-wide distribution of pairwise FST values between Tibetan sheep and non-Tibetan sheep computed using the Ovine SNP50K arrays (see detailed information in supplementary table S33, Supplementary Material online). The threshold value corresponding to the top 1% of the FST value (FST = 0.26) is shown as the horizontal dashed line. The black dots indicate the significant sites that harbor candidate positively selected genes. (B) Genome-wide distribution of pairwise FST values between Tibetan sheep and non-Tibetan sheep computed using the sequence data set (see detailed information in supplementary table S34, Supplementary Material online). (C) Distribution of log10(θπ·ratios) between non-Tibetan sheep and Tibetan sheep estimated by the sequence data set (see detailed information in supplementary table S34, Supplementary Material online). The top 5% genome-wide significant threshold values of pairwise FST (FST = 0.0846) and log10(θπ·non-Tibetan/θπ·Tibetan) [log10(θπ ratio) = 0.1502] for the sequence data set are shown separately by black dashed lines in (B) and (C), respectively.
<sc>Fig</sc>. 7.
Fig. 7.
Functional enrichments of the candidate positively selected genes detected in the Tibetan sheep. (A) Word cloud summarizing 117 biological process terms with significant (P <0.05) enrichments from the GO analysis of 747 candidate genes under positive selection in the Tibetan sheep. These GO terms are mainly related to metabolic process, biosynthetic process, transcription regulation, and nervous system development and function. (B) Proposed mechanisms of signaling pathways for hypoxia adaptation in sheep. Positively selected genes in the Tibetan sheep are indicated in purple. Pathways related to hypoxia-induced factors (HIF-1) signaling and its surrounding pathway, O2/CO2 exchange, and vascular smooth muscle contraction are indicated in light blue, light yellow, and light pink, respectively.

References

    1. Aguileta G, Bielawski JP, Yang Z.. 2004. Gene conversion and functional divergence in the β-globin gene family. J Mol Evol. 592: 177–189. - PubMed
    1. Aldenderfer M. 2011. Peopling the Tibetan Plateau: insights from archaeology. High Alt Med Biol. 122: 141–147. - PubMed
    1. Barbato M, Hailer F, Orozco-terWengel P, Kijas J, Mereu P, Cabras P, Mazza R, Pirastru M, Bruford MW.. 2017. Genomic signatures of adaptive introgression from European mouflon into domestic sheep. Sci Rep. 71: 7623.. - PMC - PubMed
    1. Beall CM. 2007. Two routes to functional adaptation: Tibetan and Andean high-altitude natives. Proc Natl Acad Sci U S A. 104(Suppl 1): 8655–8660. - PMC - PubMed
    1. Benton MC, Johnstone A, Eccles D, Harmon B, Hayes MT, Lea RA, Griffiths L, Hoffman EP, Stubbs RS, Macartney-Coxson D.. 2015. An analysis of DNA methylation in human adipose tissue reveals differential modification of obesity genes before and after gastric bypass and weight loss. Genome Biol. 16:8. - PMC - PubMed

Publication types