

Review
doi: 10.1093/neuonc/noy131.
CBTRUS Statistical Report: Primary Brain and Other Central Nervous System Tumors Diagnosed in the United States in 2011-2015
Affiliations
- PMID: 30445539
- PMCID: PMC6129949
- DOI: 10.1093/neuonc/noy131
Item in Clipboard
Review
CBTRUS Statistical Report: Primary Brain and Other Central Nervous System Tumors Diagnosed in the United States in 2011-2015
Neuro Oncol.
.
Erratum in
-
Corrigendum.Neuro Oncol. 2018 Nov 17;23(3):508-22. doi: 10.1093/neuonc/noy171. Online ahead of print. Neuro Oncol. 2018. PMID: 30452760 Free PMC article. No abstract available.
No abstract available
Figures
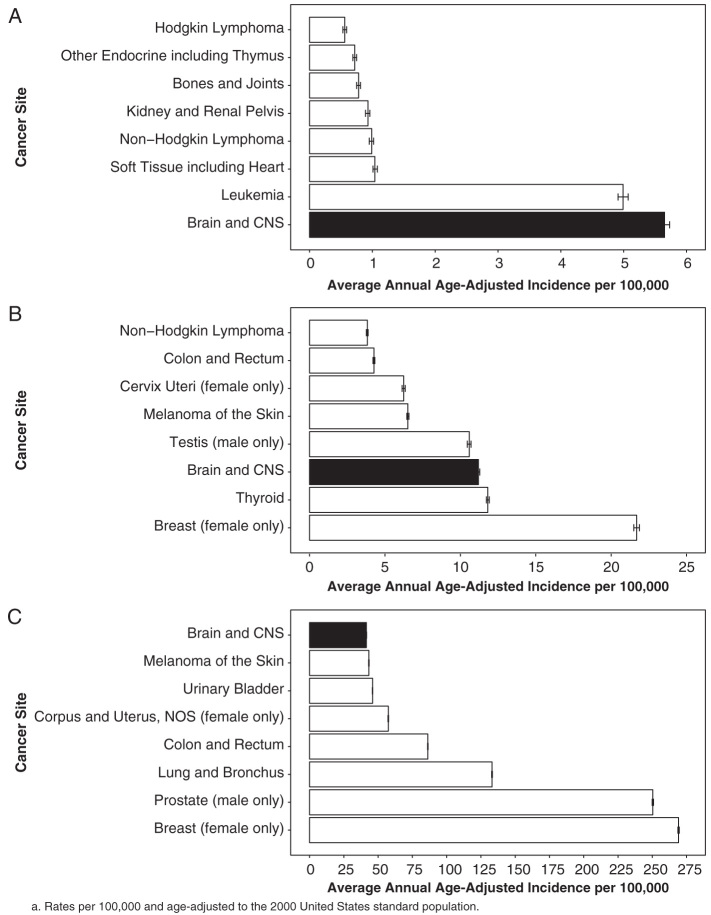
Average Annual Age-Adjusted Incidence Ratesa with 95% Confidence Intervals of All Primary Brain and Other CNS Tumors in Comparison to the Top Eight Highest Incidence Cancers for A) Children Age 0–14 Years, B) Adolescents and Young Adults Age 15–39 Years, and C) Older Adults Age 40+ Years, CBTRUS Statistical Report: NPCR and SEER 2011–2015, USCS 2011–2015.
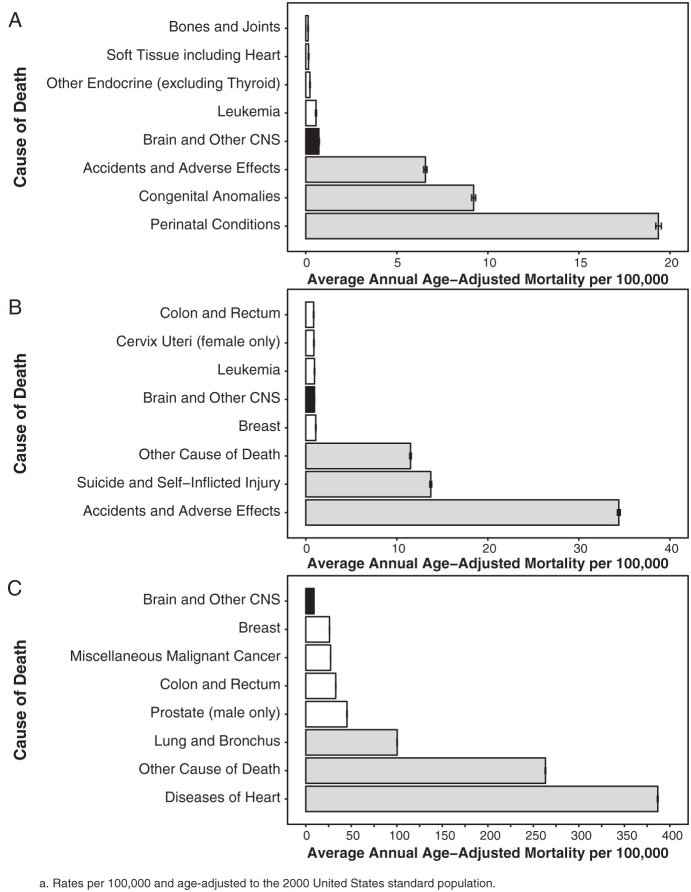
Average Annual Age-Adjusted Mortality Ratesa with 95% Confidence Intervals of All Primary Brain and Other CNS Tumors in Comparison to the Top Five Causes of Cancer Death and Top Three Non-Cancer Causes of Death for A) Children Age 0–14 Years, B) Adolescents and Young Adults Age 15–39 Years, and C) Older Adults Age 40+ Years, CBTRUS Statistical Report: NVSS 2011–2015.
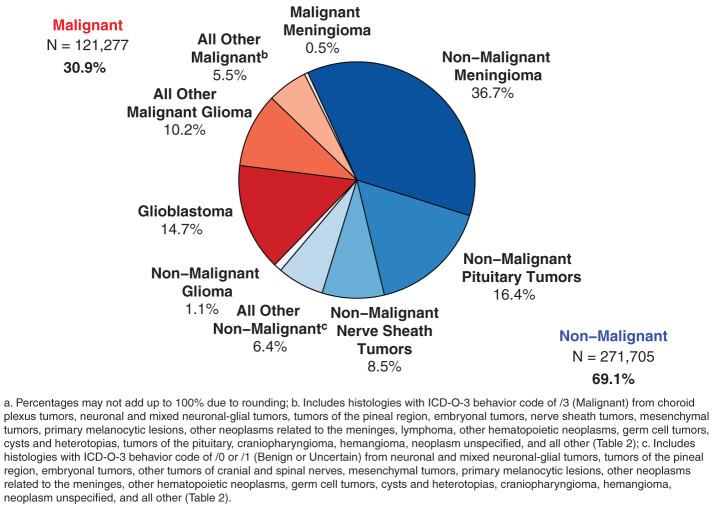
Distributiona of Primary Brain and Other CNS Tumors by Behavior (N = 392,982), CBTRUS Statistical Report: NPCR and SEER, 2011–2015.
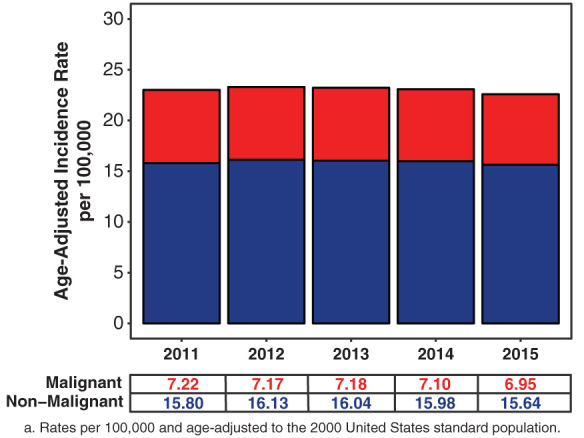
Annual Age-Adjusted Incidence Ratesa of Primary Brain and Other CNS Tumors by Year and Behavior, CBTRUS Statistical Report: NPCR and SEER, 2011–2015.
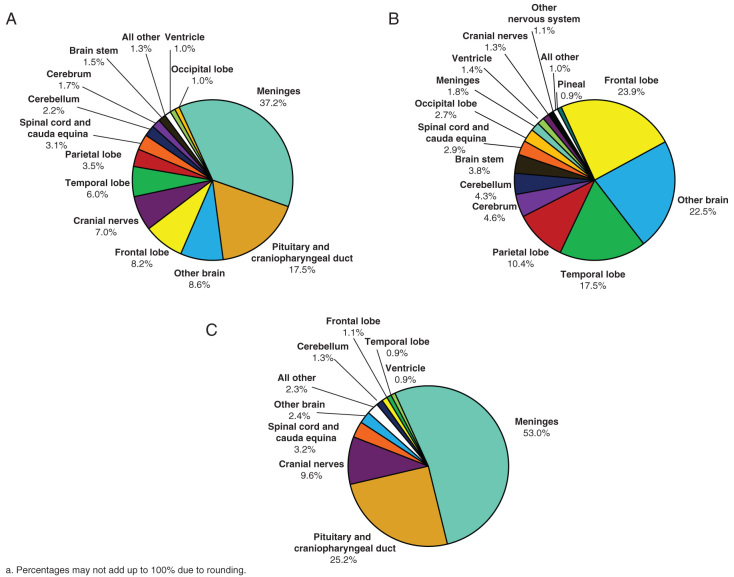
Distributiona of Primary Brain and Other CNS Tumors by Site and Behavior, A) Overall (N = 392,982), B) Malignant (N = 121,277), and C) Non-Malignant (N = 271,705), CBTRUS Statistical Report: NPCR and SEER, 2011–2015.
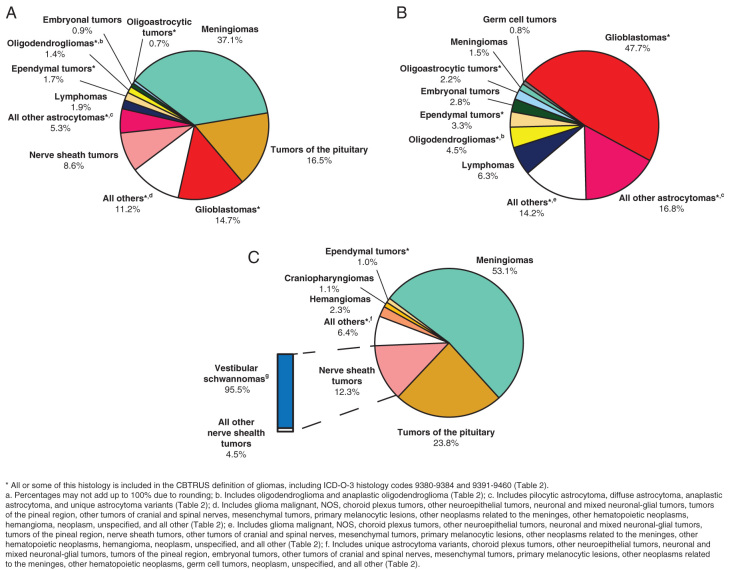
Distributiona of Primary Brain and Other CNS Tumors by CBTRUS Histology Groupings and Histology and Behavior, A) Overall (N = 392,982), B) Malignant (N = 121,277), and C) Non-Malignant (N = 271,705), CBTRUS Statistical Report: NPCR and SEER, 2011–2015.
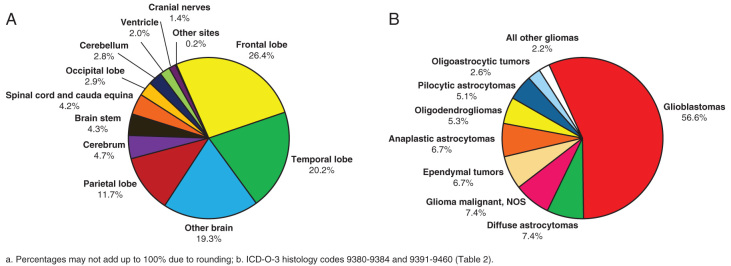
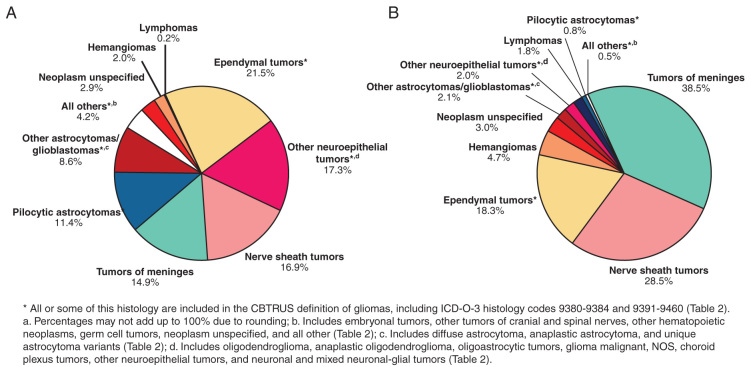
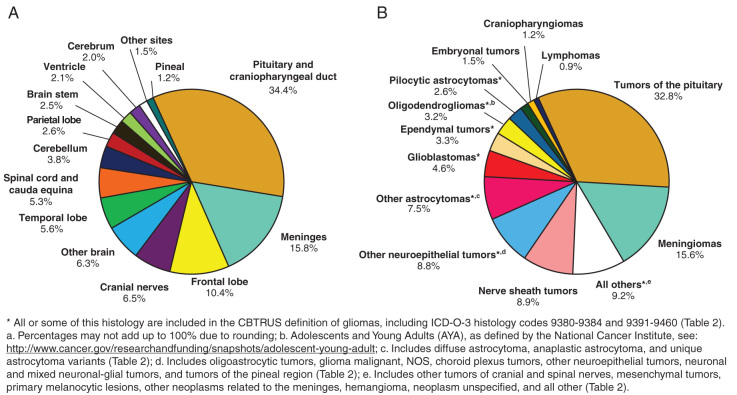
Distributiona of Primary Brain and Other CNS Gliomasb (N = 102,086) by A) Site and B) Histology Subtypes, CBTRUS Statistical Report: NPCR and SEER, 2011–2015.
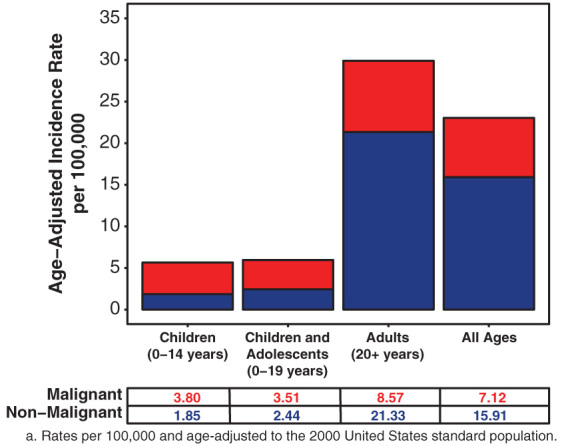
Average Annual Age-Adjusted Incidence Ratesa of Primary Brain and Other CNS Tumors by Age and Behavior, CBTRUS Statistical Report: NPCR and SEER, 2011–2015.
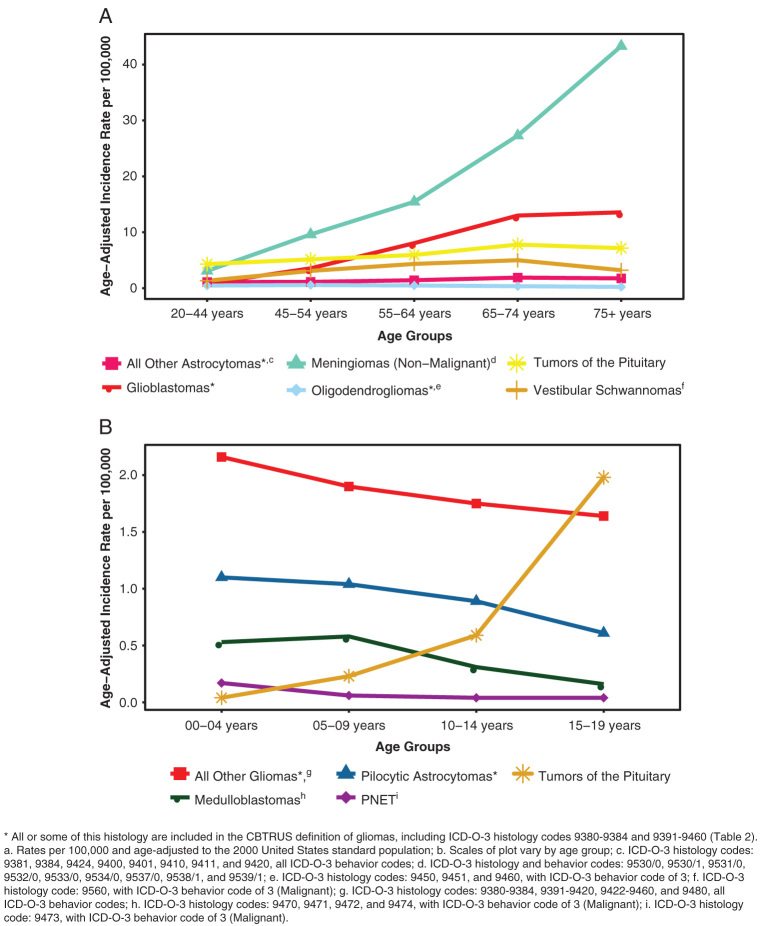
Age-Adjusted Incidence Ratesa of Brain and Other CNS Tumors by Selected Histologies and Age Group A) Age 20+ Yearsb and B) Age 0–19 Yearsb, CBTRUS Statistical Report: NPCR and SEER, 2011–2015.
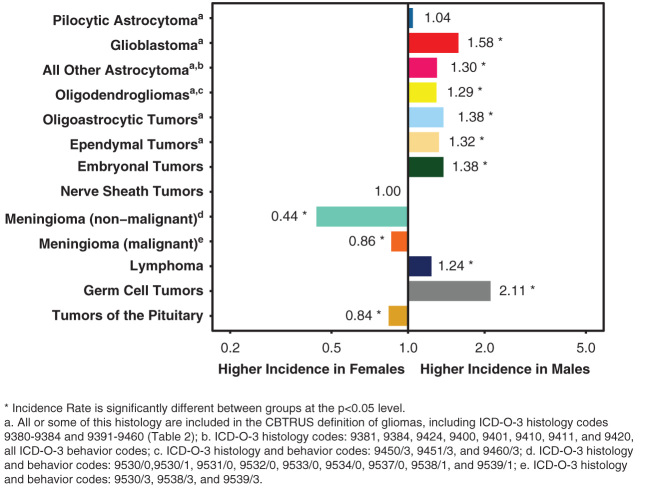
Incidence Rate Ratios by Sex (Males:Females) for Selected CBTRUS Histology Groupings and Histology, CBTRUS Statistical Report: NPCR and SEER, 2011–2015.
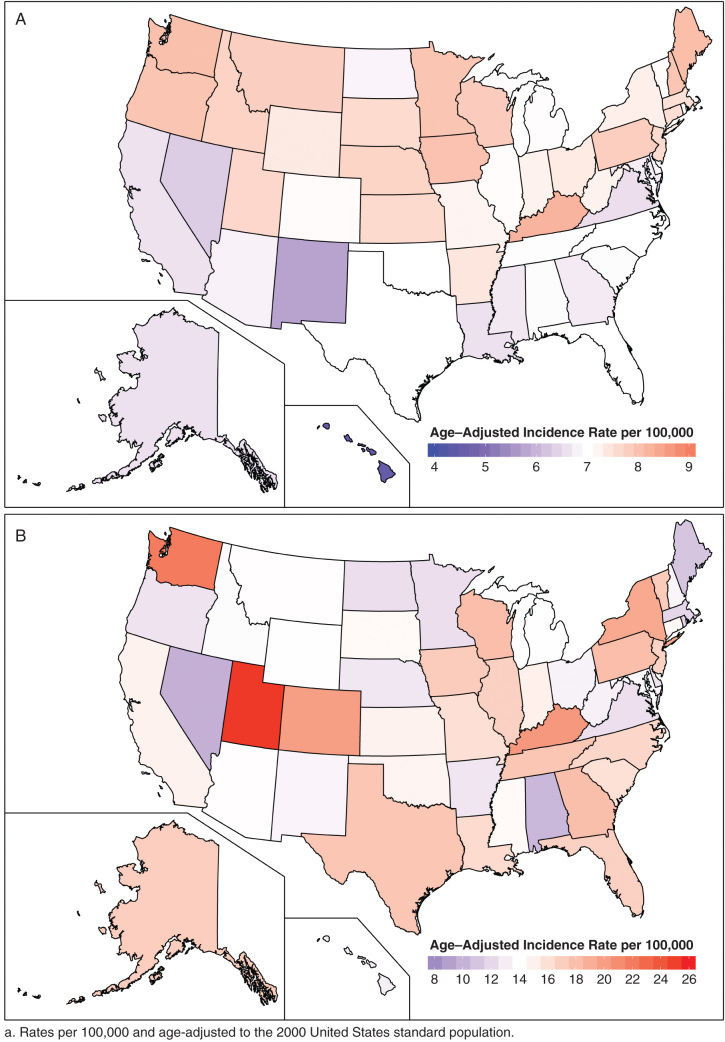
Average Annual Age-Adjusted Incidence Ratesa of A) Malignant Primary Brain and Other CNS Tumors and B) Non-Malignant Primary Brain and Other CNS Tumors by Central Cancer Registry, CBTRUS Statistical Report: NPCR and SEER, 2011-2015b.
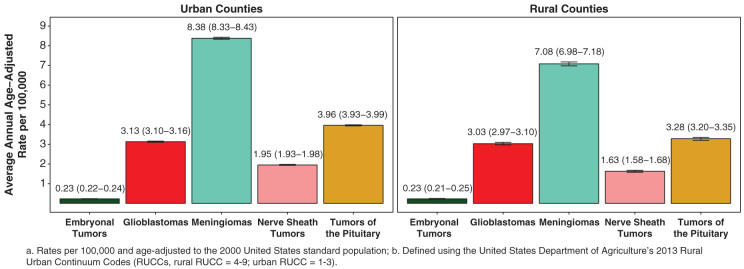
Average Annual Age-Adjusted Incidence Ratesa with 95% Confidence Intervals of Selected Primary Brain and Other CNS Tumor Histologies by Urban or Rural Location of Residenceb, CBTRUS Statistical Report: NPCR and SEER, 2011-2015.
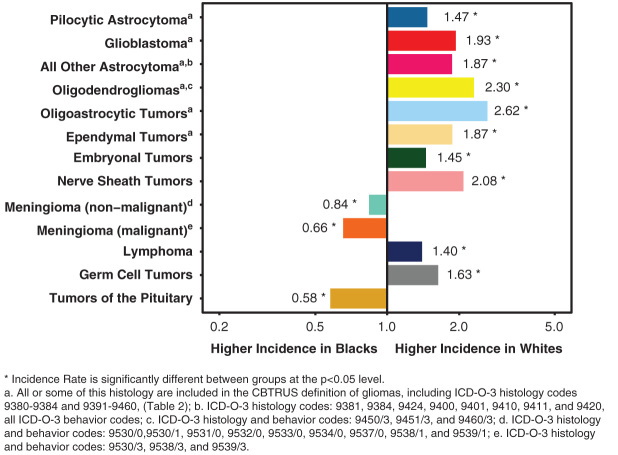
Incidence Rate Ratios by Race (Whites:Blacks) for Selected CBTRUS Histology Groupings and Histologies, CBTRUS Statistical Report: NPCR and SEER, 2011-2015.
Distributiona in Children and Adolescents (Age 0-19 Years) of Primary Brain and CNS Tumors (N = 24,532) by A) Site and B) Histology, CBTRUS Statistical Report: NPCR and SEER, 2011-2015.
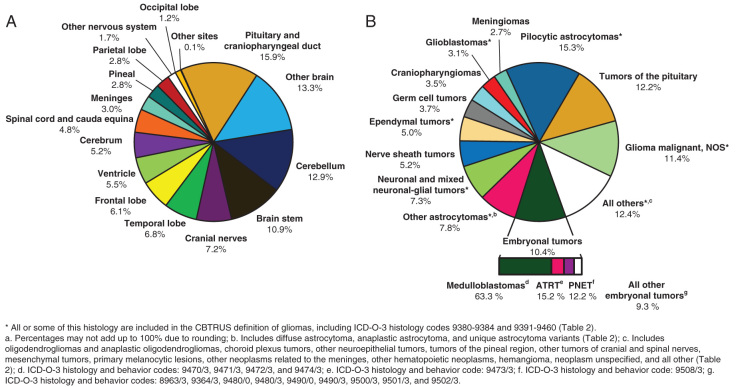
Distributiona in Children (Age 0-14 Years) of Primary Brain and Other CNS Tumors (N = 17,273) by A) Site and B) Histology, CBTRUS Statistical Report: NPCR and SEER, 2011-2015.
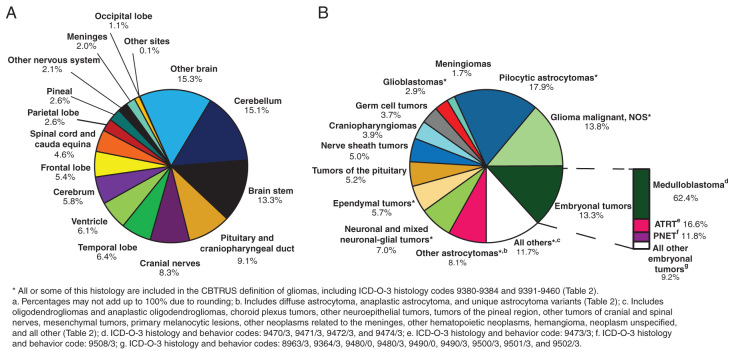
Distributiona in Adolescentsb (Age 15-19 Years) of Primary Brain and Other CNS Tumors (N = 7,259) by A) Site and B) Histology, CBTRUS Statistical Report: NPCR and SEER, 2011-2015.
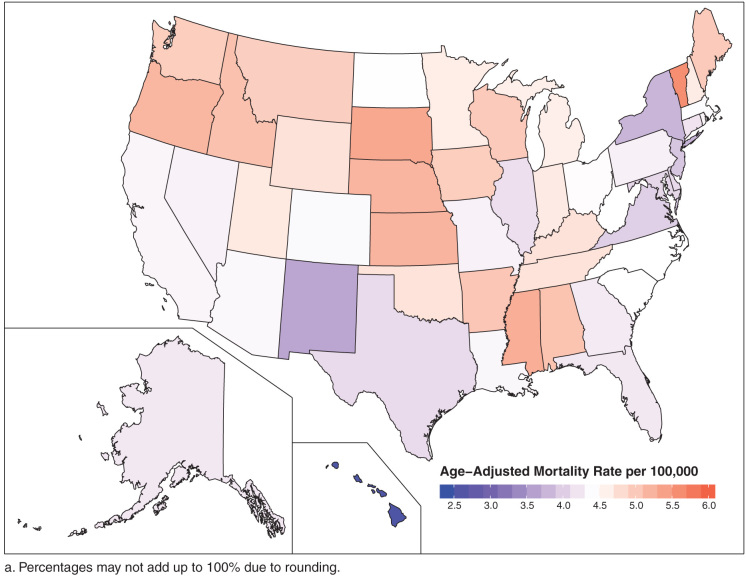
Average Annual Age-Adjusted Mortality Ratesa for Malignant Primary Brain and Other CNS Tumors by Central Cancer Registry, CBTRUS Statistical Report: NCHS, 2011-2015.
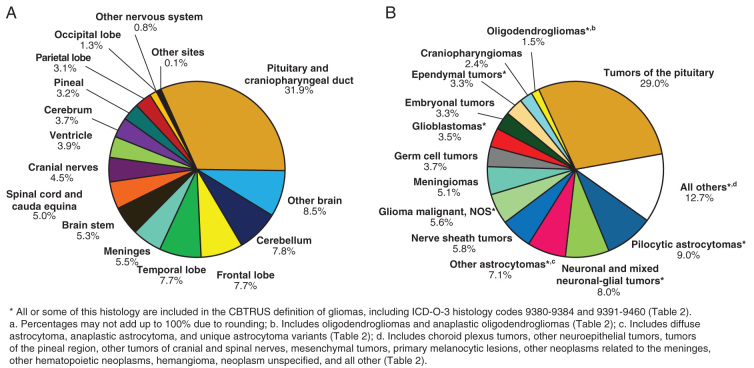
Distributiona of Primary Spinal Cord, Spinal Meninges, and Cauda Equina Tumors by CBTRUS Histology Groupings and Histology in A) Children and Adolescents (Age 0-19 Years, N = 1,269) and B) Adults (Age 20+ Years, N = 17,479), CBTRUS Statistical Report: NPCR and SEER, 2011-2015.
Distributiona in Adolescents and Young Adultsb (Age 15-39 Years) of Primary Brain and Other CNS Tumors (N = 57,821) by A) Site and B) Histology, CBTRUS Statistical Report: NPCR and SEER, 2011-2015.
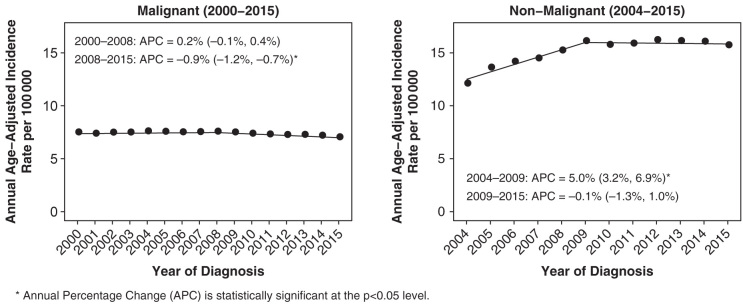
Annual Age-Adjusted Incidence Rates of Primary Brain and Other CNS Tumors, and Incidence Trends by Behavior, CBTRUS Statistical Report: NPCR and SEER, 2000-2015 (varying).
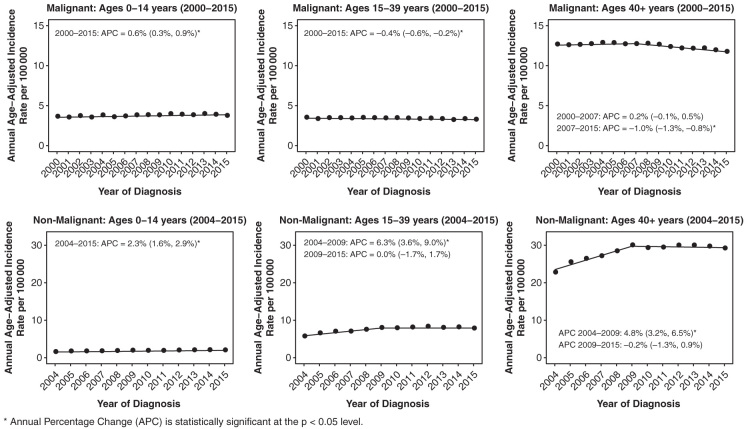
Annual Age-Adjusted Incidence Rates of Primary Brain and Other CNS Tumors, and Incidence Trends by Behavior and Age Group, CBTRUS Statistical Report: NPCR and SEER, 2000-2015 (varying).
References
-
- Louis D, Wiestler O, Cavanee W, eds. WHO Classification of Tumours of the Central Nervous System. Lyon, France: International Agency for Research on Cancer; 2007.
-
- Centers for Disease Control and Prevention (CDC). National Program of Cancer Registries Cancer Surveillance System Rationale and Approach. 1999; http://www.cdc.gov/cancer/npcr/pdf/npcr_css.pdf.
-
- Cancer Registries Amendment Act, 102nd Cong. § 515 (1992). http://www.gpo.gov/fdsys/pkg/STATUTE-106/pdf/STATUTE-106-Pg3372.pdf.
Publication types
MeSH terms
LinkOut - more resources
Full Text Sources
Other Literature Sources
Medical
