. 2019 May 30;68(12):1993-2002.
doi: 10.1093/cid/ciy821.

The Effect of Influenza Virus on the Human Oropharyngeal Microbiome

Affiliations

The Effect of Influenza Virus on the Human Oropharyngeal Microbiome

Elisa Ramos-Sevillano et al. Clin Infect Dis. .

Abstract

Background: Secondary bacterial infections are an important cause of morbidity and mortality associated with influenza infections. As bacterial disease can be caused by a disturbance of the host microbiome, we examined the impact of influenza on the upper respiratory tract microbiome in a human challenge study.

Methods: The dynamics and ecology of the throat microbiome were examined following an experimental influenza challenge of 52 previously-healthy adult volunteers with influenza A/Wisconsin/67/2005 (H3N2) by intranasal inoculation; 35 healthy control subjects were not subjected to the viral challenge. Serial oropharyngeal samples were taken over a 30-day period, and the V1-V3 region of the bacterial 16S ribosomal RNA sequences were amplified and sequenced to determine the composition of the microbiome. The carriage of pathogens was also detected.

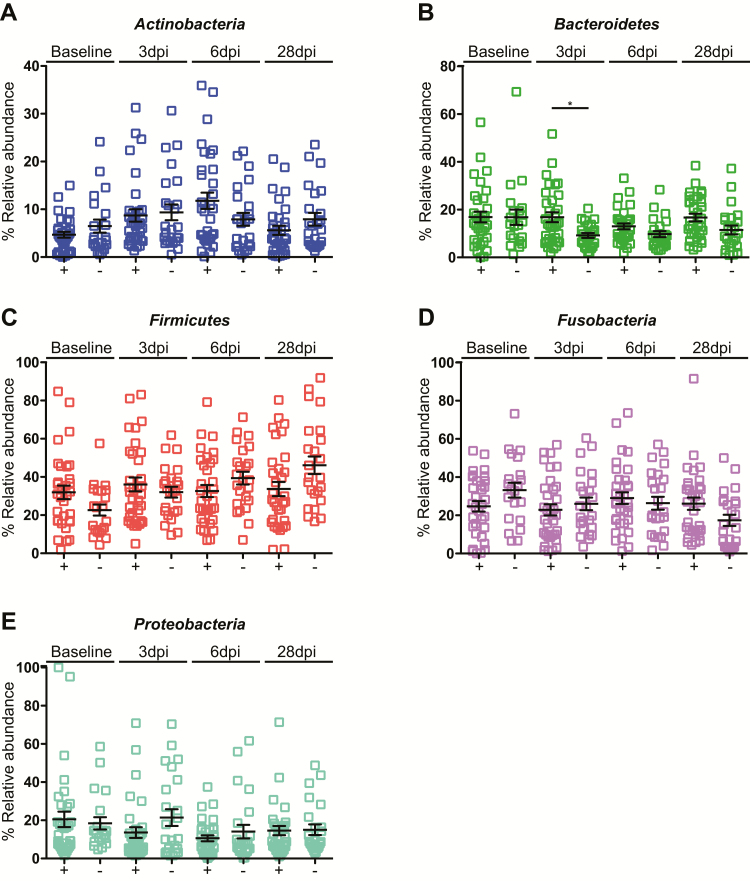
Results: Of the 52 challenged individuals, 43 developed proven influenza infections, 33 of whom became symptomatic. None of the controls developed influenza, although 22% reported symptoms. The diversity of bacterial communities remained remarkably stable following the acquisition of influenza, with no significant differences over time between individuals with influenza and those in the control group. Influenza infection was not associated with perturbation of the microbiome at the level of phylum or genus. There was no change in colonization rates with Streptococcus pneumoniae or Neisseria meningitidis.

Conclusions: The throat microbiota is resilient to influenza infection, indicating the robustness of the upper-airway microbiome.

Keywords: influenza; microbiome; upper respiratory tract.


Figures

Figure 1.
Figure 1.
Study timeline. Volunteers were screened prior to admission to a quarantine unit on the day before receiving an intranasal challenge of influenza A (on day 0), then were followed for 28 days. The volunteers were kept in quarantine for 6 days post-inoculation. Controls were screened and housed in identical conditions, but were not subjected to a viral challenge. Throat swabs were collected at different time points during the study (ie, on days -1, 3, 6, and 28 post-inoculation).
Figure 2.
Figure 2.
Analysis of the richness of the URT microbiome. The diversity of the microbiome was analyzed by sequencing the V1-3 region of 16S rRNA amplified from samples obtained from the ILI/Sflu+ (white boxes) and asymptomatic control (grey boxes) groups following the influenza A challenge. The box whisker plots extend from the 25th to 75th percentiles, and the ends of the whiskers show the maximum and minimum values. The line in the middle of the box represents the median and the dots represent the outliers 1.5 greater or lower than the interquartile distance. The analysis was based on: (A) the number of OTUs; (B) Chao1 index; and (C) Shannon diversity index at baseline, 3 (3dpi), 6 (6dpi) and 28 (28dpi) days post–influenza challenge. Abbreviations: AC, asymptomatic control; dpi, days post–influenza challenge; ILI/Sflu+, subjects who received viral challenge, had laboratory evidence of influenza, and had an influenza-like illness/were symptomatic; OTU, operational taxonomic units; URT, upper respiratory tract.
Figure 3.
Figure 3.
Throat microbiota structure in the ILI/Sflu+ and asymptomatic control groups during the influenza challenge. The PCoA was based on the Thetayc index, comparing the community structures of samples from the ILI/Sflu+ infected group (blue open circles) and asymptomatic control (red open circles) groups at days (A) 3 and (B) 6. The centroid represents the arithmetic mean for each of the groups, each dot represents the microbiota structure profile for each of the samples, while the ellipses represent the 95% of the samples belonging to each group. Abbreviations: ILI/Sflu+, subjects who received viral challenge, had laboratory evidence of influenza, and had an influenza-like illness/were symptomatic; PCoA, principal co-ordinates analysis .
Figure 4.
Figure 4.
LEfSe analysis of abundant OTUs in ILI/Sflu+ and asymptomatic controls. The positive scale indicates the LDA score (Log10) for the most abundant taxa in the ILI/Sflu+ group (green bars), while the negative scale represents the LDA scores for the prevalent taxa in the asymptomatic control group on days (A) 3 and (B) 6. Abbreviations: ILI/Sflu+, subjects who received viral challenge, had laboratory evidence of influenza, and had an influenza-like illness/were symptomatic; LDA, Linear Discriminant Analysis; LEfSe, LDA effect size; OTU, operational taxonomic units.
Figure 5.
Figure 5.
Relative abundance of common phyla in the human oropharynx. Comparison of the abundance of each phylum between individuals in the ILI/Sflu+ group (+) and the asymptomatic controls (-). The phyla are indicated in each panel. Error bars represent the standard deviation. A non-parametric Kruskal-Wallis test for multiple comparisons was applied to identify the statistically significant differences in relative abundances between groups. *P < .05. Samples are from individuals prior to their entry to quarantine (baseline) and at days 3, 6, and 28 after the challenge, or not (in the control group). Abbreviations: dpi, days post–influenza challenge; ILI/Sflu+, subjects who received viral challenge, had laboratory evidence of influenza, and had an influenza-like illness/were symptomatic.
Figure 6.
Figure 6.
Relative abundance of common phyla in the human oropharynx. The abundance of phyla in individuals in the ILI/Sflu+ group (+). Phyla are indicated in each panel and error bars represent the standard deviation. A non-parametric Kruskal-Wallis test for multiple comparisons was applied to identify the statistically significant differences in relative abundances between groups. *P < .05; **P < .01. Samples are from individuals prior to their entry to quarantine (baseline) and at days 3, 6, and 28 after the challenge. Abbreviations: dpi, days post–influenza challenge; ILI/Sflu+, subjects who received viral challenge, had laboratory evidence of influenza, and had an influenza-like illness/were symptomatic.
Figure 7.
Figure 7.
Relative abundance of the common genera in the human oropharynx. Comparison of the abundance of each phylum in individuals between the ILI/Sflu+ group (+) and the asymptomatic controls (-). Genera are indicated in each panel. Error bars represent the standard deviation. A non-parametric Kruskal-Wallis test for multiple comparisons was applied to identify the statistically significant differences in relative abundances between groups. *P < .05. Samples are from individuals prior to their entry to quarantine (baseline) and at days 3, 6, and 28 after the challenge, or not (in the control group). Abbreviations: dpi, days post–influenza challenge; ILI/Sflu+, subjects who received viral challenge, had laboratory evidence of influenza, and had an influenza-like illness/were symptomatic.
Figure 8.
Figure 8.
Relative abundance of the common genera in the human oropharynx. The abundance of each genera in individuals within the ILI/Sflu+ group (+). The genera are indicated in each panel. Error bars represent the standard deviation. A non-parametric Kruskal-Wallis test for multiple comparisons was applied to identify the statistically significant differences in relative abundances between groups. *P < .05. Samples are from individuals prior to their entry to quarantine (baseline) and at days 3, 6, and 28 after the challenge. Abbreviations: dpi, days post–influenza challenge; ILI/Sflu+, subjects who received viral challenge, had laboratory evidence of influenza, and had an influenza-like illness/were symptomatic.
Figure 9.
Figure 9.
Neisseria meningitidis carriage following the influenza challenge. Meningococcal carriage in (A) the ILI/Sflu+ group and (B) the asymptomatic control group at different times following the challenge. The carriage of non-groupable N. meningitidis was unchanged during influenza infection and ranged between 11.4 and 13.5%, except for control samples from days 6 and 28. There was no change in the carriage of groupable N. meningitidis over time or between groups. Abbreviation: ILI/Sflu+, subjects who received viral challenge, had laboratory evidence of influenza, and had an influenza-like illness/were symptomatic.

References

    1. Smith AM, McCullers JA. Secondary bacterial infections in influenza virus infection pathogenesis. Curr Top Microbiol Immunol 2014; 385:327–56. - PMC - PubMed
    1. Morens DM, Fauci AS. The 1918 influenza pandemic: insights for the 21st century. J Infect Dis 2007; 195:1018–28. - PubMed
    1. Sheng ZM, Chertow DS, Ambroggio X, et al. . Autopsy series of 68 cases dying before and during the 1918 influenza pandemic peak. Proc Natl Acad Sci USA 2011; 108:16416–21. - PMC - PubMed
    1. Lee EH, Wu C, Lee EU, et al. . Fatalities associated with the 2009 H1N1 influenza A virus in New York city. Clin Infect Dis 2010; 50:1498–504. - PubMed
    1. Smith W, Andrewes CH, Laidlaw PP. A virus obtained from influenza patients. Lancet 1933; 2:66–8.

Publication types

Substances