

Footprints of antigen processing boost MHC class II natural ligand predictions
- PMID: 30446001
- PMCID: PMC6240193
- DOI: 10.1186/s13073-018-0594-6
Footprints of antigen processing boost MHC class II natural ligand predictions
Abstract
Background: Major histocompatibility complex class II (MHC-II) molecules present peptide fragments to T cells for immune recognition. Current predictors for peptide to MHC-II binding are trained on binding affinity data, generated in vitro and therefore lacking information about antigen processing.
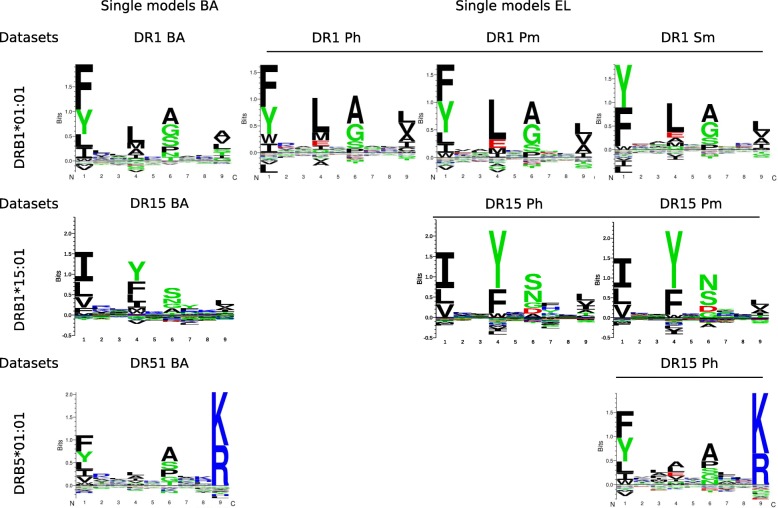
Methods: We generate prediction models of peptide to MHC-II binding trained with naturally eluted ligands derived from mass spectrometry in addition to peptide binding affinity data sets.
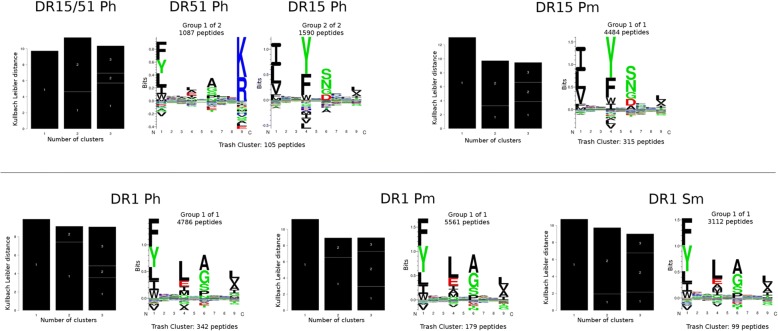
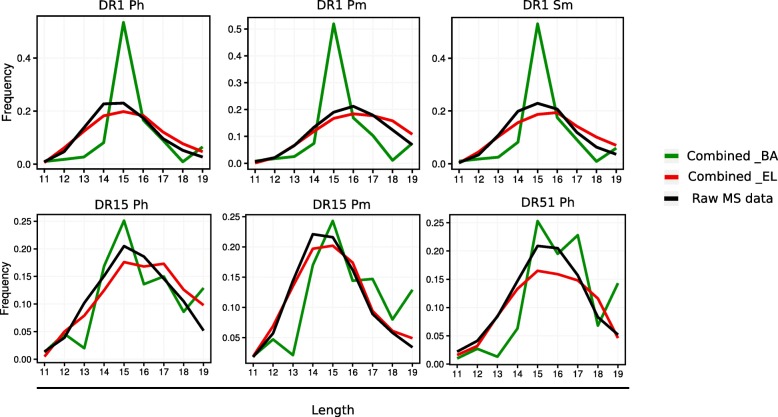
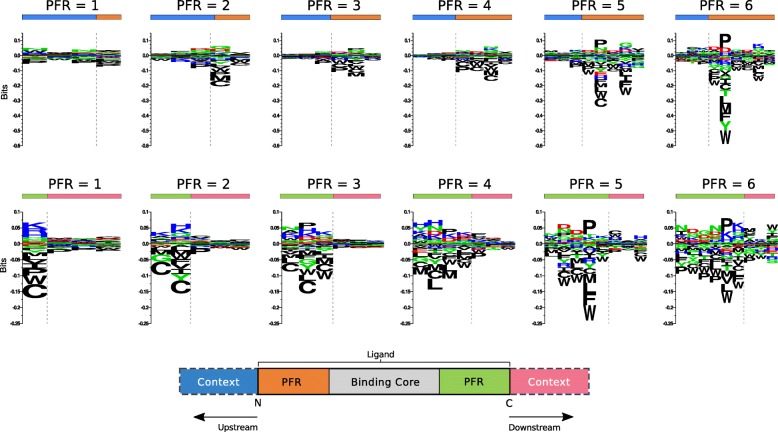
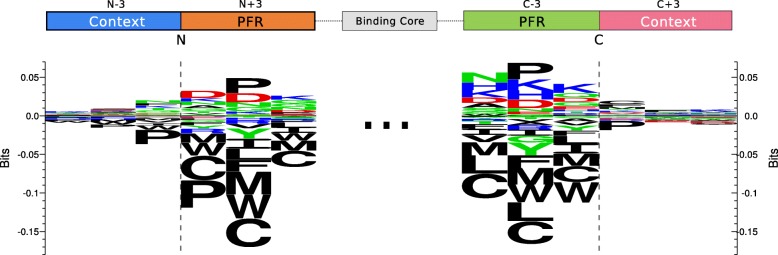
Results: We show that integrated prediction models incorporate identifiable rules of antigen processing. In fact, we observed detectable signals of protease cleavage at defined positions of the ligands. We also hypothesize a role of the length of the terminal ligand protrusions for trimming the peptide to the MHC presented ligand.
Conclusions: The results of integrating binding affinity and eluted ligand data in a combined model demonstrate improved performance for the prediction of MHC-II ligands and T cell epitopes and foreshadow a new generation of improved peptide to MHC-II prediction tools accounting for the plurality of factors that determine natural presentation of antigens.
Keywords: Antigen processing; Binding predictions; Eluted ligands; MHC-II; Machine learning; Mass spectrometry; Neural networks; T cell epitope.
Conflict of interest statement
Ethics approval and consent to participate
Not applicable
Consent for publication
Not applicable
Competing interests
The authors declare that they have no competing interests.
Publisher’s Note
Springer Nature remains neutral with regard to jurisdictional claims in published maps and institutional affiliations.
Figures

Similar articles
-
Determination of a Predictive Cleavage Motif for Eluted Major Histocompatibility Complex Class II Ligands.Front Immunol. 2018 Aug 6;9:1795. doi: 10.3389/fimmu.2018.01795. eCollection 2018. Front Immunol. 2018. PMID: 30127785 Free PMC article.
-
Improved peptide-MHC class II interaction prediction through integration of eluted ligand and peptide affinity data.Immunogenetics. 2019 Jul;71(7):445-454. doi: 10.1007/s00251-019-01122-z. Epub 2019 Jun 10. Immunogenetics. 2019. PMID: 31183519
-
Systematically benchmarking peptide-MHC binding predictors: From synthetic to naturally processed epitopes.PLoS Comput Biol. 2018 Nov 8;14(11):e1006457. doi: 10.1371/journal.pcbi.1006457. eCollection 2018 Nov. PLoS Comput Biol. 2018. PMID: 30408041 Free PMC article.
-
Peptide exchange in MHC molecules.Immunol Rev. 1999 Dec;172:229-38. doi: 10.1111/j.1600-065x.1999.tb01368.x. Immunol Rev. 1999. PMID: 10631949 Review.
-
Peptides bound to major histocompatibility complex molecules.Peptides. 1998;19(1):179-98. doi: 10.1016/s0196-9781(97)00277-5. Peptides. 1998. PMID: 9437752 Review.
Cited by
-
T Cell Epitope Predictions.Annu Rev Immunol. 2020 Apr 26;38:123-145. doi: 10.1146/annurev-immunol-082119-124838. Epub 2020 Feb 11. Annu Rev Immunol. 2020. PMID: 32045313 Free PMC article. Review.
-
Machine learning reveals limited contribution of trans-only encoded variants to the HLA-DQ immunopeptidome.Commun Biol. 2023 Apr 21;6(1):442. doi: 10.1038/s42003-023-04749-7. Commun Biol. 2023. PMID: 37085710 Free PMC article.
-
A Systematic, Unbiased Mapping of CD8+ and CD4+ T Cell Epitopes in Yellow Fever Vaccinees.Front Immunol. 2020 Aug 31;11:1836. doi: 10.3389/fimmu.2020.01836. eCollection 2020. Front Immunol. 2020. PMID: 32983097 Free PMC article.
-
Cancer Neoantigens: Challenges and Future Directions for Prediction, Prioritization, and Validation.Front Oncol. 2022 Mar 3;12:836821. doi: 10.3389/fonc.2022.836821. eCollection 2022. Front Oncol. 2022. PMID: 35311072 Free PMC article. Review.
-
Comprehensive analysis of T cell immunodominance and immunoprevalence of SARS-CoV-2 epitopes in COVID-19 cases.Cell Rep Med. 2021 Feb 16;2(2):100204. doi: 10.1016/j.xcrm.2021.100204. Epub 2021 Jan 26. Cell Rep Med. 2021. PMID: 33521695 Free PMC article.
References
-
- Sette A, Adorini L, Colon SM, Buus S, Grey HM. Capacity of intact proteins to bind to MHC class II molecules. J Immunol. 1989;143:1265–1267. - PubMed
Publication types
MeSH terms
Substances
Grants and funding
LinkOut - more resources
Full Text Sources
Other Literature Sources
Research Materials
