. 2018 Nov 20;49(5):915-928.e5.
doi: 10.1016/j.immuni.2018.09.015. Epub 2018 Nov 13.

Aryl Hydrocarbon Receptor Signaling Cell Intrinsically Inhibits Intestinal Group 2 Innate Lymphoid Cell Function

Affiliations

Aryl Hydrocarbon Receptor Signaling Cell Intrinsically Inhibits Intestinal Group 2 Innate Lymphoid Cell Function

Shiyang Li et al. Immunity. .

Abstract

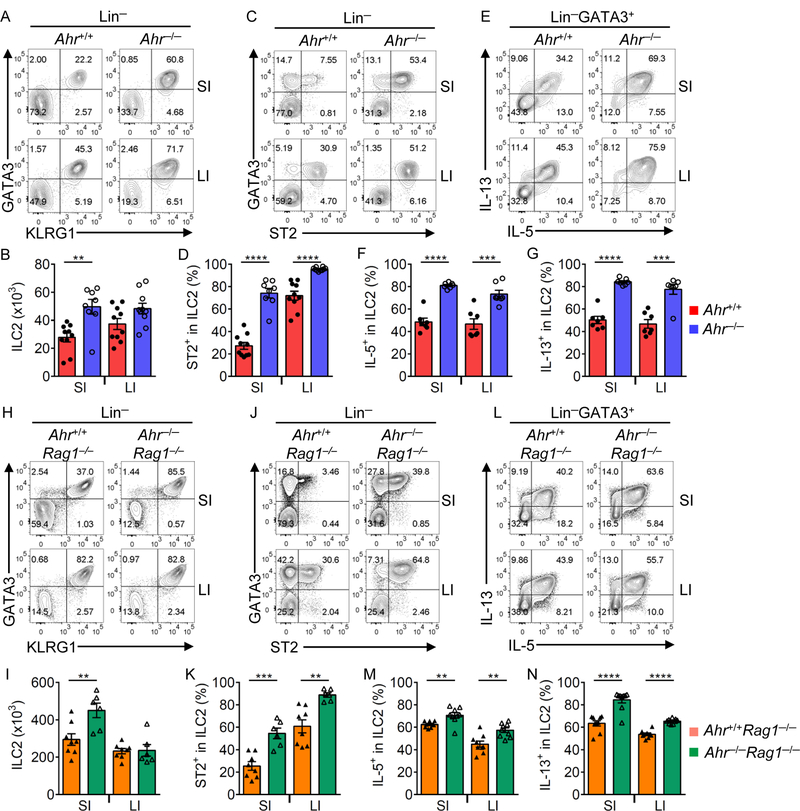
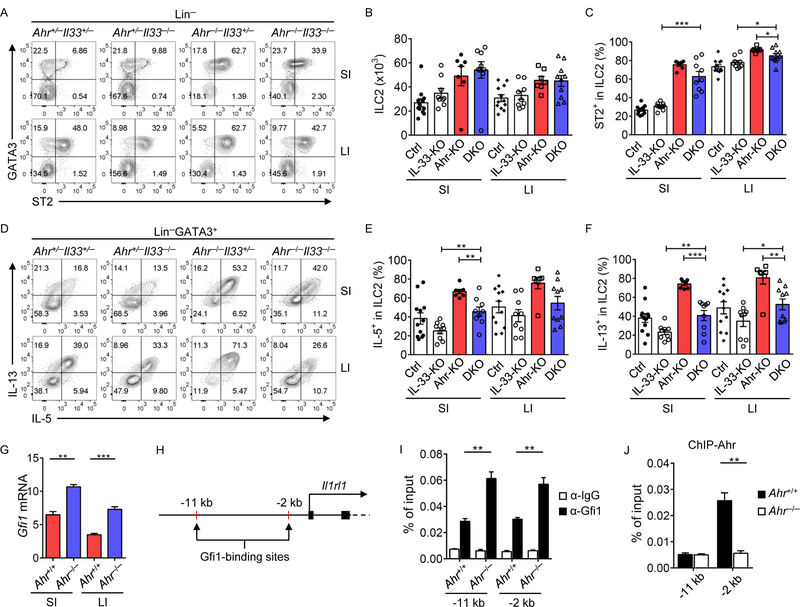
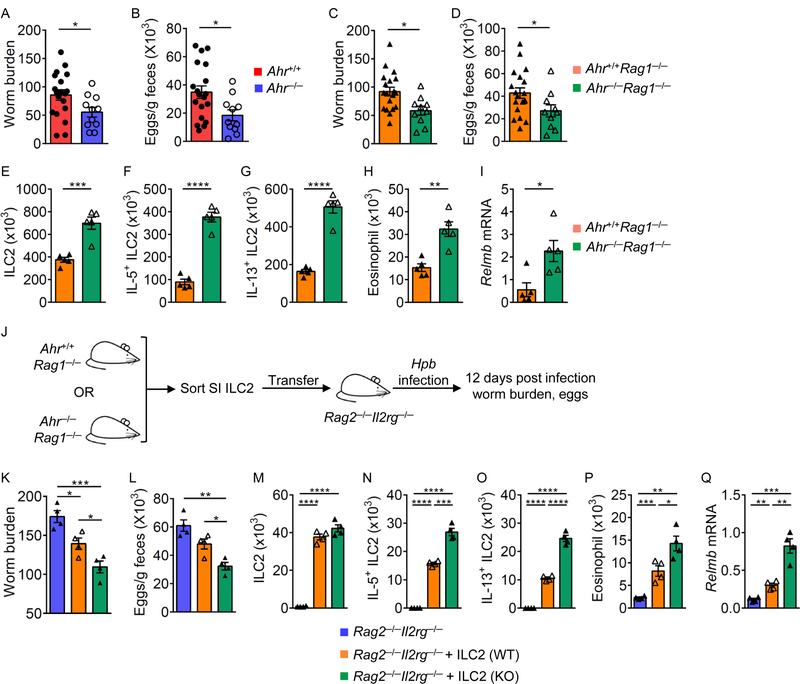
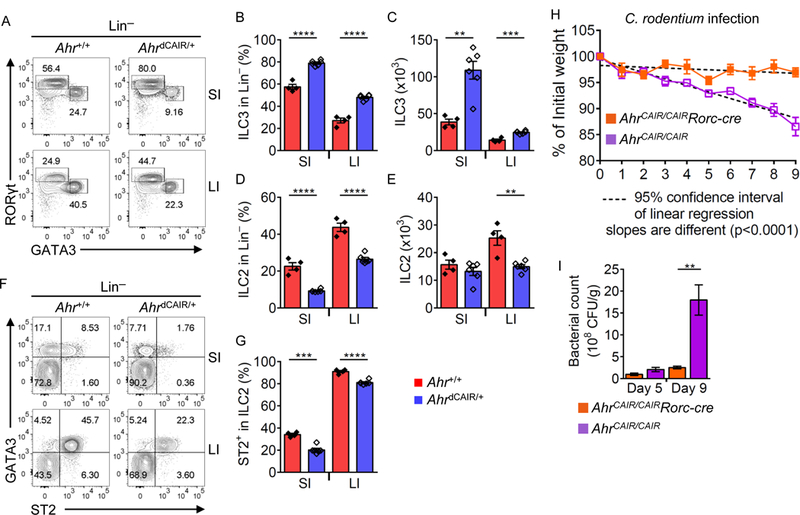
Innate lymphoid cells (ILCs) are important for mucosal immunity. The intestine harbors all ILC subsets, but how these cells are balanced to achieve immune homeostasis and mount appropriate responses during infection remains elusive. Here, we show that aryl hydrocarbon receptor (Ahr) expression in the gut regulates ILC balance. Among ILCs, Ahr is most highly expressed by gut ILC2s and controls chromatin accessibility at the Ahr locus via positive feedback. Ahr signaling suppresses Gfi1 transcription-factor-mediated expression of the interleukin-33 (IL-33) receptor ST2 in ILC2s and expression of ILC2 effector molecules IL-5, IL-13, and amphiregulin in a cell-intrinsic manner. Ablation of Ahr enhances anti-helminth immunity in the gut, whereas genetic or pharmacological activation of Ahr suppresses ILC2 function but enhances ILC3 maintenance to protect the host from Citrobacter rodentium infection. Thus, the host regulates the gut ILC2-ILC3 balance by engaging the Ahr pathway to mount appropriate immunity against various pathogens.

Keywords: Ahr; IL-33; ILC; ST2; chromatin; gene expression; gut immunity.


Conflict of interest statement

Declaration of interests

The authors declare no competing interests.

Figures

Figure 1.
Figure 1.. Ahr is highly expressed by gut ILC2s with unique chromatin features at the Ahr gene locus.
(A) Intracellular staining of Ahr in NK cells (Lin T-bet+EOMES+RORγt), ILC1s (LinT-bet+EOMESRORγt), ILC2s (Lin GATA3+RORγt) and T-bet+ or T-bet ILC3s (LinRORγt+GATA3) isolated from the GATA3+RORγt) and T-bet+ or T-bet ILC3s (LinRORγt+GATA3) isolated from the lamina propria of small intestine (SI) or large intestine (LI). Data are representative of three independent experiments. (B) ∆MFI (Mean Fluorescence Intensity) of Ahr expression was calculated as follows: MFI of indicated Ahr+/+ cell populations – MFI of indicated Ahr−/− cell populations. Data are shown as mean ± SEM (n=6). ANOVA followed by Bonferroni’s test for ILC2s versus other ILC subsets in SI or LI. (C) Intracellular staining of Ahr in ILC2s from indicated organs. Data are representative of three independent experiments. (D) Flow cytometry analysis of GFP expression by ILC2s from the various tissues of indicated mice. Data are representative of five independent experiments. (E) Percentages of GFP+ proportion in ILC2s in various tissues of AhrdCAIR/+ mice. Data are shown as mean ± SEM (n=5 for SI, n=6 for LI, lung, and fat). ANOVA followed by Bonferroni’s test for the SI or LI versus other tissues. (F) Representative ATAC-seq tracks at the Ahr locus in ILC2s sorted from SI or LI of Ahr+/+Rag1−/− or Ahr−/− Rag1−/− littermate mice (upper). Recruitment of Gfi1 or GATA3 to the Ahr locus in ILC2s by analyzing published ChIP-seq data (middle). Representative RNA-seq tracks at the Ahr locus in ILC2s sorted from SI or LI of Ahr+/+Rag1−/− or Ahr−/−Rag1−/− littermate mice (lower). (G to I) ILC2s (LinKLRG1+CD90+) sorted from LI of Ahr+/+ or Ahr−/− littermate mice were expanded in vitro and subjected to ChIP assay. Enrichment of Ahr (G), Gfi1 (H), or GATA3 (I) at the sites 54 kb (+54 kb) or 14 kb (+14 kb) downstream of the transcription start site was determined by real-time PCR. Data are representative of two independent experiments, and shown as mean ± SEM (n=3). Rabbit IgG isotype antibody was used as a negative control for ChIP of Gfi1 or GATA3. (J) Fragments Per Kilobase of transcript per Million mapped reads (FPKM) of Ahr in RNA-seq of sorted ILC2s from SI or LI of Ahr+/+Rag1−/− or Ahr−/−Rag1−/− littermate mice. The q-value was generated by Cufflinks analysis as described in STAR Methods. ***q<0.001. See also Figures S1 and S2.
Figure 2.
Figure 2.. Ahr deficiency alters ILC2 transcriptional program, and affects chromatin landscape in ILCs.
(A) Scatterplot of gene expression of log2 (FPKM) comparing ILC2s sorted from littermate Ahr+/+Rag1−/− (WT) or Ahr−/−Rag1−/− (KO) mice. Differentially-expressed genes (q-value ≤ 0.05 and fold change ≥ 1.5) are highlighted in blue (decreased) or red (increased). (B) Venn diagrams of upregulated and downregulated genes identified in (A) indicating the overlap of differentially-expressed genes regulated by Ahr in the ILC2s between the small intestine (SI) and large intestine (LI). (C and D) Heatmap of ILC2-characteristic genes in the SI (C) or LI (D) of littermate Ahr+/+Rag1−/− (WT) or Ahr−/−Rag1−/− (KO) mice. (E) FPKM of ILC2s key transcriptional regulator genes in ILC2s from SI or LI of littermate Ahr+/+Rag1−/− or Ahr−/−Rag1−/− mice. The q-value was generated by Cufflinks analysis as described in STAR Methods. *q<0.05, **q<0.01, ***q<0.001. (F) Scatterplot comparing the Log2 fold change (KO/WT) of ATAC-seq signals versus Log2 fold change (KO/WT) of RNA-seq signals. The r-value represents r-squared goodness of fit value for linear regression. (G) Global annotation of ATAC-seq peak locations in ILC2s and ILC3s from SI and LI of littermate Ahr+/+Rag1−/−(WT) or Ahr−/−Rag1−/− (KO) mice. (H) Annotation of differentially-expressed ATAC-seq peak locations in ILC2s and ILC3s from SI and LI of littermate Ahr+/+Rag1−/− (WT) or Ahr−/−Rag1−/− (KO) mice. See also Figures S3 and S4.
Figure 3.
Figure 3.. ILC2 function is enhanced in the absence of Ahr.
(A to G) FACS analyses of KLRG1 and GATA3 expression (A) and ST2 and GATA3 expression (C) after gating on Lin cells, and IL-5 and IL-13 expression (E) after gating on LinGATA3+ lamina propria lymphocytes (LPLs) in the small intestine (SI) and large intestine (LI) of Ahr+/+ or Ahr−/− littermate mice. Data are representative of five independent experiments. Absolute numbers of KLRG1-ILC2s (LinGATA3+KLRG1+) (B) and percentages of ST2+ (D), IL-5+ (F), and IL-13+ (G) cells in ILC2s (LinGATA3+) in the SI and LI of Ahr+/+ or Ahr−/− littermate mice. Data are shown as mean ± SEM (n=7–10 per group). (H to N) FACS analyses of KLRG1 and GATA3 expression (H) and ST2 and GATA3 expression (J) after gating on Lin cells, and IL-5 and IL-13 expression (L) after gating on LinGATA3+ LPLs in the SI and LI of Ahr+/+Rag1−/− or Ahr−/−Rag1−/− littermate mice. Data are representative of three independent experiments. Absolute numbers of KLRG1+ILC2s (Lin GATA3+KLRG1+) (I) and percentages of ST2+ (K), IL-5+ (M), and IL-13+ (N) cells in ILC2s (LinGATA3+) in the SI and LI of Ahr+/+Rag1−/− or Ahr−/−Rag1−/− littermate mice. Data are shown as mean ± SEM (n=6–8 per group). See also Figure S5.
Figure 4.
Figure 4.. Suppression of ILC2 function by Ahr is cell-intrinsic.
(A to E) Sorted small intestinal (SI) ILC2s (LinKLRG1+CD90+) from WT (Ahr+/+) (CD45.1/CD45.1) or KO (Ahr−/−) (CD45.2/CD45.2) age and sex-matched mice were mixed equally (20,000 cells in total) and transferred into Rag2−/−Il2rg−/− littermate recipient mice. Experimental design (A), and FACS analyses of CD45.1 and GATA3 expression (upper), ST2 and GATA3 expression (middle), and IL-5 and IL-13 expression (bottom) after gating on indicated populations (B). Data are representative of two independent experiments. Percentages of ST2+ (C), IL-5+ (D), and IL-13+ (E) cells in recovered WT or KO ILC2s (LinGATA3+). Data are shown as mean ± SEM (n=3 per group). (F to K) RFP+ ILC2s (Lin KLRG1+RFP+) were sorted from Ahrf/f Il5RFP-Cre or littermate Ahr+/+ Il5RFP-Cre mice. FACS analyses of Ahr expression (F), ST2 and GATA3 expression (G), and IL-5 and IL-13 expression (I) after gating on sorted RFP+ ILC2. Data are representative of two independent experiments. Percentages of ST2+ (H), IL-5+ (J), and IL-13+ (K) cells in sorted RFP+ ILC2s (LinGATA3+). Data are shown as mean ± SEM (n=3 per group). (L and M) Deletion of Ahr in vitro by retroviral expression of Cre-recombinase in ILC2s. Experimental design (L), and FACS analyses of Thy1.1 and SSC (left) after gating on ILC2s (LinGATA3+), and ST2, IL-5, IL-13, and Ahr expression after gating on Thy1.1+ (Cre+) or Thy1.1 (Cre) ILC2s (M). Data are representative of two independent experiments. See also Figures S6 and S7.
Figure 5.
Figure 5.. Ahr negatively regulates ILC2 function through IL-33-ST2 pathway and suppresses Gfi1 recruitment to the Il1rl1 locus.
(A to F) FACS analyses of ST2 and GATA3 expression after gating on Lin cells (A), and IL-5 and IL-13 expression after gating on LinGATA3+ cells (D) in the small intestine (SI) and large intestine (LI) of littermate mice of indicated genotypes. Data are representative of nine independent experiments. Absolute numbers of ILC2s (LinGATA3+) (B), percentages of ST2+ (C), IL-5+ (E), and IL-13+ (F) cells in ILC2s (LinGATA3+) in SI and LI of littermate mice of indicated genotypes (Ctrl: Ahr+/+ or Ahr+/−; IL-33 KO: Il33−/−; Ahr KO: Ahr−/−; DKO: Ahr−/−Il33−/−). Data are shown as mean ± SEM (n=7–12 per group). (G) mRNA of Gfi1 in ILC2s of littermate Ahr+/+ or Ahr−/− mice was determined by realtime RT-PCR. Data are representative of two independent experiments, and are shown as mean ± SEM (n=3). (H) Gfi1-binding sites at the Il1rl1 locus identified by ChIP-seq. (I and J) ILC2s from LI of littermate Ahr+/+ or Ahr−/− mice were expanded in vitro, and subjected to Gfi1 or Ahr ChIP assay. Enrichment of Gfi1 (I) or Ahr (J) at the Il1rl1 locus was determined by real-time PCR. Data are representative of two independent experiments, and are shown as mean ± SEM (n=3). Rabbit IgG isotype antibody was used as a negative control.
Figure 6.
Figure 6.. Ahr deficiency leads to better control of helminth infection with enhanced ILC2 immunity.
Littermate Ahr+/+ and Ahr−/− (A and B), or Ahr+/+Rag1−/− and Ahr−/−Rag1−/− (C to I) mice were inoculated with infective H. polygyrus bakeri larvae. Adult worms in the small intestines (SI) of Ahr+/+ and Ahr−/− mice (A), or Ahr+/+Rag1−/− and Ahr−/−Rag1−/− mice (C), and eggs in the feces of Ahr+/+ and Ahr−/− mice (B), or Ahr+/+Rag1−/− and Ahr−/− Rag1−/− mice (D) were counted at 12 days after inoculation. Data are shown as mean ± SEM (n=19 for Ahr+/+ or Ahr+/+Rag1−/−; n=11 for Ahr−/−; n=10 for Ahr−/−Rag1−/−). (E to I) Absolute numbers of ILC2s (LinGATA3+) (E), IL-5+ ILC2s (F), IL-13+ ILC2s (G), and eosinophils (CD11cCD11b+SiglecF+SSChi) (H) in the small intestine (SI) of Ahr+/+Rag1−/− and Ahr−/−Rag1−/− mice. mRNA of Relmb in the proximal part of SI from Ahr+/+Rag1−/− and Ahr−/−Rag1−/− mice (I). Data are shown as mean ± SEM (n=5 per group). (J to Q) SI ILC2s (1 × 10⁵) sorted from Ahr+/+Rag1−/− or Ahr−/−Rag1−/− littermate mice were transferred into Rag2−/−Il2rg−/− littermate mice respectively. Two days after transfer, these mice were inoculated with infective H. polygyrus bakeri larvae, and the mice were analyzed 12 days post infection. Experimental design (J), and the adult worm counts in SI (K), eggs in the feces (L) of Rag2−/−Il2rg−/− mice without ILC2s transfer or receiving ILC2s from Ahr+/+Rag1−/− (WT) or Ahr−/−Rag1−/− (KO) mice. Absolute numbers of ILC2s (LinGATA3+) (M), IL-5+ ILC2s (N), IL-13+ ILC2s (O), and eosinophils (P) in SI of indicated mice. mRNA of Relmb in the proximal part of SI from indicated mice determined by realtime RT-PCR (Q). Data are shown as mean ± SEM (n=4 per group).
Figure 7.
Figure 7.. Activation of Ahr suppresses ILC2s but enhances ILC3s to protect the host from C. rodentium infection.
(A) FACS analysis of GATA3 and RORγt expression by Lin LPLs in the small intestine (SI) and large intestine (LI) of Ahr+/+ or AhrdCAIR/+ littermate mice. Data are representative of two independent experiments. Percentages of ILC3s (LinRORγt+) (B) and ILC2s (LinGATA3+) (D) in LinSI and LI LPLs of Ahr+/+ or AhrdCAIR/+ littermate mice. Absolute numbers of ILC3s (LinRORγt+) (C) and ILC2s (LinGATA3+) (E). Data are shown as mean ± SEM (n=4–6 per group). (F) FACS analysis of ST2 and GATA3 expression after gating on Lin cells in SI and LI of Ahr+/+ or AhrdCAIR/+ littermate mice. Data are representative of two independent experiments. (G) Percentage of ST2+ cells in ILC2s (LinGATA3+) of SI and LI of Ahr+/+ or AhrdCAIR/+ littermate mice. Data are shown as mean ± SEM (n=4–6 per group). (H and I) AhrCAIR/CAIR or AhrCAIR/CAIRRorc-cre mice were inoculated with C. rodentium. (H) Body weight changes were monitored at the indicated time points. (I) Bacterial counts (CFU) were measured at day 5 or day 9 after inoculation and normalized to per gram of feces. Data are shown as mean ± SEM (n=6 for AhrCAIR/CAIR, n=5 for AhrCAIR/CAIRRorc-cre).

References

    1. Anders S, Pyl PT, and Huber W (2015). HTSeq--a Python framework to work with high-throughput sequencing data. Bioinformatics 31, 166–169. - PMC - PubMed
    1. Artis D, and Spits H (2015). The biology of innate lymphoid cells. Nature 517, 293–301. - PubMed
    1. Artis D, Wang ML, Keilbaugh SA, He W, Brenes M, Swain GP, Knight PA, Donaldson DD, Lazar MA, Miller HR, et al. (2004). RELMbeta/FIZZ2 is a goblet cell-specific immune-effector molecule in the gastrointestinal tract. Proceedings of the National Academy of Sciences of the United States of America 101, 13596–13600. - PMC - PubMed
    1. Bjorklund AK, Forkel M, Picelli S, Konya V, Theorell J, Friberg D, Sandberg R, and Mjosberg J (2016). The heterogeneity of human CD127(+) innate lymphoid cells revealed by single-cell RNA sequencing. Nat Immunol 17, 451–460. - PubMed
    1. Buenrostro JD, Giresi PG, Zaba LC, Chang HY, and Greenleaf WJ (2013). Transposition of native chromatin for fast and sensitive epigenomic profiling of open chromatin, DNA-binding proteins and nucleosome position. Nature methods 10, 1213–1218. - PMC - PubMed

Publication types

MeSH terms