. 2018 Dec 3;150(12):1660-1675.
doi: 10.1085/jgp.201812179. Epub 2018 Nov 16.

TREK-1 channels regulate pressure sensitivity and calcium signaling in trabecular meshwork cells

Affiliations

TREK-1 channels regulate pressure sensitivity and calcium signaling in trabecular meshwork cells

Oleg Yarishkin et al. J Gen Physiol. .

Abstract

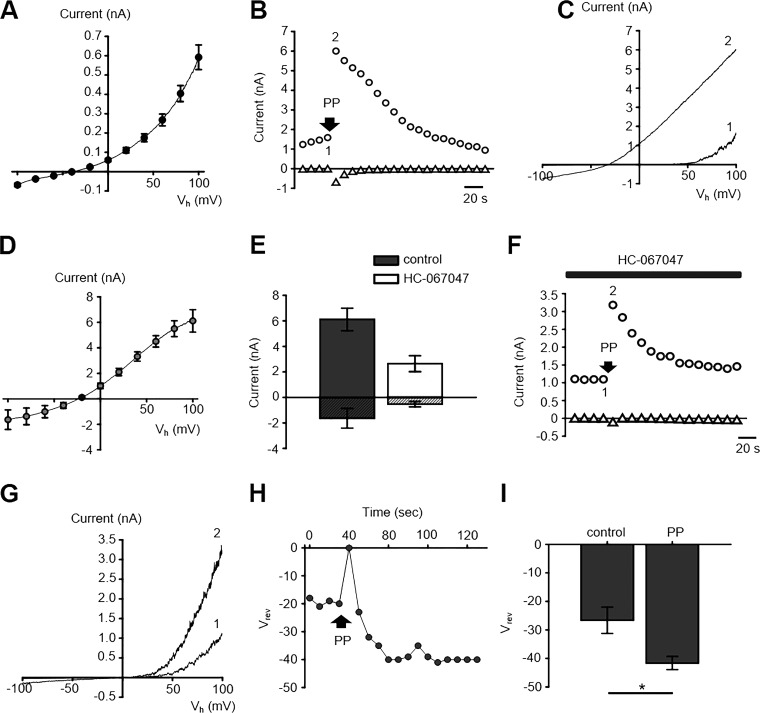
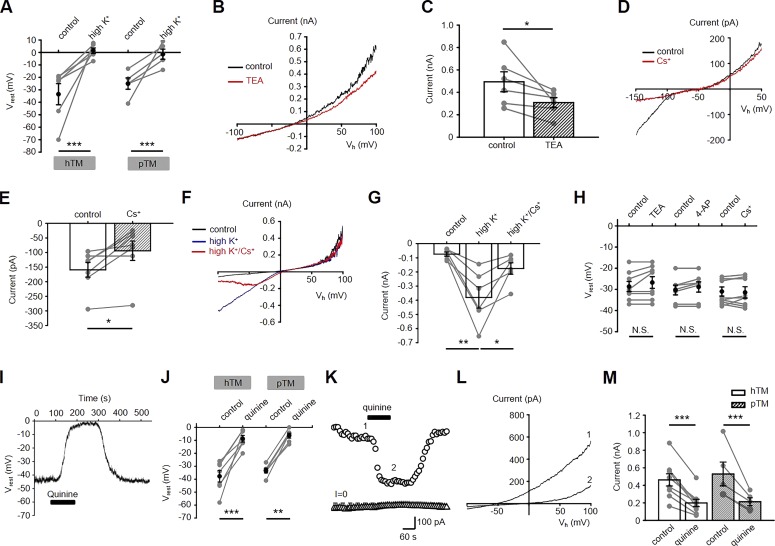
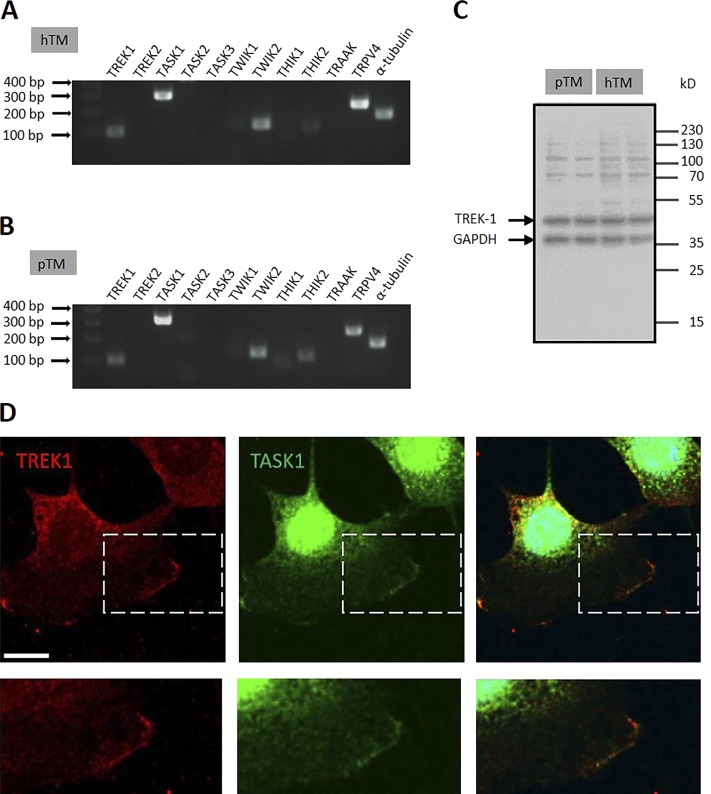
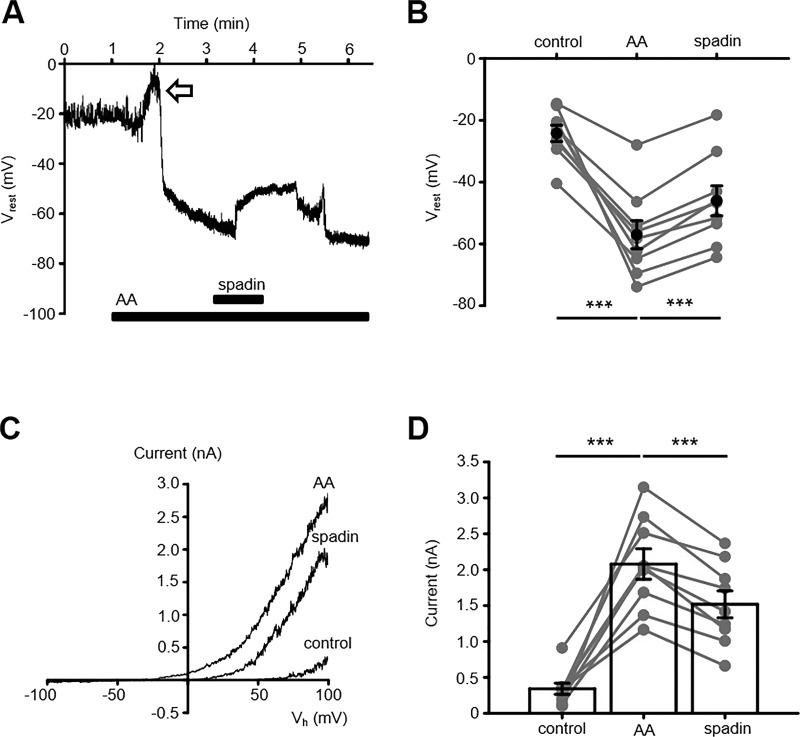
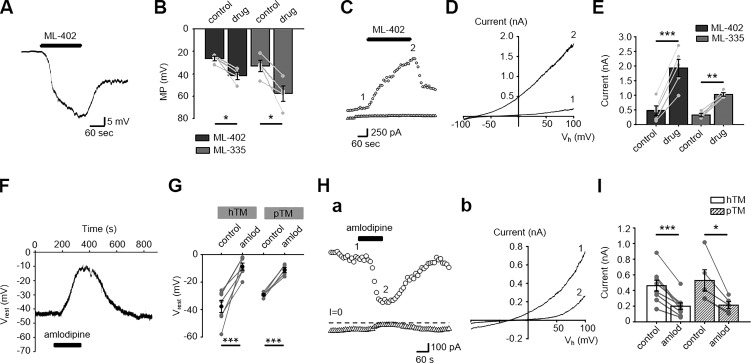
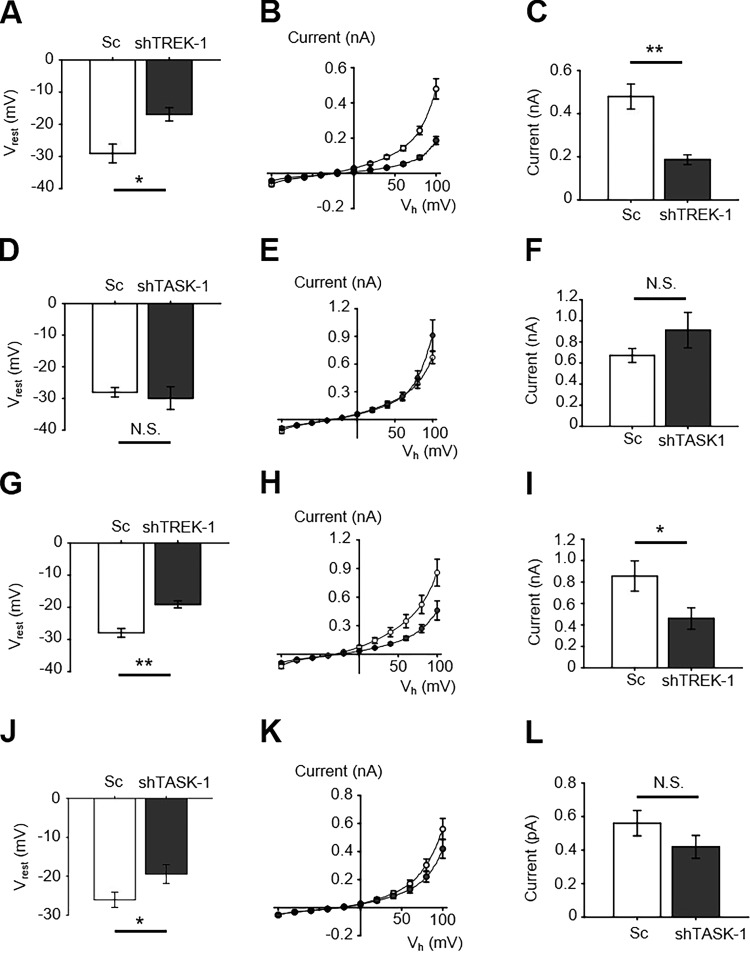
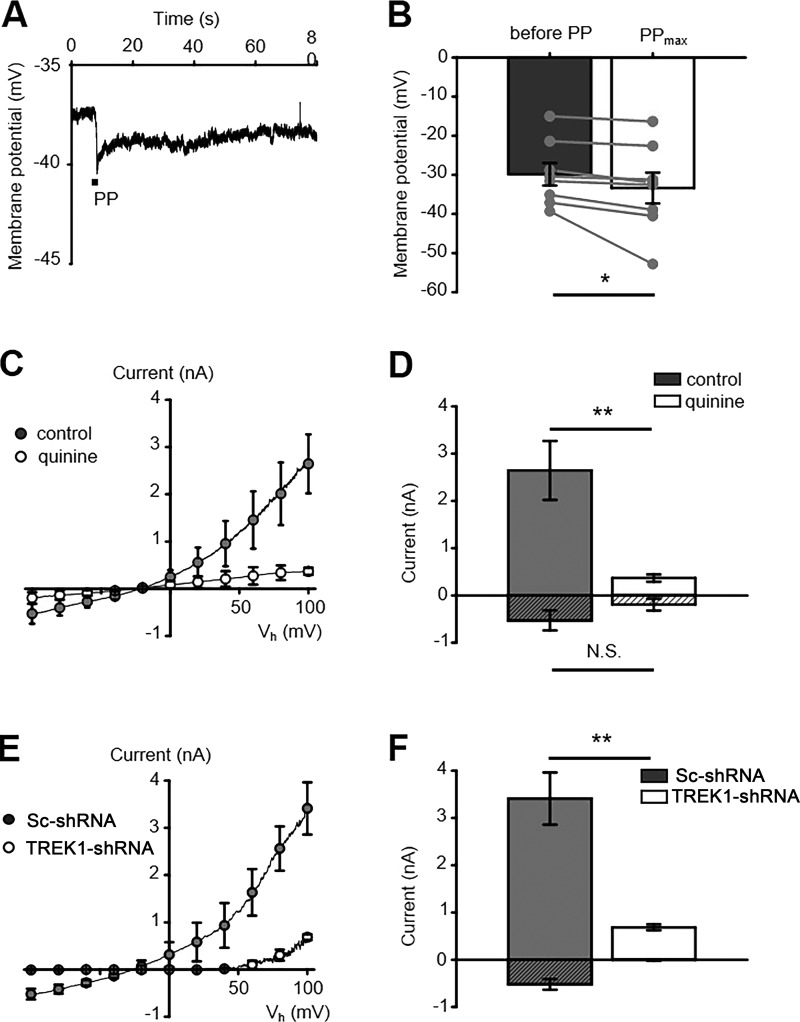
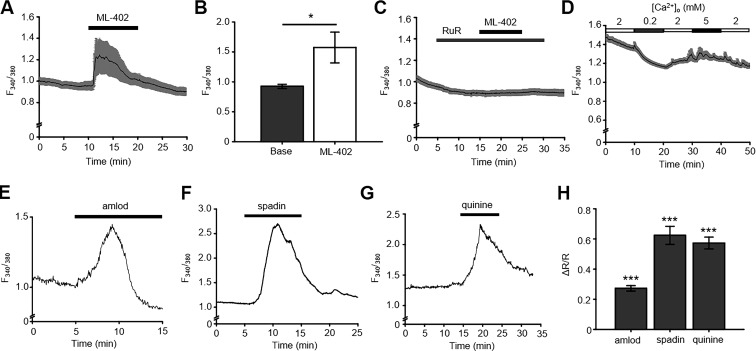
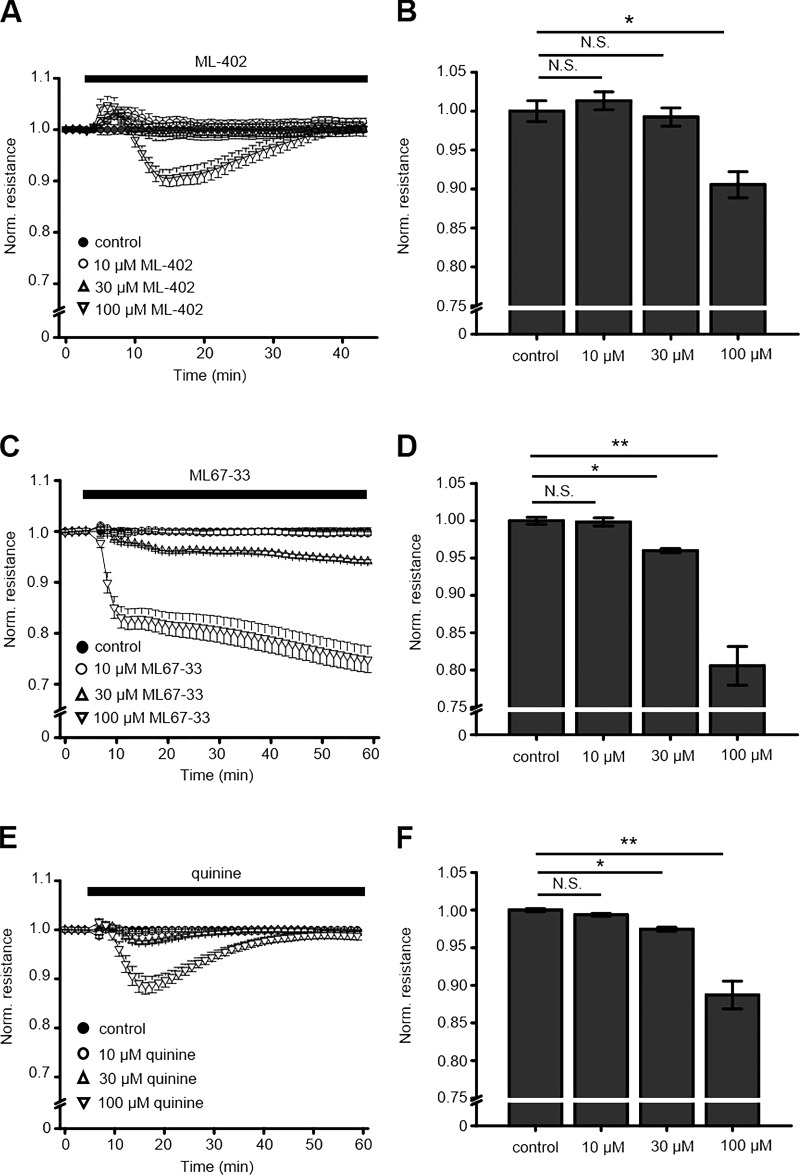
Mechanotransduction by the trabecular meshwork (TM) is an essential component of intraocular pressure regulation in the vertebrate eye. This process is compromised in glaucoma but is poorly understood. In this study, we identify transient receptor potential vanilloid isoform 4 (TRPV4) and TWIK-related potassium channel-1 (TREK-1) as key molecular determinants of TM membrane potential, pressure sensitivity, calcium homeostasis, and transcellular permeability. We show that resting membrane potential in human TM cells is unaffected by "classical" inhibitors of voltage-activated, calcium-activated, and inwardly rectifying potassium channels but is depolarized by blockers of tandem-pore K+ channels. Using gene profiling, we reveal the presence of TREK-1, TASK-1, TWIK-2, and THIK transcripts in TM cells. Pressure stimuli, arachidonic acid, and TREK-1 activators hyperpolarize these cells, effects that are antagonized by quinine, amlodipine, spadin, and short-hairpin RNA-mediated knockdown of TREK-1 but not TASK-1. Activation and inhibition of TREK-1 modulates [Ca2+]TM and lowers the impedance of cell monolayers. Together, these results suggest that tensile homeostasis in the TM may be regulated by balanced, pressure-dependent activation of TRPV4 and TREK-1 mechanotransducers.


Figures

Figure 1.
Figure 1.
Pressure-sensitive currents in TM cells involve a distinct type of mechanogated ion channels. (A) I-V relationship of the whole-cell transmembrane conductance in TM cells; n = 26 cells. (B) Time course of pressure-sensitive currents. Pressure pulse (PP; 3-s duration) was applied at the time point indicated by an arrow. Shown are currents recorded at the holding potential (Vh) of −100 mV (triangles) and +100 mV (circles). (C) The I-V relationship of currents at time points indicated by the corresponding numbers in B. (D) Averaged I-V relationship of pressure-induced currents (n = 5) obtained by subtracting current recorded before PP from the peak response. (E) HC-067047 attenuates the pressure-induced current amplitude. Currents evoked at Vh = 100 mV and −100 mV are shown as open and patterned bars, respectively. (F) PP step (15 mm Hg; 3 s) in the presence of HC-067047 induces a small transient increase in the inward current and large outward current. Pressure application is denoted by arrow. (G) I-V relationship corresponding to the numeric markers in F. Pressure stimuli significantly increase the amplitude of outwardly rectifying current. (H) Representative time course of the pressure dependence of the membrane potential in the presence of HC-067047. PP transiently depolarizes the cell, an effect followed by sustained hyperpolarization. (I) Bar graphs summarizing results shown in H. Pair-sample t test, n = 5. Shown in A, D, E, and I are the mean ± SEM values. *, P < 0.05.
Figure 2.
Figure 2.
Vrest of TM cells is largely mediated by K2P channels. (A) High K+ depolarizes the membrane potential in hTM and pTM cells. Pair-sample t test, n = 6 cells for hTM and n = 5 for pTM. Gray symbols, individual values of Vrest; black symbols, averaged data. (B) Representative traces showing the modest inhibitory effect of TEA (5 mM) on the outward current. (C) Averaged data for the effect of TEA on currents at Vh = +100 mV. Pair-sample t test, n = 6. (D) Cs+ (1 mM) inhibits the hyperpolarization-activated whole-cell current. (E) Averaged data for the effect of Cs+ on currents at Vh = −100 mV. Pair-sample t test, n = 7. (F) The inwardly rectifying K+ conductance is facilitated by high K+, with the facilitated component sensitive to Cs+ (1 mM). (G) Bar graphs summarizing the results shown in F. Pair-sample t test, n = 6 cells. (H) TEA (5 mM), 4-AP (1 mM), and Cs+ (1 mM) have no effect on Vrest. The gray symbols indicate individual values of Vrest. Pair-sample t test, n = 8, n = 8, and n = 7 for TEA, 4-AP, and Cs+ plots, respectively. (I) Representative trace demonstrating that Vrest is abrogated by quinine. (J) Quantification of quinine-evoked effects on Vrest in hTM and pTM cells. Gray symbols indicate individual Vrest values, black symbols show the means with ±SEM. Pair-sample t test, n = 8 for hTM; n = 9 for pTM. (K) Representative time course of quinine-induced inhibition of the whole-cell current at Vh = −100 mV (triangles) and +100 mV (circles). (L) Current traces corresponding to the time courses marked in K. (M) Averaged hTM and pTM data for quinine-evoked inhibition of whole-cell currents at Vh = +100 mV. Pair-sample t test, n = 9 and n = 5 for hTM and pTM cells, respectively. Shown in A, C, E, G, H, J, and M are the mean ± SEM values. N.S., P > 0.05; *, P > 0.05; **, P > 0.01; ***, P > 0.001.
Figure 3.
Figure 3.
TM cells express K2P transcripts and proteins. (A and B) Semiquantitative RT-PCR from hTM and pTM cells. K2P mRNA expression patterns reveal the presence of TREK-1, TASK-1, TWIK-2, and THIK-2 mRNAs, and strong expression of TRPV4 together with the reference α-tubulin mRNA (representative of two to three experiments). (C) Western blots from hTM and pTM samples show the expression of TREK-1 protein. (D) Immunocytochemistry; hTM cells double-labeled for TREK-1 and TASK-1. Upper panel: TREK-1 (Alexa Fluor 594 nm) and TASK-1 (Alexa Fluor 488 nm) are localized to the plasma membrane. Lower panel: Magnified images of the regions shown in the upper panel.
Figure 4.
Figure 4.
TM membrane potential is potently modulated by arachidonate-activated currents. (A) Current clamp, hTM cells superfused with the TRPV4 blocker HC-067047 (2 µM). AA transiently depolarizes the cell, an effect followed by sustained hyperpolarization that is partially and reversibly antagonized by spadin (1 µM). (B) Quantification of experiments shown in A at 3 min after AA application. The black symbols show the mean ± SEM. Pair-sample t test, n = 9 cells.(C) The I-V relationship of the AA-evoked current shows an increase in the outward conductance that is sensitive to spadin. (D) Data summary for the experiments shown in C. The black symbols show the mean ± SEM values of currents recorded at +100 mV. Pair-sample t test, n = 9 cells. ***, P < 0.001 in C and D.
Figure 5.
Figure 5.
Vrest and transmembrane conductance are a function of TREK-1 activation. (A) Current clamp, hTM cells. The selective TREK-1 agonist ML-402 evoked a rapid and large hyperpolarization. (B) Quantification of the effects of ML-402 and ML-335 on the membrane potential. Pair-sample t test. n = 4 and n = 4 for ML-402 and ML-335, respectively. (C) Voltage clamp. Representative time course of the whole-cell current evoked by the TREK-1 agonist ML-402 (40 µM) at Vh = −100 mV (triangles) and +100 mV (circles). (D) I-V relationship for the currents recorded in C shows dramatic potentiation of the outward conductance. (E) Averaged data for the ML-402 and ML-335 effect on the whole-cell current. Pair-sample t test; n = 5 cells and n = 4 cells for ML-402 and ML-335, respectively. (F) Current clamp. The TREK-1 blocker amlodipine depolarizes the hTM membrane potential. (G) Data summary for the amlodipine effect in hTM and pTM cells. Pair-sample t test; n = 7 and n = 5 for hTM and pTM, respectively. (H) Voltage clamp, hTM. The time course and the I-V relationship of amlodipine modulation of the whole-cell current. Current amplitudes at Vh = −100 mV (triangles) and +100 mV (circles; a); traces corresponding to indicated time points (b). (I) Data summary for amlodipine-induced suppression of the steady-state TM current. Shown are mean ± SEM values for the holding potential of +100 mV paired t test. n = 9 cells and n = 5 cells for hTM and pTM, respectively. Shown in B, E, G, and I are the mean ± SEM values. *, P < 0.05, ***, P < 0.001.
Figure 6.
Figure 6.
TREK-1 but not TASK-1 knockdown suppresses the transmembrane conductance and depolarizes Vrest in hTM cells. (A) Current clamp, hTM cells. Averaged Vrest values in cells transfected with scrambled (Sc) shRNA (n = 12 cells) or TREK-1 shRNA (shTREK-1; n = 10cells); two-sample t test. (B) Voltage clamp. Averaged I-V relationship for cells transfected with Sc (n = 12 cells; open circles) or shTREK-1 (n = 10 cells; closed circles). (C) Quantification of the TREK-1 dependence of the steady-state current. The current amplitude was significantly reduced by TREK-1 knockdown (n = 12 cells and n = 10 cells for Sc- and shTREK-1 cohorts, respectively). (D) Current clamp. Averaged Vrest values in cells transfected with scrambled (Sc) shRNA (Sc; n = 10) or TASK-1 shRNA (shTASK-1; n = 10), shown as mean ± SEM. P > 0.05, two-sample t test. (E) Voltage clamp. Averaged I-V relationship for cells transfected with Sc (n = 10) or shTASK-1 (n = 10). (F) Quantification of TASK-1 dependence of the steady-state current in hTM cells. The whole-cell current amplitude was unaffected by TASK-1 knockdown. P > 0.05, two-sample t test. (G) Current clamp, pTM. Averaged Vrest for Sc-shRNA (n = 11) and TREK-1 shRNA (shTREK-1; n = 11) transfected pTM cells, with mean ± SEM. *, P < 0.05, two-sample t test. (H) Voltage clamp. Averaged I-V curve for Sc (n = 11) and shTREK-1 (n = 11) transfected cells. (I) Quantification of TREK-1 dependence of the steady-state current in pTM cells (n = 11 and 11 cells for Sc and shTREK-1 cohorts, respectively). *, P < 0.05, two-sample t test. (J) Current clamp, pTM. Averaged I-V curve for Sc (n = 20 cells) and TASK-1 shRNA (n = 22 cells) transfected cells. Two-sample t test. (K) Voltage clamp. Averaged I-V curve for Sc (n = 20 cells) and shTASK-1 (n = 22 cells) transfected pTM cells. (L) Quantification of TASK-1 dependence of the steady-state current in pTM cells. n = 20 cells and n = 22 cells for scrambled control and shTASK-1 cohorts, respectively. Two-sample t test. Shown in A–L are the mean ± SEM. N.S., P > 0.05; *, P < 0.05; **, P < 0.01..
Figure 7.
Figure 7.
TREK-1 is a principal TM mechanotransducer. (A) Representative current-clamp recording in the presence of HC067047. Pressure pulse (PP, 2 s, 15 mm Hg) hyperpolarizes the membrane potential. (B) Quantification of experiments from A. n = 8 pair-sample t test. (C) Voltage clamp, pTM. The I-V relationship for pressure-induced currents in control (gray circles) and quinine-treated (white circles) cells shows that the pan-K2P blocker induces a significant reduction in the amplitude of the pressure-evoked current. (D) Averaged amplitude of pressure-induced currents at Vh = −100 mV (patterned bars) and 100 mV (open bars) for control and quinine-treated cells. Two-sample t test, n = 5 cells and n = 6 cells for control and quinine-treated cohorts, respectively. (E) pTM. TREK-1 but not Sc shRNA reduces the amplitude of pressure-induced currents. (F) Quantification of pressure-evoked currents at Vh = −100 mV (patterned bars) and +100 mV (open bars) in cells transfected with Sc and TREK-1 shRNA. Two-sample t test, n = 11 cells and n = 11 cells for Sc and TREK-1 shRNA cohorts, respectively. Shown in B–D are the mean ± SEM values. N.S., P > 0.05; *, P < 0.05; **, P < 0.01.
Figure 8.
Figure 8.
TREK-1 activation and inhibition is coupled to TM Ca2+ homeostasis. (A) Fura-2 AM loaded hTM cells. The TREK activator ML-402 (40 µM) evokes sustained elevation in [Ca2+]i (n = 27 cells; pooled responses from 23 responders and 4 nonresponders in the field of view). (B) Bar graphs summarizing the experiments in A. Pair-sample t test. (C) ML-402–evoked [Ca2+]i elevations are abolished by RuR (10 µM; n = 28 cells). (D) [Ca2+]i is a function of the driving force for Ca2+ influx. F340/380 ratios are plotted as extracellular Ca2+ concentrations. [Ca2+]o were altered between 0.2 and 5 mM. (E–G) Representative F340/380 traces illustrating effects of TREK-1 inhibitors amlodipine, spadin, and quinine, respectively, on [Ca2+]i. (H) Summary of the data shown in E–G. n > 60 cells for each group. Shown in A–D and H are the mean ± SEM values. *, P < 0.05; ***, P < 0.001..
Figure 9.
Figure 9.
TREK-1 modulates cell–ECM interactions. (A and C) Time courses of hTM monolayer impedance in the presence of TREK-1 agonists ML-402 and ML67-33. TREK-1 activation dose-dependently decreases monolayer impedance. (B and D) Quantification of results shown in A and C (n = 2–3). (E) Quinine dose-dependently lowers the TM monolayer impedance. (F) Summary of results shown in E. Two-sample t test. Shown in A–F are the mean ± SEM values. N.S., P > 0.05; *, P < 0.05; **, P < 0.01.

Comment in

Similar articles

Cited by

References

    1. Abad E., Lorente G., Gavara N., Morales M., Gual A., and Gasull X.. 2008. Activation of store-operated Ca(2+) channels in trabecular meshwork cells. Invest. Ophthalmol. Vis. Sci. 49:677–686. 10.1167/iovs.07-1080 - DOI - PubMed
    1. Acott T.S., Kelley M.J., Keller K.E., Vranka J.A., Abu-Hassan D.W., Li X., Aga M., and Bradley J.M.. 2014. Intraocular pressure homeostasis: maintaining balance in a high-pressure environment. J. Ocul. Pharmacol. Ther. 30:94–101. 10.1089/jop.2013.0185 - DOI - PMC - PubMed
    1. Alloui A., Zimmermann K., Mamet J., Duprat F., Noël J., Chemin J., Guy N., Blondeau N., Voilley N., Rubat-Coudert C., et al. . 2006. TREK-1, a K+ channel involved in polymodal pain perception. EMBO J. 25:2368–2376. 10.1038/sj.emboj.7601116 - DOI - PMC - PubMed
    1. Anishkin A., Loukin S.H., Teng J., and Kung C.. 2014. Feeling the hidden mechanical forces in lipid bilayer is an original sense. Proc. Natl. Acad. Sci. USA. 111:7898–7905. 10.1073/pnas.1313364111 - DOI - PMC - PubMed
    1. Baker S.A., Hatton W.J., Han J., Hennig G.W., Britton F.C., and Koh S.D.. 2010. Role of TREK-1 potassium channel in bladder overactivity after partial bladder outlet obstruction in mouse. J. Urol. 183:793–800. 10.1016/j.juro.2009.09.079 - DOI - PubMed

Publication types

Substances