. 2019 Jan 16;39(3):557-575.
doi: 10.1523/JNEUROSCI.0719-17.2018. Epub 2018 Nov 16.

A Proposed Mechanism for Spontaneous Transitions between Interictal and Ictal Activity

Affiliations

A Proposed Mechanism for Spontaneous Transitions between Interictal and Ictal Activity

Theju Jacob et al. J Neurosci. .

Abstract

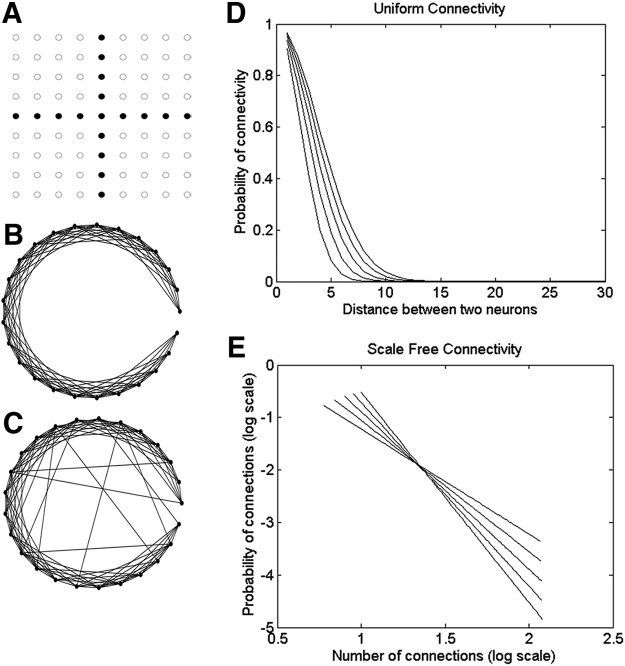
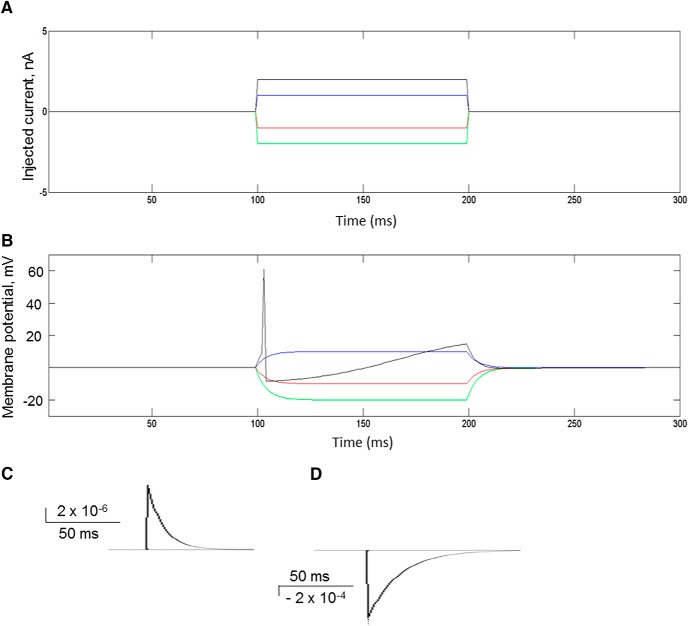
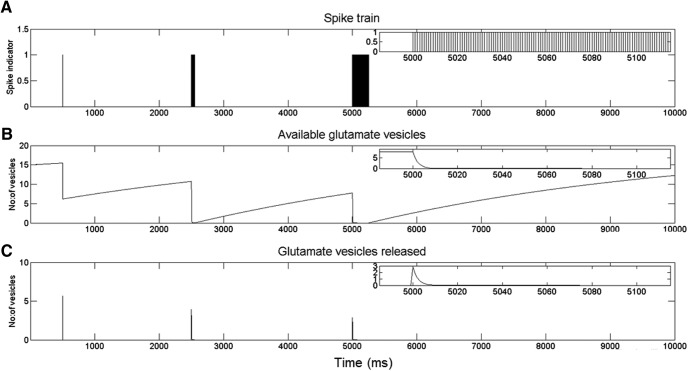
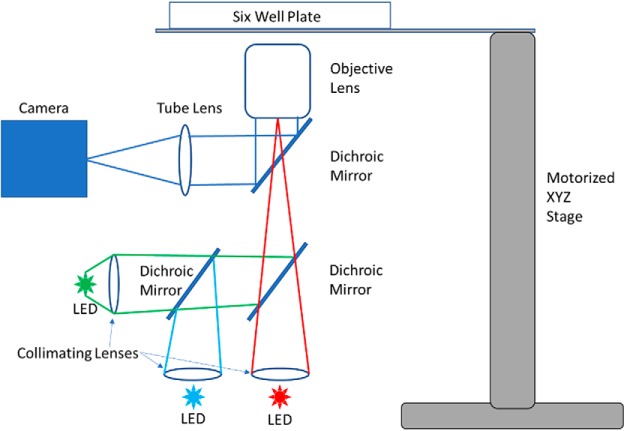
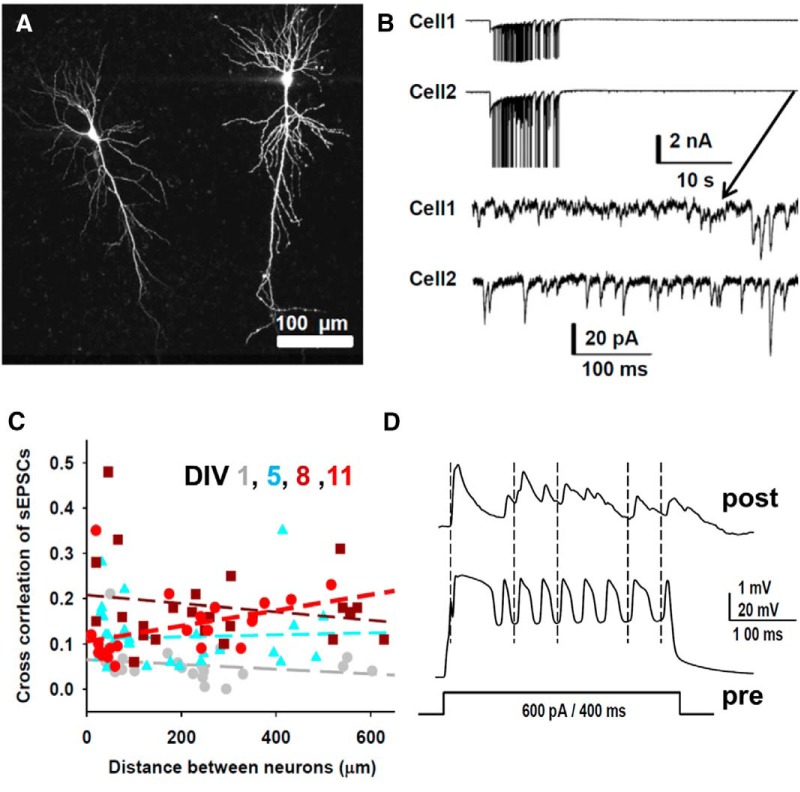
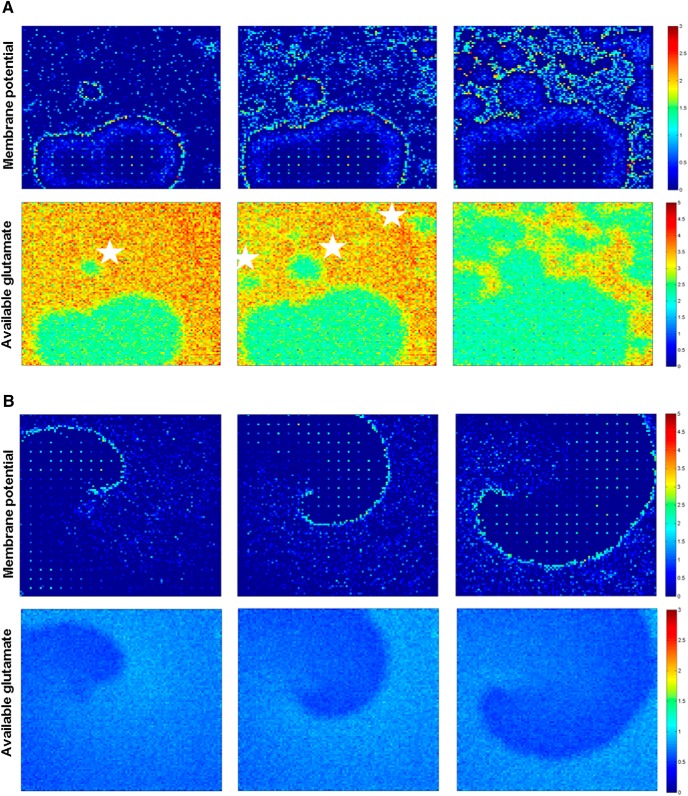
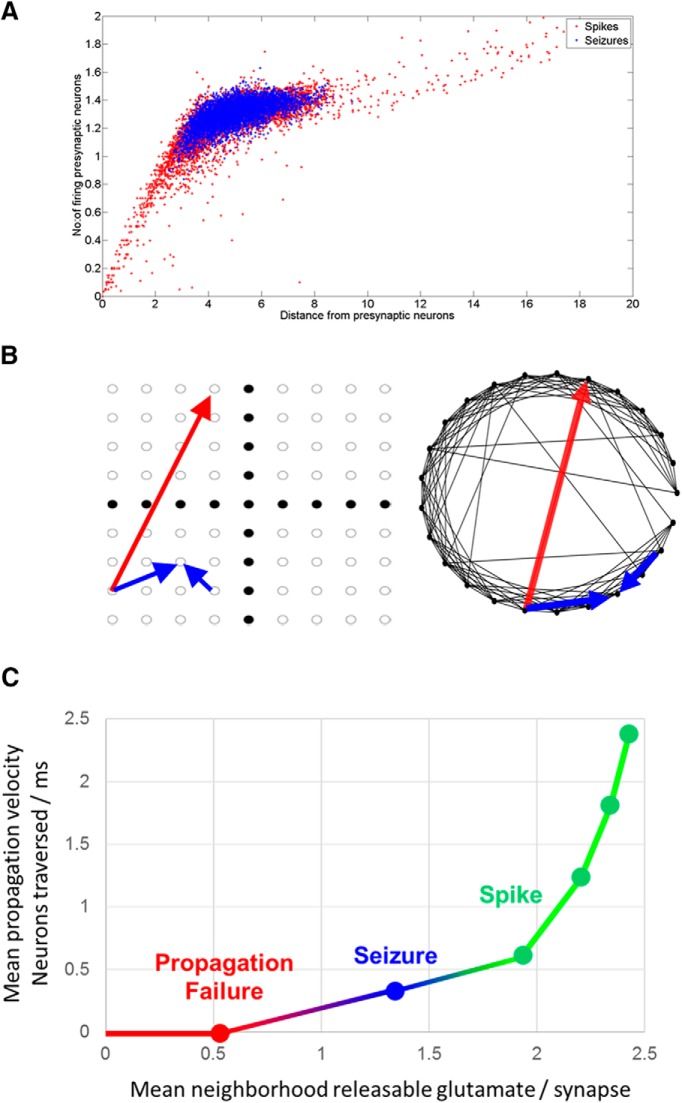
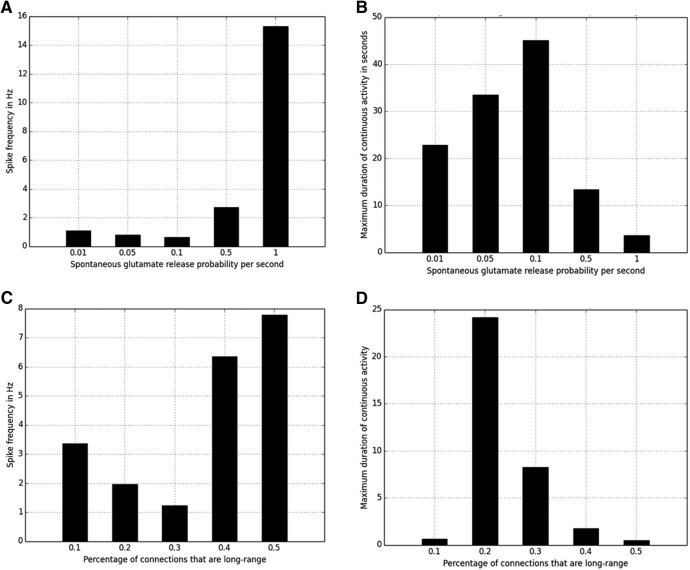
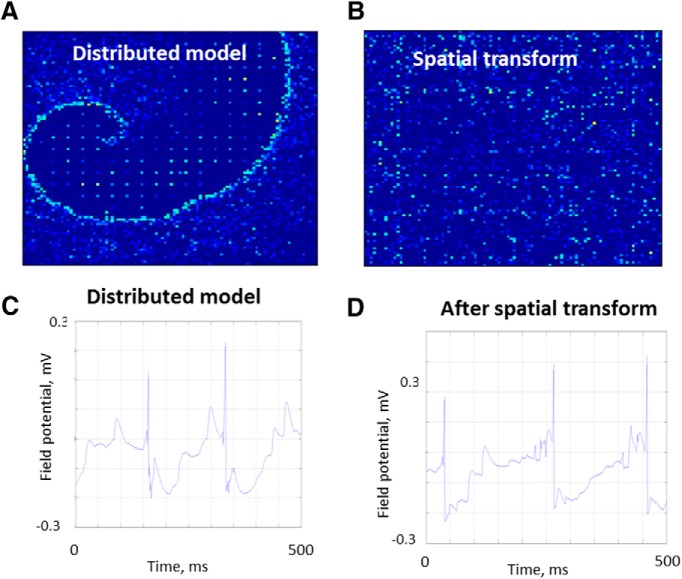
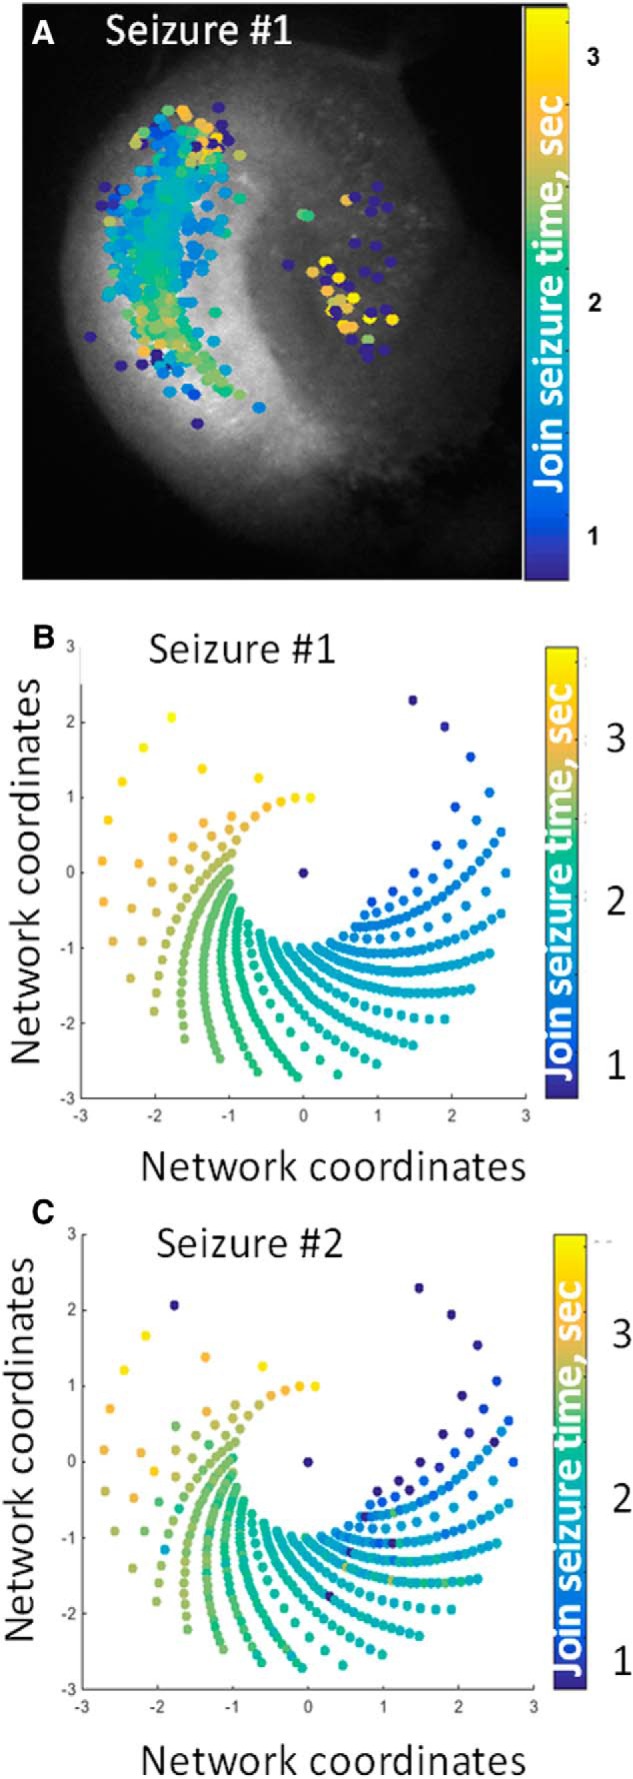
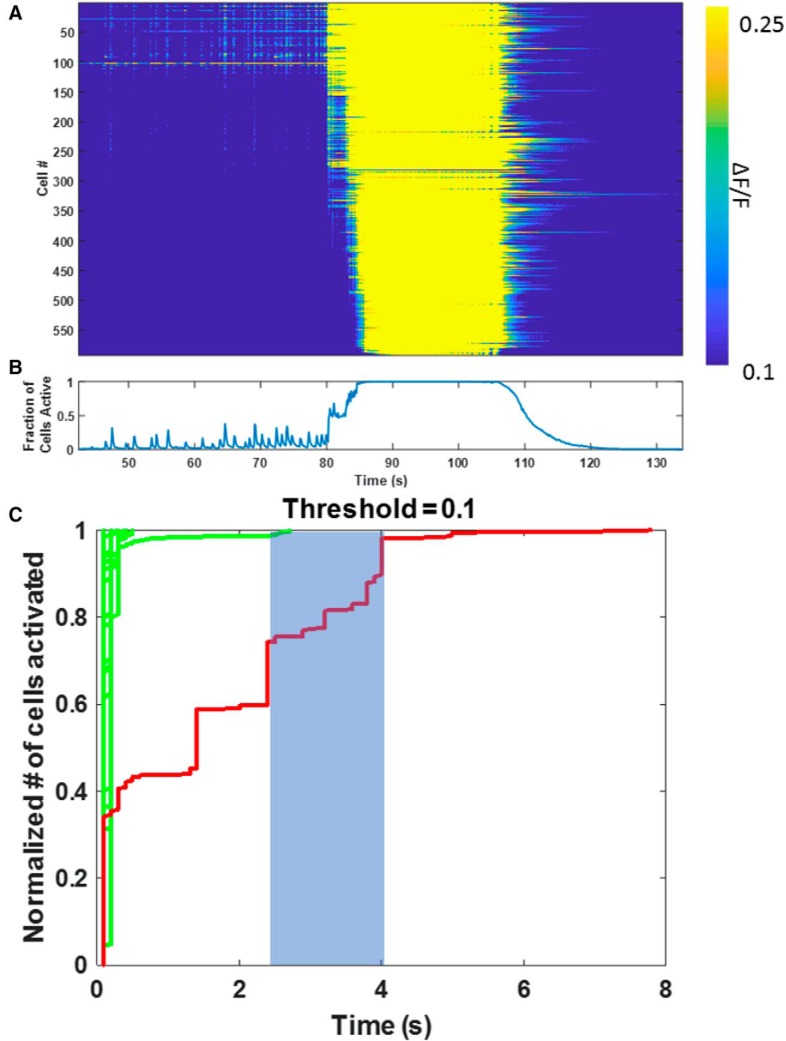
Epileptic networks are characterized by two outputs: brief interictal spikes and rarer, more prolonged seizures. Although either output state is readily modeled in silico and induced experimentally, the transition mechanisms are unknown, in part because no models exhibit both output states spontaneously. In silico small-world neural networks were built using single-compartment neurons whose physiological parameters were derived from dual whole-cell recordings of pyramidal cells in organotypic hippocampal slice cultures that were generating spontaneous seizure-like activity. In silico, neurons were connected by abundant local synapses and rare long-distance synapses. Activity-dependent synaptic depression and gradual recovery delimited synchronous activity. Full synaptic recovery engendered interictal population spikes that spread via long-distance synapses. When synaptic recovery was incomplete, postsynaptic neurons required coincident activation of multiple presynaptic terminals to reach firing threshold. Only local connections were sufficiently dense to spread activity under these conditions. This coalesced network activity into traveling waves whose velocity varied with synaptic recovery. Seizures were comprised of sustained traveling waves that were similar to those recorded during experimental and human neocortical seizures. Sustained traveling waves occurred only when wave velocity, network dimensions, and the rate of synaptic recovery enabled wave reentry into previously depressed areas at precisely ictogenic levels of synaptic recovery. Wide-field, cellular-resolution GCamP7b calcium imaging demonstrated similar initial patterns of activation in the hippocampus, although the anatomical distribution of traveling waves of synaptic activation was altered by the pattern of synaptic connectivity in the organotypic hippocampal cultures.SIGNIFICANCE STATEMENT When computerized distributed neural network models are required to generate both features of epileptic networks (i.e., spontaneous interictal population spikes and seizures), the network structure is substantially constrained. These constraints provide important new hypotheses regarding the nature of epileptic networks and mechanisms of seizure onset.

Keywords: epilepsy; ictogenesis; model; propagation; seizure; wavefront.


Figures

Figure 1.
Figure 1.
Network architectures. A, Example of a fraction of the 100 × 100 neuron network. Black nodes represent inhibitory neurons. White nodes represent excitatory neurons. Connections between neurons depend on connectivity pattern adopted. However, there are no recurrent connections between inhibitory neurons. B, C, Differences in uniform versus small-world connectivity patterns. A circular distribution of neurons is used for purposes of illustration. B, Uniform connectivity model, where the connection probability drops exponentially with distance (measured in numbers of neurons from source). C, Small-world connectivity model where 10% of connections are long range. D, Connection probability versus distance for the uniformly connected networks that were tested. E, Scale-free network curves that were tested, showing the number of connections versus number of neurons in log scale.
Figure 2.
Figure 2.
A, Injected current pulse. B, Response of a single excitatory neuron to injected current pulses in (A). C, D, Excitatory and inhibitory response curves of the excitatory neurons in response to synaptic release of a single transmitter vesicle.
Figure 3.
Figure 3.
Activity-dependent depression and recovery of synaptic responses. The response of a synapse to incoming spike trains of varying durations and timing is shown. The synapse has 20 releasable glutamate vesicles (NRmax = 20). At t = 0, there are 15 vesicles available for release, so NR(0) = 15. A, The pattern of incoming action potentials to the axon terminal. Insets, Activity at an expanded time scale. B, Glutamate available for release at the synapse after transmitter release based on the action potentials in A. C, The number of glutamate vesicles released at the synapse in response to the incoming spike train.
Figure 4.
Figure 4.
Schematic of imaging system. A custom microscope built inside a CO2 incubator comprises LED excitation light sources, a camera, a 4× 0.5 NA objective, and a motorized 3-axis stage. Together, these components enable high resolution from a large FOV (encompassing the entire slice culture) and sequential, automated acquisition from up to six samples.
Figure 5.
Figure 5.
Dual whole-cell recordings in the hippocampal organotypic slice culture. A, Two filled cells demonstrating extensive apical and basal dendrites that extend across the physical dimensions of the slice from a dual whole-cell recording on DIV 5 in which pipettes contained AlexaFluor-594 (10 μm). B, Seizure activity in dual whole-cell recordings at DIV 11 (ictal data were not used for correlation). sEPSCs recorded 30 s after seizures (bottom, zoomed in recordings) were used for correlations. C, sEPSC correlations between neurons increased from 0.05 on DIV0 to 0.2 on DIV 15–19, consistent with increased connectivity as suggested in A. However, the correlation between neurons did not decrease with distance. The average cross-correlations are as follows: 0.05 ± 0.01 (DIV 1, gray dots, n = 22 pairs), 0.12 ± 0.01 (DIV 5, cyan triangles, n = 32 pairs), 0.18 ± 0.02 (DIV 8, dark red squares, n = 24 pairs), and 0.14 ± 0.02 (DIV 11, red dots, n = 21 pairs). D, Recording from a pair of CA3–1 pyramidal neurons that were considered to be synaptically connected based on the temporal correlation between action potentials in the presynaptic neuron (“pre”; action potentials widened by cesium pipette solution) and excitatory evoked responses evoked from resting membrane potential in the postsynaptic neuron (“post”; also recorded with cesium pipette solution).
Figure 6.
Figure 6.
Interictal and ictal activity in the artificial neural network. A, A simulation with low spike frequency and no seizures: lower values of NRmax (15), spontaneous release probability (0.01), and recovery rate (glutamate replenishment time = 8 s) were the contributing factors. Inset, The voltage scale is the same as that of the main figure. B, C, Interictal-to-ictal transitions. The frequency of seizure-like behavior is proportional to the spontaneous release probability of glutamate. B, Spontaneous glutamate release probability = 0.01. C, Spontaneous glutamate release probability = 0.05.
Figure 7.
Figure 7.
Spread of epileptiform activity through the network. A, Top panels, Plots of membrane potential of each neuron in the network illustrate action potential propagation during interictal spiking activity in a 100 × 100 principal cell and 20 × 20 interneuron network with small-world connectivity (the interneuron grid is visible in frames due to high levels of inputs). Illustrated frames are 5 ms apart. The organized wavefront visible in the first panel is not sustained due to rapid spread of activity via long-distance connections (white stars). Bottom, Glutamate available for release per synapse in the network during spiking activity shown in top panels. B, Top row, Action potential propagation during seizure activity. Every frame is 50 ms apart. Bottom row, Glutamate available for release per synapse in the network during seizure activity shown in top row.
Figure 8.
Figure 8.
Relationship between synaptic depression, conduction velocity, and epileptiform activities. A, The number and distance of firing presynaptic neurons for neurons that fired during seizures and spikes in a particular simulation. For seizures, the firing presynaptic neurons were located within its neighborhood. For spikes, the firing presynaptic neurons were located all over the network. B, Schematic of the varying influence of long-distance versus local connections on the spread of epileptiform activity. Using the network layouts from Figure 1, the red arrow represents a long-distance synaptic connection in a small-world network that spreads activity when synaptic depression is low and a single synapse can activate a postsynaptic neuron. In contrast, when synapses are more depressed, more than one synapse is necessary to activate a postsynaptic neuron. Under these conditions, only the local connections (blue) are sufficiently dense to support coincident activation of >1 synapse. This constrains activity to local propagation, which is slower than via long-distance connections. C, Relationship between releasable glutamate at presynaptic terminals of neurons in the neighborhood (neighborhood being neurons within a 3 × 3 grid of the spiking neuron under consideration) and velocity of propagation of the spiking wavefront. Fast propagation velocity, supported by high mean releasable glutamate levels, produced rapid activation of the network (spike, green). Slow propagation, caused by lower amounts of releasable glutamate, led to a collapse of the wavefront (propagation failure, red). A narrow band of propagation velocity, resulting from moderate amounts of releasable glutamate, produced sustained reentrant waves (seizure, blue).
Figure 9.
Figure 9.
Spontaneous glutamate release probability and occurrence of seizures for small-world networks. A, Maximum duration of continuous activity in seconds versus spontaneous glutamate release probability value. B, Average frequency of spikes in Hz versus spontaneous glutamate release probability value. The frequency of spikes was computed over five 60 s simulations for each spontaneous glutamate release probability value. C, Percentage of random long-range connections in small-world connectivity scheme and occurrence of seizures. Maximum duration of continuous activity in seconds versus percentage of long-range connections. D, Average frequency of spikes in Hz versus percentage of long-range connections. The frequency of spikes was computed over five 60 s simulations for each long-range connectivity percentage.
Figure 10.
Figure 10.
Observing spiral seizure structure: field potentials. A, Membrane potentials (white represents action potential; blue represents resting membrane potential) at seizure onset in network model, as in Figure 3. B, Same time point, after network locations of neurons were scrambled (transformed). Synaptic connectivity was not scrambled. C, D, Scrambling the network location as in B changes the phase, but otherwise has minor effects on local field potentials.
Figure 11.
Figure 11.
Observing spiral seizure structure: calcium imaging. A, Time of onset of ictal Ca2+ increase in individual neurons in an organotypic hippocampal slice culture that was generating spontaneous seizure activity (Lillis et al., 2015). B, The anatomical location of neurons in A were transformed using onset time to create a logarithmic spiral pattern similar to the network model (Fig. 7). Each spiral blade represents a unique onset time, i. Cells were evenly placed on the blade for 0 < t < 1 using the equations x = etcos(t − 0.2(i − 1)) and y = etsin(t − 0.2(i − 1)) C, Using the identical neural network locations for the next spontaneous seizure yields a similar ictal onset pattern.
Figure 12.
Figure 12.
Rate of propagation of ictal versus interical activity: calcium imaging. A, Raster plots of the time at which neurons activated during spikes and a seizure. A total of 600 neurons were imaged using GCaMP7b and arranged in the raster plot according to the time at which they activated (crossed a threshold of 10% ΔF/F) during the onset of the spontaneous seizure beginning at 80 s into the recording. B, Network average of neuronal calcium signals. C, Raster plots of sequential interictal spikes and seizure shown in A and B, arranged according to time of increase in calcium during each individual event. Red represents seizure. Green represents spikes. Initial rates of activation are similar for spikes and seizures. However, the rate at which activity propagates after the initial activation is much slower for both the seizure and the nonpropagated spike activity, consistent with the modeling shown in Figure 7.

Comment in

Similar articles

Cited by

References

    1. Afra P, Jouny CC, Bergey GK (2008) Duration of complex partial seizures: an intracranial EEG study. Epilepsia 49:677–684. 10.1111/j.1528-1167.2007.01420.x - DOI - PubMed
    1. Alivisatos AP, Chun M, Church GM, Deisseroth K, Donoghue JP, Greenspan RJ, McEuen PL, Roukes ML, Sejnowski TJ, Weiss PS, Yuste R (2013) The brain activity map. Science 339:1284–1285. 10.1126/science.1236939 - DOI - PMC - PubMed
    1. Ayala GF, Dichter M, Gumnit RJ, Matsumoto H, Spencer WA (1973) Genesis of epileptic interictal spikes: new knowledge of cortical feedback systems suggests a neurophysiological explanation of brief paroxysms. Brain Res 52:1–17. 10.1016/0006-8993(73)90647-1 - DOI - PubMed
    1. Barabasi AL, Albert R (1999) Emergence of scaling in random networks. Science 286:509–512. 10.1126/science.286.5439.509 - DOI - PubMed
    1. Barardi A, Garcia-Ojalvo J, Mazzoni A (2016) Transition between functional regimes in an integrate-and-fire network model of the thalamus. PLoS One 11:e1061934. 10.1371/journal.pone.0161934 - DOI - PMC - PubMed

Publication types