. 2019 Jan 16;222(Pt 2):jeb190017.
doi: 10.1242/jeb.190017.

Object features and T4/T5 motion detectors modulate the dynamics of bar tracking by Drosophila

Affiliations

Object features and T4/T5 motion detectors modulate the dynamics of bar tracking by Drosophila

Mehmet F Keleş et al. J Exp Biol. .

Abstract

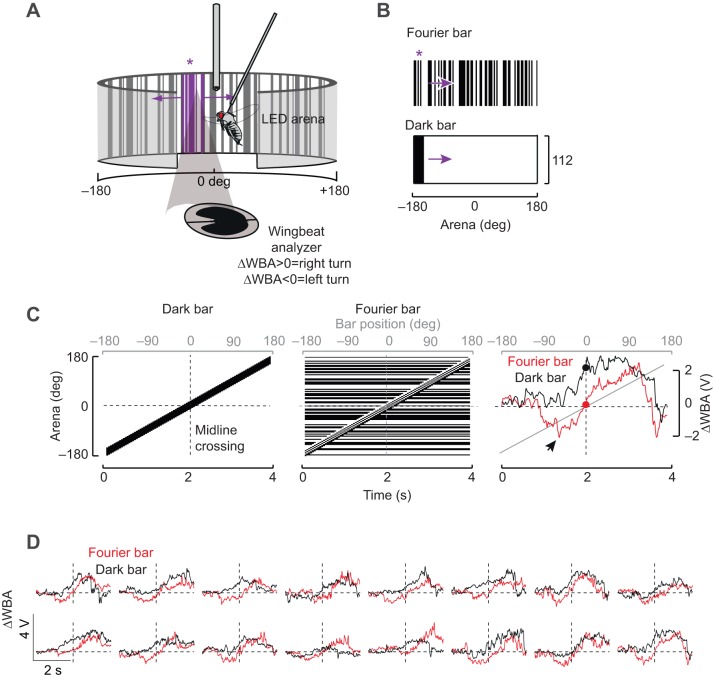
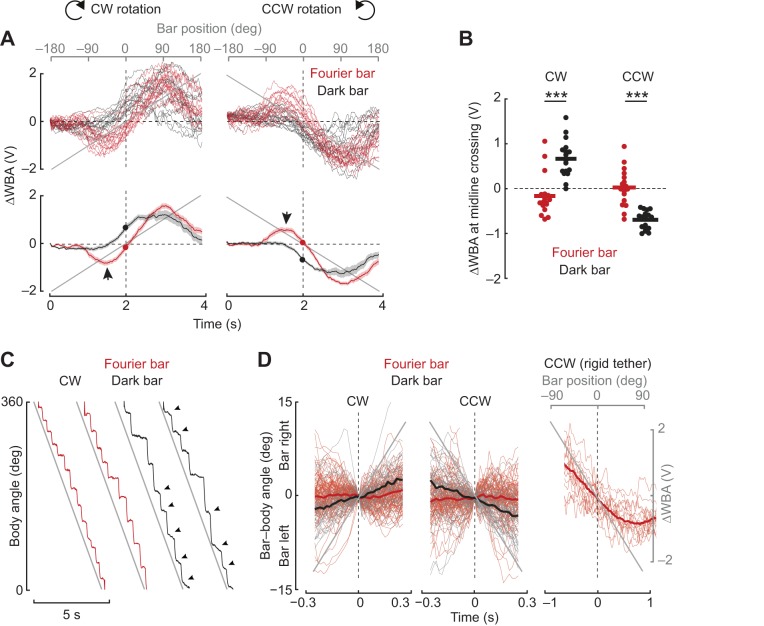
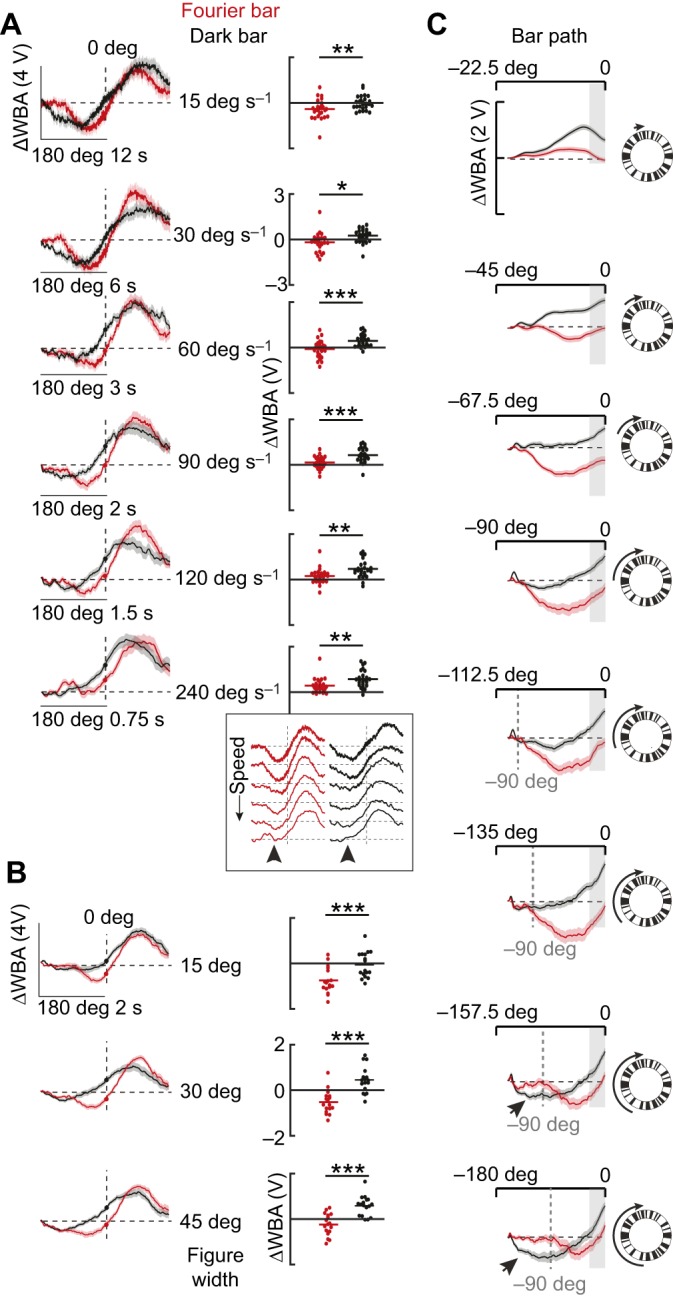
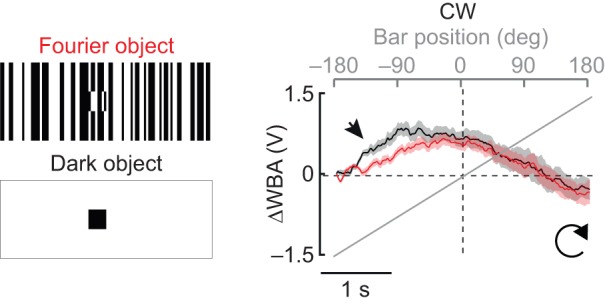
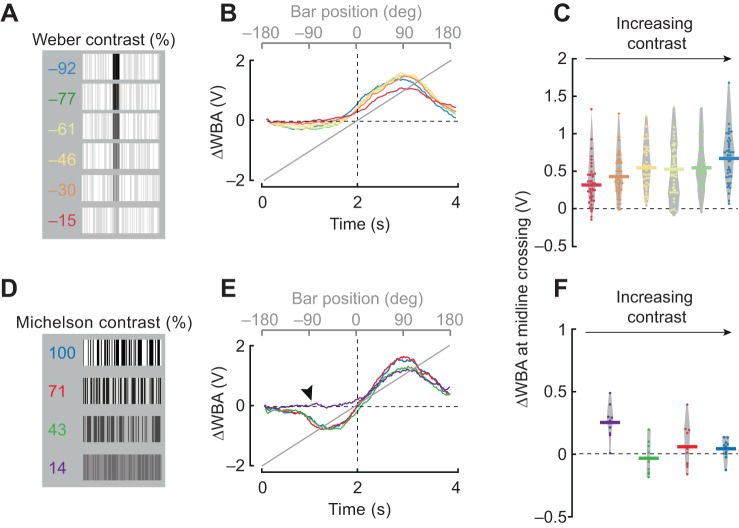
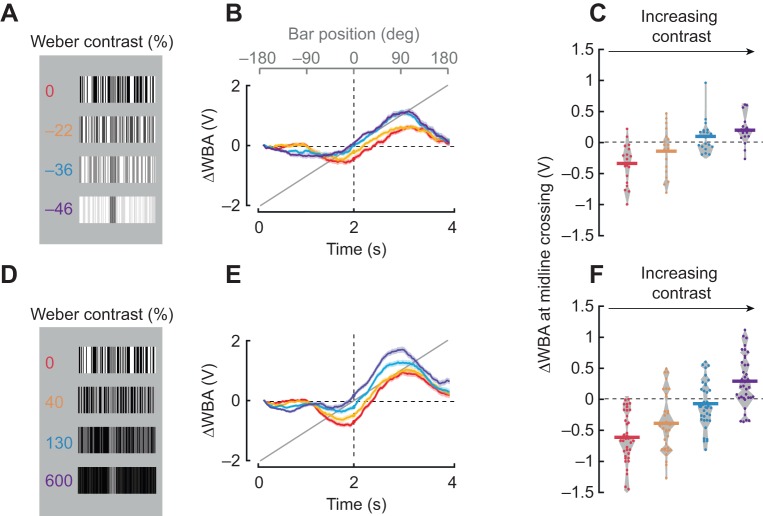
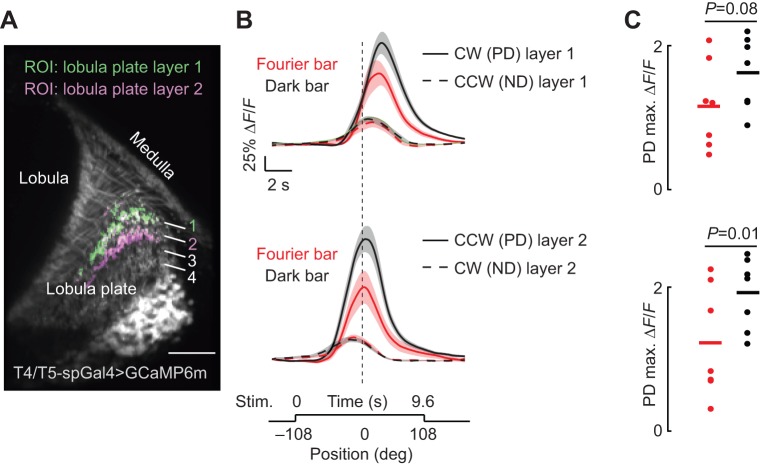
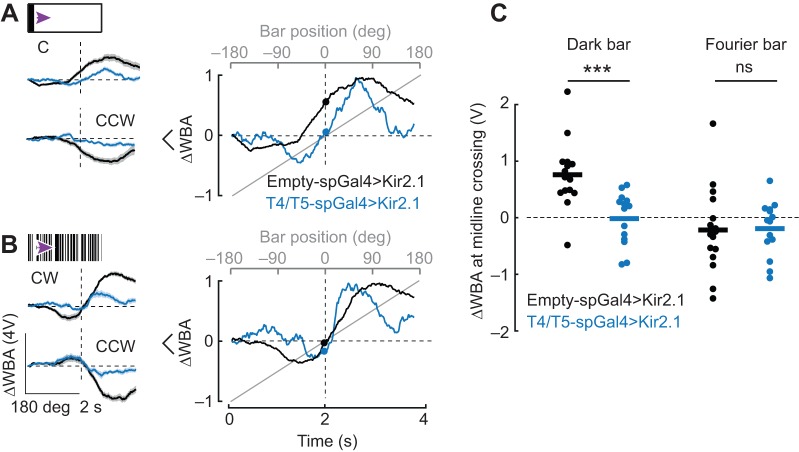
Visual objects can be discriminated by static spatial features such as luminance or dynamic features such as relative movement. Flies track a solid dark vertical bar moving on a bright background, a behavioral reaction so strong that for a rigidly tethered fly, the steering trajectory is phase advanced relative to the moving bar, apparently in anticipation of its future position. By contrast, flickering bars that generate no coherent motion or have a surface texture that moves in the direction opposite to the bar generate steering responses that lag behind the stimulus. It remains unclear how the spatial properties of a bar influence behavioral response dynamics. Here, we show that a dark bar defined by its luminance contrast to the uniform background drives a co-directional steering response that is phase advanced relative to the response to a textured bar defined only by its motion relative to a stationary textured background. The textured bar drives an initial contra-directional turn and phase-locked tracking. The qualitatively distinct response dynamics could indicate parallel visual processing of a luminance versus motion-defined object. Calcium imaging shows that T4/T5 motion-detecting neurons are more responsive to a solid dark bar than a motion-defined bar. Genetically blocking T4/T5 neurons eliminates the phase-advanced co-directional response to the luminance-defined bar, leaving the orientation response largely intact. We conclude that T4/T5 neurons mediate a co-directional optomotor response to a luminance-defined bar, thereby driving phase-advanced wing kinematics, whereas separate unknown visual pathways elicit the contra-directional orientation response.

Keywords: Feature detection; Fly flight; Motion vision; Tethered flight; Visual behavior.


Conflict of interest statement

Competing interestsThe authors declare no competing or financial interests.

Figures

Fig. 1.
Fig. 1.
Behavioral responses to a luminance-defined dark bar and a motion-defined Fourier bar are distinct in tethered Drosophila melanogaster. (A) Schematic diagram of the visual flight simulator. A fly is tethered to a tungsten pin and surrounded by an arena of LEDs. An infrared light source above the fly casts a shadow on a photodiode that records the wing beat amplitude (WBA). (B) Fourier bar and dark bar stimuli. Purple asterisk indicates the location of the motion-defined Fourier bar (see A). (C) Left and middle: space–time plots for dark and Fourier bars shown for a full rotation around the 360 deg visual azimuth. Dashed vertical line indicates the midline crossing when the bar is directly in front of the fly. Right: ΔWBA responses of a single fly to rotation of a Fourier (red) and dark (black) bar. Red and black dots indicate the ΔWBA when the figure is at the midline. Arrowhead indicates a small saccade-like event. (D) Plots similar to those in C showing single response traces from 16 flies. The right-hand panel is the same as the right panel in C.
Fig. 2.
Fig. 2.
The dark bar elicits a co-directional steering response, whereas the Fourier bar elicits a contra-directional orientation response. (A) Top: steering responses of 17 flies to clockwise (CW) and counter-clockwise (CCW) rotation of a Fourier bar (red) and a dark bar (black). Each trace is the mean response to multiple stimulus trials for a single fly. Bottom: population average responses to CW and CCW rotation of the Fourier bar (red) and the dark bar (black). Shaded regions indicate s.e.m., n=17. Arrows indicate the counter-directional turn toward the bar. Filled circles indicate the steering responses as the Fourier bar (red) and the dark bar (black) cross the visual midline. (B) Comparison of the ΔWBA value when the bar reaches the midline ‘zero crossing’ of the arena. Asterisks denote results of a paired t-test: P=1.20×10⁻⁷ for CW and P=6.25×10⁻⁷ for CCW. (C) Body angle recorded for a magnetically tethered fly in response to a bar revolving at 75 deg s−1. Arrowheads indicate smooth body movements between saccades. (D) The angle between the fly's longitudinal body axis and the azimuthal position of the bar 300 ms segments before and after the bar crossed the fly's visual midline. n=26 flies for the Fourier bar and n=10 flies for the dark bar. Data are pooled from experiments in which the bars rotated at different speeds; thus, the gray line is merely indicative of the direction of bar movement, not its actual position. Mean body angle slope coefficients for the dark and Fourier bar are different from each other at the 99.9% confidence level for both CW and CCW rotation (linear regression, P<0.001, d.f.=29). For comparison, the right panel indicates single response trajectories from 17 flies in the rigid tether 1 s before and after the Fourier bar crosses the fly's visual midline.
Fig. 3.
Fig. 3.
Qualitative differences between Fourier and dark bar responses persist across bar velocity, size and trajectory. (A) Left: average steering responses to a 30 deg Fourier bar (red) and a dark bar (black) revolved CW at varying speed as indicated. Shaded regions indicate s.e.m., n=26. Right: dot plots indicate ΔWBA at the midline crossing. Horizontal lines indicate mean values. Paired t-test (*P<0.05, **P<0.01, ***P<0.001). Inset: mean traces from A re-plotted to highlight the speed-dependent loss of the orientation response (arrowheads). (B) Average steering responses to bars of varying widths, as indicated, revolved CW. Shaded regions indicate s.e.m., n=17. Paired t-test (P=5.32×10⁻⁶ for 15 deg, P=1.34×10⁻⁵ for 30 deg and P=1.61×10⁻⁵ for 45 deg). (C) Average steering responses to 30 deg bars revolved starting from eight different locations along the visual azimuth and ending on the visual midline as indicated with cartoons and arrows. Shaded regions indicate s.e.m., n=37.
Fig. 4.
Fig. 4.
A small Fourier object and a small dark object elicit similar steering responses. Average steering responses to a 30 deg by 30 deg Fourier (red) and dark (black) object revolved CW around the fly. Shaded regions indicate s.e.m., n=16. Arrowhead indicates where the steering responses differ.
Fig. 5.
Fig. 5.
Qualitative differences between the Fourier and dark bar persist across different contrast conditions. (A) Luminance-defined bar at varying contrasts (indicated) (see Materials and Methods). (B) Mean steering responses to CW rotation of 30 deg bars. Color code is the same as in A. n=42. (C) ΔWBA values at the zero-crossing; each dot represents an individual fly. Horizontal lines represent mean values and the gray envelope encloses all data points. (D) Fourier-type bars with varying Michelson contrast as indicated. (E) Mean steering responses to 30 deg Fourier bars. Black arrowhead indicates the absence of the usual contra-directional steering response to a low-contrast Fourier bar approaching the visual midline. (F) Data presentation of mid-line crossing values from E, plotted similarly to C. n=11.
Fig. 6.
Fig. 6.
Varying luminance contrast between the bar and the background elicits phase lags to bar revolution. (A) A single Fourier-type bar of intermediate contrast tested against four different backgrounds; the luminance contrast of the bar as indicated. For the first bar, the mean luminance per unit area of the bar was matched to the mean luminance of the background (red). For subsequent bars, the background luminance was systematically increased. (B) Average steering responses to CW rotation of 30 deg bars, color coded for stimuli in A. Shaded regions indicate s.e.m., n=19. (C) ΔWBA values at the zero-crossing; each dot represents an individual fly. Horizontal lines represent mean values and the gray envelope encloses all data points. (D) The same bar used in A (red), superimposed upon the background patterns of decreasing mean luminance. (E) Average steering responses to CW rotation of 30 deg bars. Shaded regions indicate s.e.m., n=37. (F) ΔWBA values at the zero-crossing; each dot represents an individual fly. Horizontal lines represent mean values and the gray envelope encloses all data points.
Fig. 7.
Fig. 7.
The dark bar elicits stronger preferred directional responses from T4/T5 cells than the Fourier bar. (A) Single two-photon excitation image of T4/T5 cells expressing GCaMP6m. The region of interest (ROI) was restricted to either layer 1 or layer 2 of the lobula plate as indicated. (B) Average calcium responses (ΔF/F, change in fluorescence) of T4/T5 neurons to a CW or CCW rotating Fourier (red) and dark bar (black). Each panel compares preferred direction (PD) and null direction (ND) responses in each layer as indicated. ND traces are time inverted for visual comparison with PD responses. Shaded regions indicate s.e.m., n=7. (C) Maximum calcium responses from PD data in B. Each dot represents data from an individual fly; horizontal line indicates mean responses. Paired t-test P-values comparing peak PD responses as indicated.
Fig. 8.
Fig. 8.
Genetically silencing T4/T5 eliminates the phase-advanced behavioral response to the dark bar. (A) Left: average steering responses to a 30 deg dark bar rotating CW or CCW in control flies (black) and T4/T5-silenced flies (blue). Shaded regions represent s.e.m. Right: average traces from the left panel normalized to their own maximum to facilitate comparison. (B) Left: average steering responses to a 30 deg rotating Fourier bar in CW and CCW directions. Shaded regions represent s.e.m. Right: average traces from left panel normalized to their own maximum to facilitate comparison. (C) ΔWBA values at bar midline crossing; each dot represents a single fly; horizontal line indicates mean. n=16 enhancerless control, n=14 experimental genotype. Wilcoxon rank sum test to compare control and T4/T5-silenced flies: P=3.2×10⁻⁴ for dark bar response at midline crossing comparing control and T4/T5-silenced flies; P=0.66 for Fourier bar. ***P<0.001.

Similar articles

Cited by

References

    1. Akerboom J., Chen T.-W., Wardill T. J., Tian L., Marvin J. S., Mutlu S., Calderon N. C., Esposti F., Borghuis B. G., Sun X. R. et al. (2012). Optimization of a GCaMP calcium indicator for neural activity imaging. J. Neurosci. 32, 13819-13840. 10.1523/JNEUROSCI.2601-12.2012 - DOI - PMC - PubMed
    1. Akin O. and Zipursky S. L. (2016). Frazzled promotes growth cone attachment at the source of a Netrin gradient in the Drosophila visual system. eLife 5, 961-972. 10.7554/eLife.20762 - DOI - PMC - PubMed
    1. Aptekar J. W., Shoemaker P. A. and Frye M. A. (2012). Figure tracking by flies is supported by parallel visual streams. Curr. Biol. 22, 482-487. 10.1016/j.cub.2012.01.044 - DOI - PubMed
    1. Aptekar J. W., Keleş M. F., Lu P. M., Zolotova N. M. and Frye M. A. (2015). Neurons forming optic glomeruli compute figure-ground discriminations in Drosophila. J. Neurosci. 35, 7587-7599. 10.1523/JNEUROSCI.0652-15.2015 - DOI - PMC - PubMed
    1. Bahl A., Ammer G., Schilling T. and Borst A. (2013). Object tracking in motion-blind flies. Nat. Neurosci. 16, 730-738. 10.1038/nn.3386 - DOI - PubMed

Publication types

LinkOut - more resources