

A conserved mechanism drives partition complex assembly on bacterial chromosomes and plasmids
- PMID: 30446599
- PMCID: PMC6238139
- DOI: 10.15252/msb.20188516
A conserved mechanism drives partition complex assembly on bacterial chromosomes and plasmids
Abstract
Chromosome and plasmid segregation in bacteria are mostly driven by ParABS systems. These DNA partitioning machineries rely on large nucleoprotein complexes assembled on centromere sites (parS). However, the mechanism of how a few parS-bound ParB proteins nucleate the formation of highly concentrated ParB clusters remains unclear despite several proposed physico-mathematical models. We discriminated between these different models by varying some key parameters in vivo using the F plasmid partition system. We found that "Nucleation & caging" is the only coherent model recapitulating in vivo data. We also showed that the stochastic self-assembly of partition complexes (i) is a robust mechanism, (ii) does not directly involve ParA ATPase, (iii) results in a dynamic structure of discrete size independent of ParB concentration, and (iv) is not perturbed by active transcription but is by protein complexes. We refined the "Nucleation & caging" model and successfully applied it to the chromosomally encoded Par system of Vibrio cholerae, indicating that this stochastic self-assembly mechanism is widely conserved from plasmids to chromosomes.
Keywords: Escherichia coli; DNA segregation; F plasmid; ParABS; plasmid partition.
© 2018 The Authors. Published under the terms of the CC BY 4.0 license.
Figures

Current models for ParB spreading and partition complex assembly. Schematic representation of the main currently proposed mechanisms for the assembly of partition complexes. ParB dimer (dark blue ovoids) binds specifically to the parS centromere sequence (black rectangle). (a) “1D spreading”. ParB dimers propagate by nearest‐neighbor interactions in 1D following the DNA track (black line) and form filaments away from parS in both directions. (b) “Spreading and bridging”. ParB dimers form (short) 1D filaments on parS and on nsDNA by nearest‐neighbor interactions. By bridging together these patches of ParB induce the formation of DNA loops. (c) “Nucleation and caging”. The transient interactions of ParB with itself and with ParB‐nsDNA provide a network of weaker interactions that nucleates the formation of a highly confined ParB zone. By preventing fast ParB diffusion away from the ParB/parS complex, these independent but synergistic interactions actively cluster most ParB around parS. Importantly, the DNA in the vicinity of parS would preferentially enter this high‐density region of ParB. This results in the stochastic binding of ParB over the centromere‐proximal DNA sequences which depend on the natural loops of the DNA, and leads to the observed power law decrease in ParB density occurring over large genomic distance.
Modeling of the evolution of the DNA binding profiles in the vicinity of parS as a function of the ParB level. Schematics of ParB DNA binding profile as a function of ParB concentration from the predictions of the three main physico‐mathematical models. Note that the intracellular concentration is a good estimate of the amount of ParB in clusters as over 90% of ParB are highly confined around parS. (Left) The “1D‐spreading” model predicts a rapid decrease of the ParB density after the parS site (Broedersz et al, 2014). Most of the particles are homogeneously distributed at an average constant value along the DNA. This behavior is explained from general statistical physical ground: a 1D system of particles with nearest‐neighbor interactions cannot display a phase transition leading to a global clustering. (Middle) The “Spreading & bridging” model, in the strong coupling limit, predicts a clustering of all ParBs along the DNA with the constraint of overlapping with parS site. This leads to a triangular profile with a 1/m slope depending on the number of particles m (Broedersz et al, 2014). (Right) With the “Nucleation and caging” model, the decay only depends on the geometry of the foci (discussed in the manuscript). Upon variation of ParB level, the profiles would remain unchanged at a fixed cluster size despite fluctuation in ParB density and would thus overlap after a rescaling of the amplitude. Only “Nucleation and Caging” describes the profiles observed experimentally using high‐resolution ChIP‐sequencing (Fig 2A).
- A
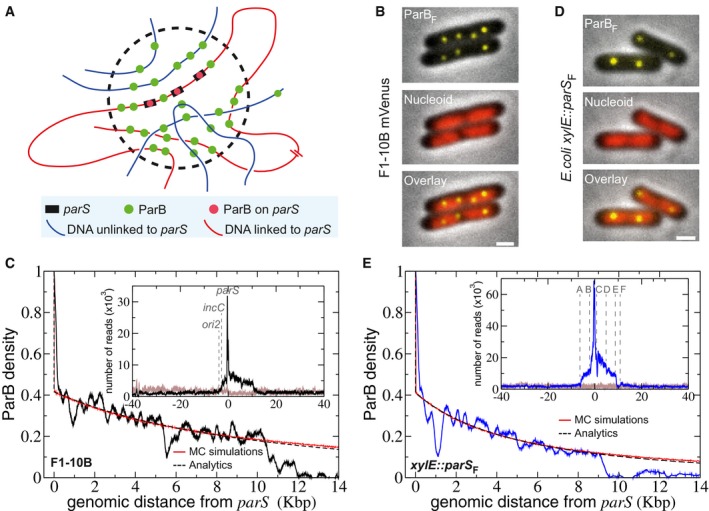
Schematic representation of the “Nucleation & caging” model. Most ParB dimers (green dots) are highly confined in a cluster (dotted circle) centered on the parS sites (black rectangles) onto which some ParBs are stably bound (red dots). The DNA entering the cluster is bound stochastically by ParB. Red and blue lines represent DNA present at small and large (or on a different molecule) genomic distance from parS, respectively.
- B
ParB clusters on F plasmid in vivo. Typical Escherichia coli cells (DLT3594) display foci of ParBF‐mVenus protein (top) expressed from the endogenous genetic locus of the F plasmid (F1‐10B‐mVenus). The nucleoid is labeled with Hu‐mCherry (central). The overlay (bottom) combines the two fluorescent channels. Over 99% of cells harbor ParBF foci. Scale bars: 1 μm.
- C
ParBF binding outside parS F on the F plasmid is compatible with a power law decay. High‐resolution ChIP‐seq performed on DLT3586 carrying the F plasmid (F1‐10B). The ParB density, normalized to 1 at the first bp downstream the last parS F binding repeat after background subtraction, is displayed over 14 Kbp on the right side of parS F. Monte Carlo simulations and analytic formula are represented in red and dotted black lines, respectively. MC simulations were performed with a Freely Jointed Chain of linear length L = 15 Kbp and a cluster radius σ = 75 nm. The two other parameters, the Kuhn length a = 10 bp and the total number of proteins on the F plasmid N t = 360 (related to the normalization constant of the protein concentration κ = 0.41), were fitted from the ChIP‐seq data (see text and Box 1). As a benchmark for simulations, the analytics are obtained from equation (1) with the same parameters. Inset: The ParBF binding profile (black line) is represented as the number of nucleotide reads over 80 Kbp centered at parS. The number of reads in the input sample (gray line) is normalized to the total number of reads in the IP sample.
- D, E
Same as (B and C) with parS F inserted at the xylE locus on E. coli chromosome from DLT3584 and DLT2075, respectively. Cells were grown in the presence of 100 μM IPTG. The Kuhn length was adjusted to a = 22 bp in the simulations and analytics. The characteristics of the A–F genetic loci are presented in Appendix Fig S1A. Note that a highly similar ParBF DNA binding pattern is obtained when ParBF was expressed in trans from a plasmid (strain DLT3567; Appendix Fig S1D).

Normalized and rescaled ParBF binding profiles at different ParBF/parS F ratio. ChIP‐seq density on the right side of parS F inserted at xylE was measured in DLT2075 induced (16, 28) or not (0.4) with IPTG (100 and 500 μM), or carrying HCN plasmids pZC302 (0.04) or pJYB57 (0.016), normalized as in Fig 1C and E with the amplitudes of the curves rescaled by the indicated factors (1.2, 10, or 50) to overlap with the curves of highest amplitude. The ParB/parS ratio is calculated relative to the one of F plasmid as determined from Western blot analyses (Appendix Fig S2B). Monte Carlo simulations and analytical formula are plotted with the same parameters as in Fig 1E. Note (i) that the dips at ˜9 Kbp are not visible for the low levels of available ParB since the signal is close to the basal level, and (ii) that the ChIP‐seq data at 100 μM IPTG induction (16) are the same as in Fig 1E. Inset: Same as in the main to display the density without rescaling.
ParBF is dispersed in the cell upon titration by HCN plasmids. ParBF‐mVenus expressed from pJYB294 was imaged as in Fig 1D in DLT3577 (left) and DLT3576 (right) carrying pZC302 and pJYB57, respectively. The number of extra parS F per cell, indicated on top of each raw, is estimated from the copy number per cell of HCN plasmids carrying 10 specific binding sites. Scale bars: 1 μm.
The size of ParBF clusters is independent of the intracellular ParBF concentration. We considered two possible evolutions of the cluster size upon variations of ParB amount in the framework of “Nucleation & caging” with corresponding schematics drawn on the right. For direct comparison with (A), all curves are displayed with a rescaling of the amplitude corresponding to the WT expression level. Top: constant ParB concentration; supposing that clusters are compact, the cluster radius σ would depend on the number m of ParB like σ = m 1/3. Predictions profiles, plotted at different ratio of ParB/parS, vary within the range of the experimental levels tested. Bottom: constant cluster size; ParB concentrations vary but the range of exploration remains the same resulting in overlapping profiles.

The formation of secondary ParBF‐DNA complexes requires the box II motif. EMSA was performed with a 144‐bp 32P‐labeled DNA fragments (C144) carrying a single 16‐bp parS binding motif. Reaction mixtures containing 100 μg ml−1 sonicated salmon sperm DNA were incubated in the absence (−) or the presence of increasing concentrations (gray triangle; 10, 30, 100, 300, and 1,000 nM) of ParBF or ParBF‐3R*. Positions of free and bound probes are indicated on the left. B1 represents complexes involving the specific interaction on the 16‐bp binding site, while B'2 and B'3 complexes represent secondary complexes involving the parS F site with one or two additional nsDNA‐binding interactions, respectively (Sanchez et al, 2015).
ParBF cluster formation requires the box II motif. Epifluorescence microscopy of ParBF‐3R*‐mVenus from DLT3566 is displayed as in Fig 1D. Scale bars: 1 μm.
ParBF in vivo DNA binding in the vicinity of parS F sites requires the box II motif. ChIP‐seq was performed on DLT3726 carrying parS F in the xylE chromosomal locus and expressing ParBF‐3R* variant. ParBF‐3R* DNA binding profile displayed the number of nucleotide reads as a function of the Escherichia coli genomic coordinates. The peak at parS F covered approximately 950 bp, which corresponds to the 402 bp between the 1st and 10th specific binding sites and ˜280 bp on each sides (representing the average size of the DNA library; see Appendix Fig S3E). No ParBF‐3R* enrichment was found on parS F‐flanking DNA and elsewhere on the chromosome. Inset: Zoom in on the right side of parS F over 5 Kbp with the ParB density, normalized to 1 at the first bp after the last parS binding repeat, plotted as a function of the distance from parS F. Note that a highly similar DNA binding pattern is obtained with ParBF‐3R*‐mVenus (strain DLT3566; Appendix Fig S3C).
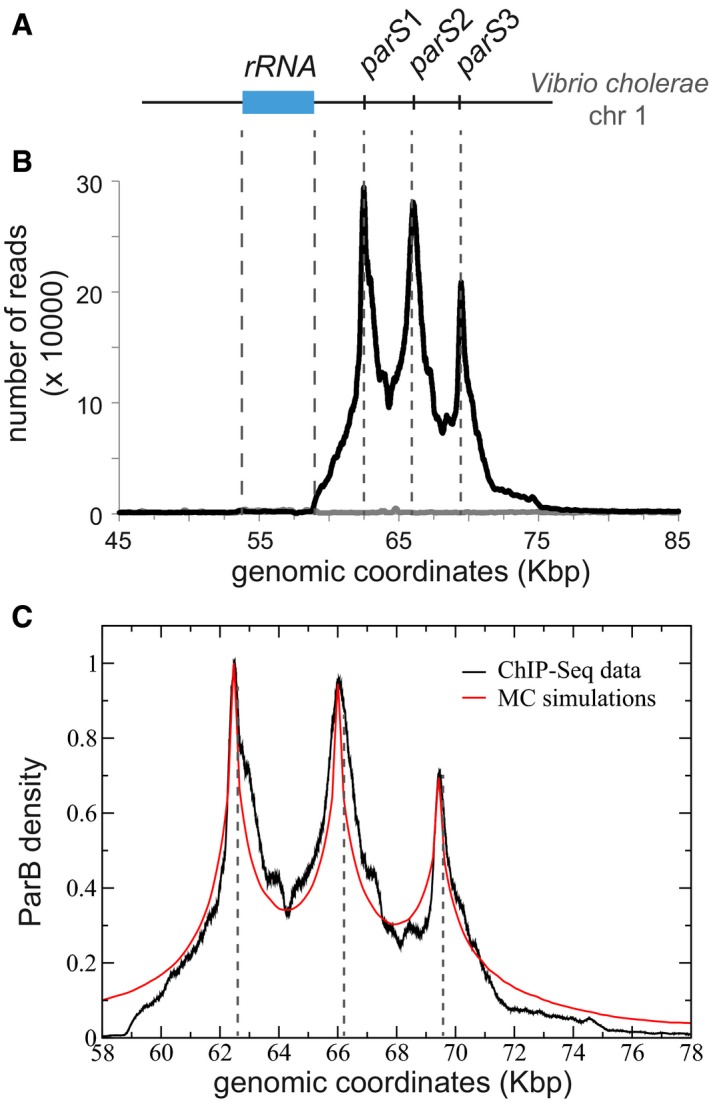
Schematic representation of the genomic locus of the chromosome 1 of V. cholerae with the three parS sites, named parS1‐3. The rRNA operon (blue rectangle) spans the genomic coordinates 53,823–59,123.
ChIP‐seq performed on strain N16961 is displayed as the number of nucleotide reads in function of the genomic coordinates. Correspondence to the parS1‐3 location represented in (A) is indicated by gray dotted lines. The number of reads in the input sample (gray line) is normalized to the total number of reads in the IP sample.
We modeled the ChIP‐Seq data as in Fig 1C–E by means of MC simulations with a Freely jointed chain of size N = 2,000 monomers of size a = 16 bp. Data are normalized after background subtraction to the read value at parS1 (genomic coordinate 62,438). The best fit was achieved with σ = 25 nm and an amplitude κ = 0.15 leading to N t˜50 ParB on the chromosome. In the MC simulation, we accounted for the finite width of the distribution around parS sites by including the average fragment size of the DNA library (304 bp; for comparison, a simulation without is provided in Appendix Fig S4B).

ParBF DNA binding around parS F is independent of active transcription. The color‐coded ParBF profiles are represented over 50 Kbp as the relative ParB density normalized to 1 at the first bp after the last parS F binding site. Loci A, C, E, and F are defined in Appendix Fig S1A.
The dips and peaks are highly similar in the three indicated conditions. Same as in (A) with zoom in on the right side of parS F up to 9 Kbp and normalization to 1 at genomic coordinate 230. The dotted line corresponds to the analytics description of “Nucleation and caging” (see details in Fig 1C–E).
ParBF binding profile upstream of the locus A. Same as in (A) with zoom in from −6.5 to −16.5 Kbp by normalization to 1 at genomic coordinate −6.5 Kbp (upstream of the dip at the locus A). The ParBF DNA binding profile remains compatible to a power law, represented by the analytics description (dotted line), upstream of the locus A in stationary phase (black) and in exponential phase (blue). Also, the dips and peaks are highly similar in both conditions. These data are not in favor of the “1D‐spreading” or the “Spreading and bridging” models that predicts a basal uniform distribution or a linear decrease after a barrier, respectively (Broedersz et al, 2014).
The promoter region at locus A prevents ParBF DNA binding. ChipIP‐seq assays were performed in isogenic xylE::parS F strains (DLT2075; black curve) in which the locus A is replaced by a kanamycin gene (DLT3651; red curve). The assay in the Δ(locus A) genomic context has been performed once. The relative ParB density as a function of the distance from parS F is drawn and normalized as in (A). The promoter region is depicted as in Appendix Fig S1A.

Representative images of a photobleached cell during a FRAP experiment. The 488 nm laser was pulsed (Bleach) on one of the two foci at ˜2.4 s (black arrow). Red and blue arrows correspond to the bleached and unbleached focus, respectively. Time is indicated in seconds (upper right). The cell outline is drawn in red. Scale bar: 1 μm.
Quantification of ParBF‐mVenus fluorescence intensity over time. The dynamics of fluorescence intensity is shown from averaging 18 independent measurements of the bleached (FRAP, red line) and unbleached (FLIM, blue line) foci. Foci fluorescence intensity in each experiment was normalized to the average intensity of each focus before photobleaching. The Appendix Fig S6 displays the three pre‐bleaching and the first post‐bleaching data points on an expanded scale. Natural bleaching during the course of the experiments (green curve) was estimated for each measurement by averaging the fluorescence intensity of 15 foci present in each field of view. Error bars correspond to standard deviation (mean ± SD).
References
-
- Baxter JC, Funnell BE (2014) Plasmid partition mechanisms. Microbiol Spectr 2: PLAS‐0023‐2014 - PubMed
Publication types
MeSH terms
Substances
LinkOut - more resources
Full Text Sources
Molecular Biology Databases
Miscellaneous
