. 2019 Jan 11;294(2):593-607.
doi: 10.1074/jbc.RA118.005536. Epub 2018 Nov 16.

Membrane-anchored carbonic anhydrase IV interacts with monocarboxylate transporters via their chaperones CD147 and GP70

Affiliations

Membrane-anchored carbonic anhydrase IV interacts with monocarboxylate transporters via their chaperones CD147 and GP70

Linda S Forero-Quintero et al. J Biol Chem. .

Abstract

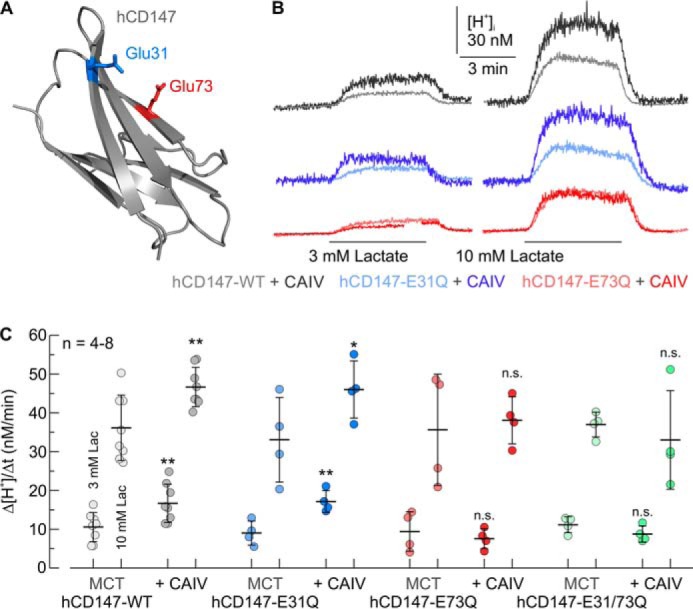
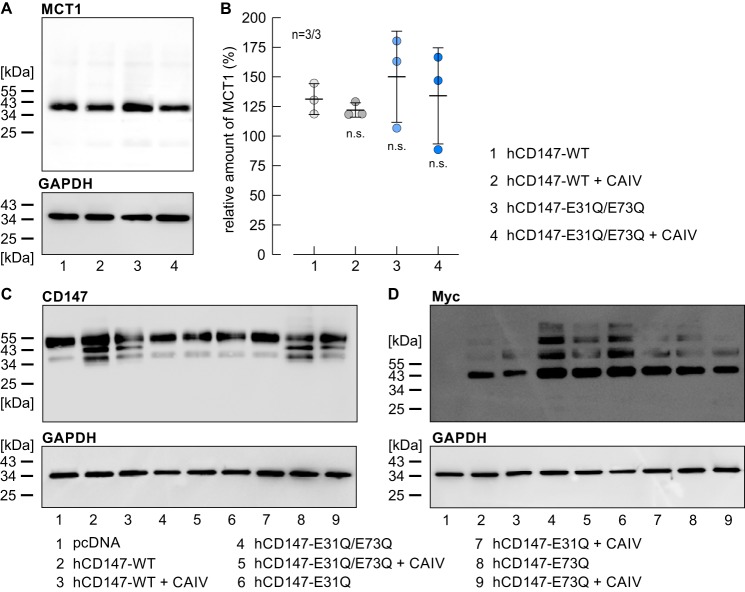
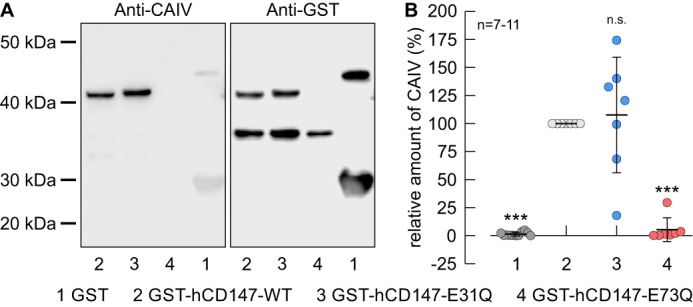
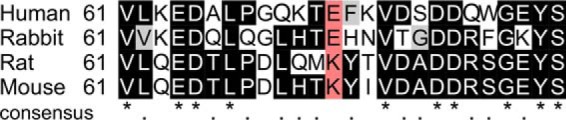
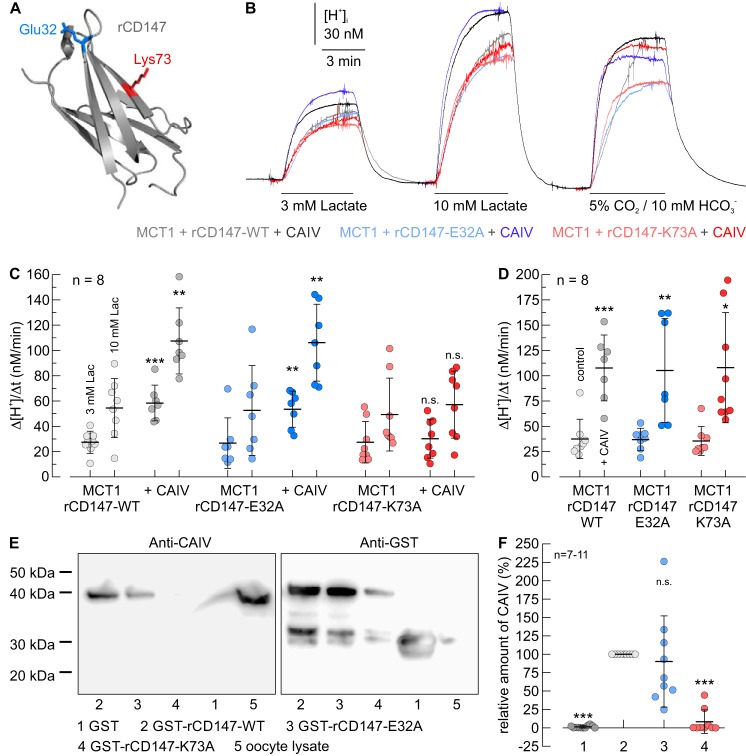
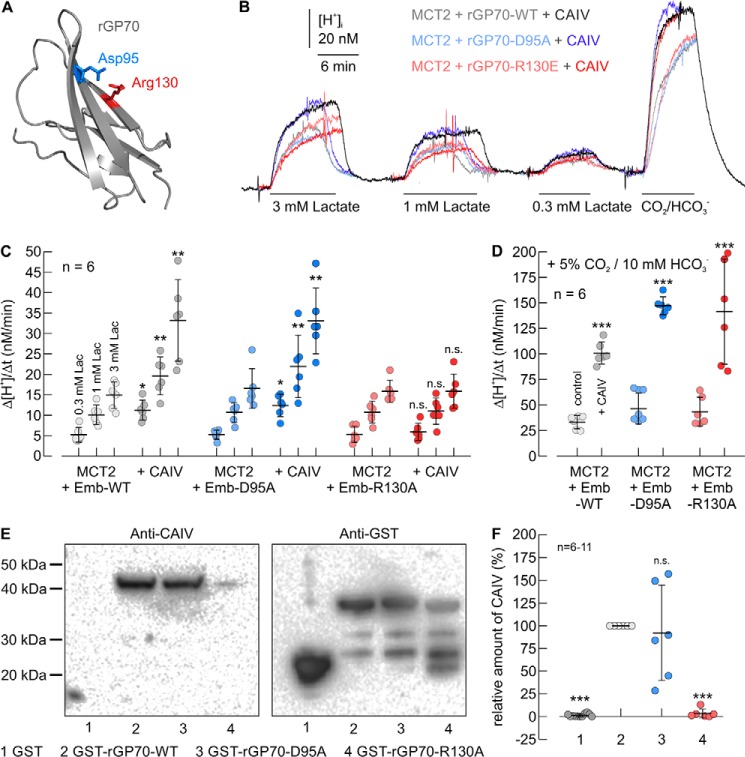
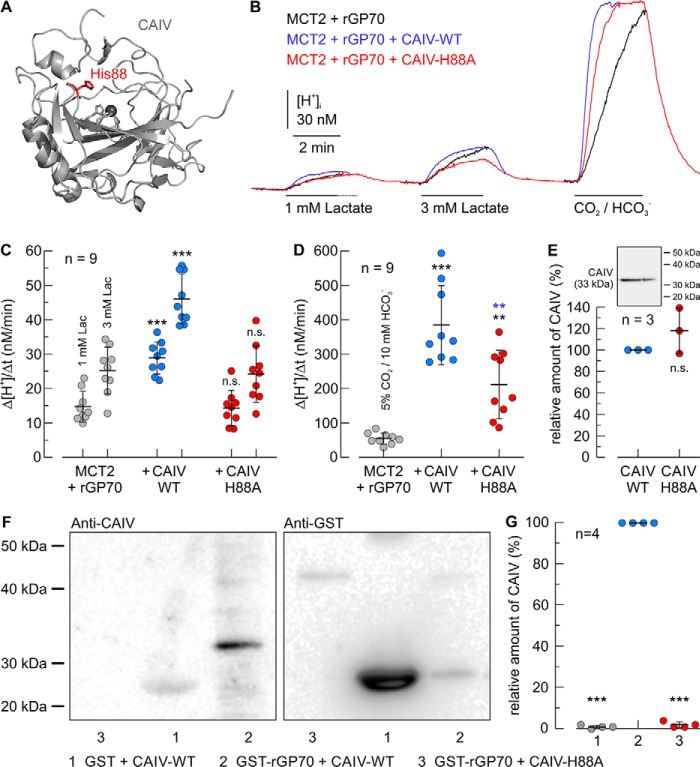
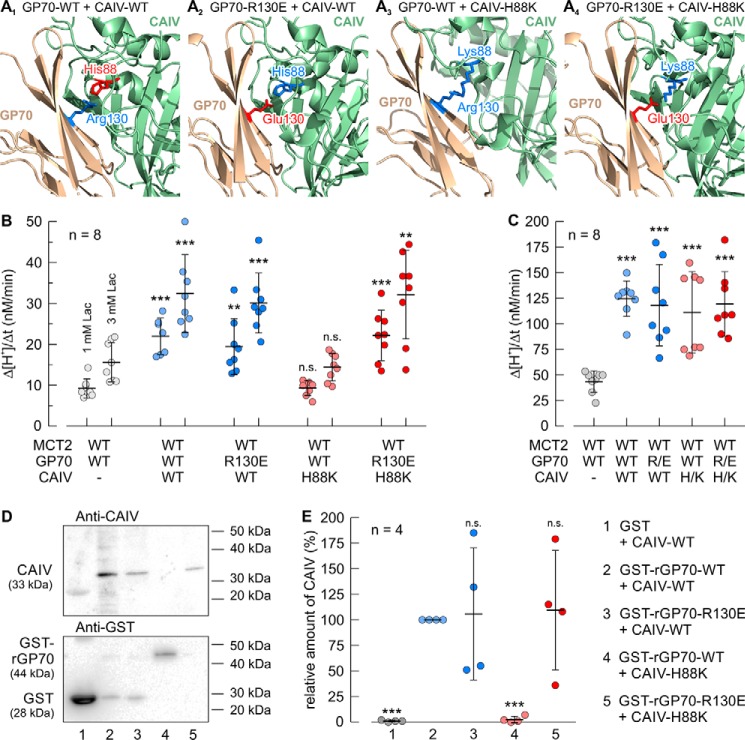
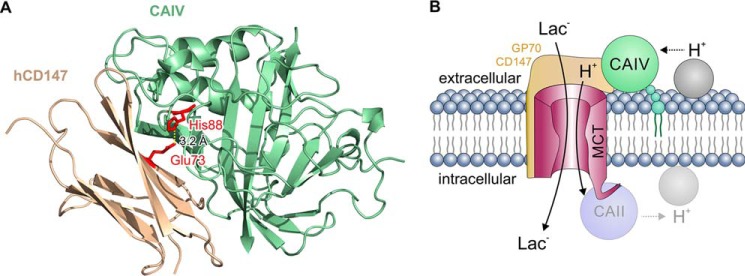
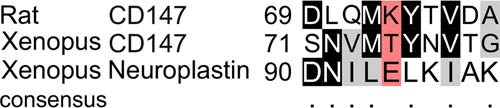
Monocarboxylate transporters (MCTs) mediate the proton-coupled exchange of high-energy metabolites, including lactate and pyruvate, between cells and tissues. The transport activity of MCT1, MCT2, and MCT4 can be facilitated by the extracellular carbonic anhydrase IV (CAIV) via a noncatalytic mechanism. Combining physiological measurements in HEK-293 cells and Xenopus oocytes with pulldown experiments, we analyzed the direct interaction between CAIV and the two MCT chaperones basigin (CD147) and embigin (GP70). Our results show that facilitation of MCT transport activity requires direct binding of CAIV to the transporters chaperones. We found that this binding is mediated by the highly conserved His-88 residue in CAIV, which is also the central residue of the enzyme's intramolecular proton shuttle, and a charged amino acid residue in the Ig1 domain of the chaperone. Although the position of the CAIV-binding site in the chaperone was conserved, the amino acid residue itself varied among different species. In human CD147, binding of CAIV was mediated by the negatively charged Glu-73 and in rat CD147 by the positively charged Lys-73. In rat GP70, we identified the positively charged Arg-130 as the binding site. Further analysis of the CAIV-binding site revealed that the His-88 in CAIV can either act as H donor or H acceptor for the hydrogen bond, depending on the charge of the binding residue in the chaperone. Our results suggest that the CAIV-mediated increase in MCT transport activity requires direct binding between CAIV-His-88 and a charged amino acid in the extracellular domain of the transporter's chaperone.

Keywords: Xenopus; electrophysiology; energy metabolism; ion-sensitive electrode; lactic acid; membrane transport; pH regulation; protein complex; protein expression; proton transport.


Conflict of interest statement

The authors declare that they have no conflicts of interest with the contents of this article

Figures

Figure 1.
Figure 1.
Facilitation of MCT transport activity by CAIV in HEK-293 cells requires Glu-73 in the Ig1 domain of the transporter's chaperone CD147. A, structure of the Ig1 domain of human CD147 (PDB code 3B5H (37)). Glu-31 and Glu-73 are labeled in blue and red, respectively. B, original recordings of the change in intracellular H+ concentration during application of lactate in HEK-293 cells, transfected with hCD147–WT (gray traces), hCD147–E31Q (blue traces), and hCD147–E73Q (red traces), respectively. Cells were either transfected with hCD147 alone (light traces) or cotransfected with hCD147 and human CAIV (dark traces). C, rate of change in intracellular H+ concentration (Δ[H+]/Δt) during application of lactate in HEK-293 cells, transfected with hCD147–WT (gray dots), hCD147–E31Q (blue dots), hCD147–E73Q (red dots), and the double-mutant hCD147–E31Q/E73Q (green dots). Cells were either transfected with hCD147 alone (light dots) or cotransfected with hCD147 and human CAIV (dark dots). The significance indicators above the dots with CAIV (dark dots) refer to the corresponding dots without CAIV (light dots of same color).
Figure 2.
Figure 2.
Expression of MCT1 and CD147 in HEK-293 cells. A, representative Western blotting against MCT1 (upper blot) and GAPDH (lower blot) as loading control, from HEK-293 cells transfected with human CD147–WT (lane 1), hCD147–WT, and CAIV (lane 2), the mutant hCD147–E31Q/E73Q (lane 3), and hCD147–E31Q/E73Q and CAIV (lane 4), respectively. B, quantification of the relative protein level of MCT1 (as normalized to the signal of GAPDH in the same lane) in HEK-293 cells, transfected with hCD147–WT (lane 1), hCD147–WT + CAIV (lane 2), hCD147–E31Q/E73Q (lane 3), and hCD147–E31Q/E73Q + CAIV (lane 4), respectively. The significance indicators refer to the values of HEK-293 cells, transfected with hCD147–WT. n is given as the number of Western blots/number of batches of cells. C, representative Western blotting against CD147 (upper blot) and GAPDH (lower blot) as loading control, from HEK-293 cells, transfected with the empty vector pcDNA3 (lane 1), hCD147–WT or a mutant of CD147 (lanes 2, 4, 6, and 8), or cotransfected with hCD147 or a mutant of CD147 and CAIV (lanes 3, 5, 7, and 9). D, representative Western blotting against the Myc tag of the transfected CD147 (upper blot) and GAPDH (lower blot) as loading control, from HEK-293 cells, transfected with the empty vector pcDNA3.1 (lane 1), hCD147–WT or a mutant of hCD147 (lanes 2, 4, 6, and 8), or cotransfected with hCD147 or a mutant of hCD147 and CAIV (lanes 3, 5, 7, and 9).
Figure 3.
Figure 3.
Binding of CAIV to hCD147 requires the Glu-73 in the Ig1 domain of hCD147. A, representative Western blots of CAIV (left blot) and GST (right blot), respectively. CAIV was pulled down with GST (lane 1), a GST fusion protein of the Ig1 domain of hCD147–WT (lane 2), a GST fusion protein of Ig1 domain of the hCD147 mutant E31Q (lane 3), and a GST fusion protein of Ig1 domain of the hCD147 mutant E73Q (lane 4). B, relative intensity of the fluorescent signal of CAIV. For every blot, the signals for CAIV were normalized to the corresponding signals for GST–hCD147–WT. Each individual signal for CAIV was normalized to the intensity of the signal for GST in the same lane. The significance indicators above the dots refer to GST–hCD147–WT.
Figure 4.
Figure 4.
Alignment of the protein sequence, surrounding the CAIV-binding site of CD147 from human (BAA08109.1), rabbit (NP_001075843.1), rat (AAH59145.1), and mouse (BAA00486.1). The CAIV-binding site at position 73 is marked in red.
Figure 5.
Figure 5.
Functional interaction between rat MCT1 and CAIV in Xenopus oocytes requires direct binding of CAIV to Lys-73 in the Ig1 domain of rCD147. A, homology model of the Ig1 domain of rat CD147 (based on human CD147, PDB code 3B5H (37)). Glu-32 and Lys-73 are labeled in blue and red, respectively. B, original recordings of the change in intracellular H+ concentration during application of lactate and CO2/HCO3 in Xenopus oocytes, expressing rMCT1 together with rCD147–WT (gray traces), rCD147–E32A (blue traces), and rCD147–K73A (red traces), respectively. Cells were either expressing rMCT1 + rCD147 alone (light traces) or rMCT1 + rCD147 and human CAIV (dark traces). C and D, rate of change in intracellular H+ concentration (Δ[H+]/Δt) during application of lactate (C) and 5% CO2, 10 mm HCO3 (D) in Xenopus oocytes, expressing rMCT1 and rCD147–WT (gray dots), rCD147–E32A (blue dots), and rCD147–K73A (red dots), respectively. Cells were either expressing rMCT1 + rCD147 alone (light dots) or rMCT1 + rCD147 and CAIV (dark dots). The significance indicators above the dots with CAIV (dark dots) refer to the corresponding dots without CAIV (light dots of same color). E, representative Western blots of CAIV (left blot) and GST (right blot), respectively. CAIV was pulled down with GST (lane 1), a GST fusion protein of the Ig1 domain of rCD147–WT (lane 2), a GST fusion protein of Ig1 domain of rCD147–E32A (lane 3), and a GST fusion protein of Ig1 domain of rCD147–K73A (lane 4). Lysate of CAIV-expressing oocytes (lane 5) was added as positive control. F, relative intensity of the fluorescent signal of CAIV. For every blot, the signals for CAIV were normalized to the corresponding signals for GST–rCD147–WT. Each individual signal for CAIV was normalized to the intensity of the signal for GST in the same lane. The significance indicators above the dots refer to GST–rCD147–WT.
Figure 6.
Figure 6.
Functional interaction between rat MCT2 and CAIV in Xenopus oocytes requires direct binding of CAIV to Arg-130 in the Ig1 domain of rGP70. A, homology structure of the Ig1 domain of rat GP70 (based on human CD147, PDB code 3B5H (37)). Glu-95 and Arg-130 are labeled in blue and red, respectively. B, original recordings of the change in intracellular H+ concentration during application of lactate and CO2/HCO3 in Xenopus oocytes, expressing rMCT2 together with rGP70–WT (gray traces), rGP70–D95A (blue traces), and rGP70–R130A (red traces), respectively. Cells were either expressing rMCT2 + rGP70 alone (light traces) or rMCT2 + rGP70 and human CAIV (dark traces). C and D, rate of change in intracellular H+ concentration (Δ[H+]/Δt) during application of lactate (C) and 5% CO2, 10 mm HCO3 (D) in Xenopus oocytes, expressing rMCT2 and rGP70–WT (gray dots), rGP70–D95A (blue dots), and rGP70–R130A (red dots), respectively. Cells were either expressing rMCT2 + rGP70 alone (light dots) or rMCT1 + rGP70 and human CAIV (dark dots). The significance indicators above the dots with CAIV (dark dots) refer to the corresponding dots without CAIV (light dots of same color). E, representative Western blots of CAIV (left blot) and GST (right blot), respectively. CAIV was pulled down with GST (lane 1), a GST fusion protein of the Ig1 domain of rGP70–WT (lane 2), a GST fusion protein of Ig1 domain of rGP70–D95A (lane 3), and a GST fusion protein of Ig1 domain of rGP70–R130A (lane 4). F, relative intensity of the fluorescent signal of CAIV. For every blot, the signals for CAIV were normalized to the corresponding signals for GST–rGP70–WT. Each individual signal for CAIV was normalized to the intensity of the signal for GST in the same lane. The significance indicators above the dots refer to GST–rGP70–WT.
Figure 7.
Figure 7.
Functional interaction between rat MCT2 and CAIV in Xenopus oocytes requires direct binding of rGP70 to His-88 in CAIV. A, structure of human CAIV (PDB code 5JN9 (79). The amino acid residue His-88 is labeled in red. B, original recordings of the change in intracellular H+ concentration during application of lactate and CO2/HCO3 in Xenopus oocytes, expressing rMCT2 + rGP70 alone (black trace), together with human CAIV–WT (blue trace), or together with the CAIV mutant H88A. C and D, rate of change in intracellular H+ concentration (Δ[H+]/Δt) during application of lactate (C) and 5% CO2, 10 mm HCO3 (D) in Xenopus oocytes, expressing rMCT2 + rGP70–WT (gray dots), rMCT2 + rGP70–WT + CAIV–WT (blue dots), and rMCT2 + rGP70–WT + CAIV–H88A (red dots), respectively. The black significance indicators above the dots with CAIV refer to the corresponding dots without CAIV (gray dots). The blue significance indicators above the dots for CAIV–H88A refer to the corresponding dots with CAIV–WT (blue dots). E, relative amount of CAIV in CAIV–WT- and CAIV–H88A–expressing oocytes, as determined by Western blot analysis. The inset shows a representative Western blotting against CAIV for Xenopus oocytes expressing CAIV–WT (left lane) and CAIV–H88A (right lane), respectively. F, representative Western blots of CAIV (left blot) and GST (right blot), respectively. CAIV–WT was pulled down with GST (lane 1), and a GST fusion protein of the Ig1 domain of rGP70–WT (lane 2). The mutant CAIV–H88A was pulled down with a GST fusion protein of the Ig1 domain of rGP70–WT (lane 3). Lanes 1 and 2 in the blots are identical to lanes 1 and 2 in Fig. 8D. G, relative intensity of the fluorescent signal of CAIV. For every blot, the signals for CAIV were normalized to the corresponding signals for GST–rGP70 + CAIV–WT. Each individual signal for CAIV was normalized to the intensity of the signal for GST in the same lane. The significance indicators above the dots refer to GST–rGP70 + CAIV–WT.
Figure 8.
Figure 8.
CAIV–His-88 can function both as a proton donor and a proton acceptor for protein binding. A1–4, structural model of the direct interaction between human CAIV (PDB code 5JN9 (79)) and the Ig1 domain of rat GP70 (based on human CD147, PDB code 3B5H (37)). Amino acids that function as a proton donor are labeled in blue; amino acids that function as proton acceptor are labeled in red. A1, model of the interaction between CAIV–WT and rGP70–WT. In this scenario CAIV–His-88 and rGP70–Arg-130 can form a hydrogen bond with Arg-130 as a proton donor and His-88 as a proton acceptor. A2, model of the interaction between CAIV–WT and rGP70–R130E. In this scenario CAIV–His-88 and rGP70–Glu-130 can form a hydrogen bond with His-88 as proton donor and Glu-130 as proton acceptor. A3, model of the interaction between CAIV–H88K and rGP70–WT. In this scenario, CAIV–Lys-88 and rGP70–Arg-130 cannot form a hydrogen bond because both residues can only function as a proton donor, thereby missing a proton acceptor. A4, model of the interaction between CAIV–H88K and rGP70–R130E. In this scenario CAIV–Lys-88 and rGP70–Glu-130 can again form a hydrogen bond with Lys-88 as a proton donor and Glu-130 as a proton acceptor. B and C, rate of change in intracellular H+ concentration (Δ[H+]/Δt) during application of lactate (B) and CO2/HCO3 (C) in Xenopus oocytes, expressing rMCT2 + rGP70–WT (gray dots), rMCT2 + rGP70–WT + CAIV–WT (light blue dots), rMCT2 + rGP70–R130E + CAIV–WT (dark blue dots), rMCT2 + rGP70–WT + CAIV–H88K (light red dots), and rMCT2 + rGP70–R130E + CAIV–H88K (dark red dots), respectively. The significance indicators above the dots with CAIV refer to the corresponding dots without CAIV (gray dots). D, representative Western blots of CAIV (upper blot) and GST (lower blot), respectively. CAIV–WT was pulled down with GST (lane 1), a GST fusion protein of the Ig1 domain of rGP70–WT (lane 2), and a GST fusion protein of the Ig1 domain of the mutant rGP70–R130E (lane 3). The mutant CAIV–H88K was pulled down with a GST fusion protein of Ig1 domain of rGP70–WT (lane 4), and a GST fusion protein of the Ig1 domain of the mutant rGP70–R130E (lane 5), respectively. Lanes 1 and 2 in the blots are identical to lanes 1 and 2 in Fig. 7F. E, relative intensity of the fluorescent signal of CAIV. For every blot, the signals for CAIV were normalized to the corresponding signals for GST–rGP70 + CAIV–WT. Each individual signal for CAIV was normalized to the intensity of the signal for GST in the same lane. The significance indicators above the dots refer to GST–rGP70–WT + CAIV–WT.
Figure 9.
Figure 9.
A, structural model of the direct interaction between CAIV and CD147. CAIV (green cartoon) binds to the Ig1 domain of hCD147 (ochre cartoon) by formation of a hydrogen bond (dotted line) between CAIV–His-88 and CD147–Glu-73 (red sticks) with a distance of 3.2 Å. B, hypothetical model of the functional interaction between MCT, CD147/GP70, and CAIV. CAIV (green circle), which is tethered to the extracellular site of the plasma membrane via a GPI anchor (small green circles), binds MCTs via the Ig1 domain of their chaperones CD147 and GP70 (light ochre structure). This binding brings CAIV close enough to the transporter pore to shuttle protons between transporter and surrounding protonable residues (gray circle). On the intracellular site, CAII (light blue circle), which binds to the C-terminal tail of MCT1 and MCT4 (57, 62, 63), facilitates the exchange of protons between transporter and intracellular protonable residues (light gray circle) in a similar fashion as CAIV. By this noncatalytic mechanism, intracellular and extracellular carbonic anhydrases could facilitate proton-coupled lactate flux across the cell membrane.
Figure 10.
Figure 10.
Alignment of the amino acid sequence surrounding the putative CAIV-binding site of rat CD147 (AAH59145.1), Xenopus CD147 orthologue (NP_001089604.1), and the Xenopus neuroplastin orthologue (NP_001082482). The putative CAIV-binding site is marked in red.

References

    1. Bröer S., Rahman B., Pellegri G., Pellerin L., Martin J. L., Verleysdonk S., Hamprecht B., and Magistretti P. J. (1997) Comparison of lactate transport in astroglial cells and monocarboxylate transporter 1 (MCT 1) expressing Xenopus laevis oocytes. Expression of two different monocarboxylate transporters in astroglial cells and neurons. J. Biol. Chem. 272, 30096–30102 10.1074/jbc.272.48.30096 - DOI - PubMed
    1. Bröer S., Schneider H. P., Bröer A., Rahman B., Hamprecht B., and Deitmer J. W. (1998) Characterization of the monocarboxylate transporter 1 expressed in Xenopus laevis oocytes by changes in cytosolic pH. Biochem. J. 333, 167–174 10.1042/bj3330167 - DOI - PMC - PubMed
    1. Halestrap A. P., and Price N. T. (1999) The proton-linked monocarboxylate transporter (MCT) family: structure, function and regulation. Biochem. J. 343, 281–299 10.1042/0264-6021:3430281 - DOI - PMC - PubMed
    1. Halestrap A. P. (2013) The SLC16 gene family-structure, role and regulation in health and disease. Mol. Aspects Med. 34, 337–349 10.1016/j.mam.2012.05.003 - DOI - PubMed
    1. Garcia C. K., Brown M. S., Pathak R. K., and Goldstein J. L. (1995) cDNA cloning of MCT2, a second monocarboxylate transporter expressed in different cells than MCT1. J. Biol. Chem. 270, 1843–1849 10.1074/jbc.270.4.1843 - DOI - PubMed

Publication types

LinkOut - more resources