. 2017 Nov 17;7(11):6.
doi: 10.1038/s41398-017-0054-x.

Cerebral organoids reveal early cortical maldevelopment in schizophrenia-computational anatomy and genomics, role of FGFR1

Affiliations

Cerebral organoids reveal early cortical maldevelopment in schizophrenia-computational anatomy and genomics, role of FGFR1

E K Stachowiak et al. Transl Psychiatry. .

Abstract

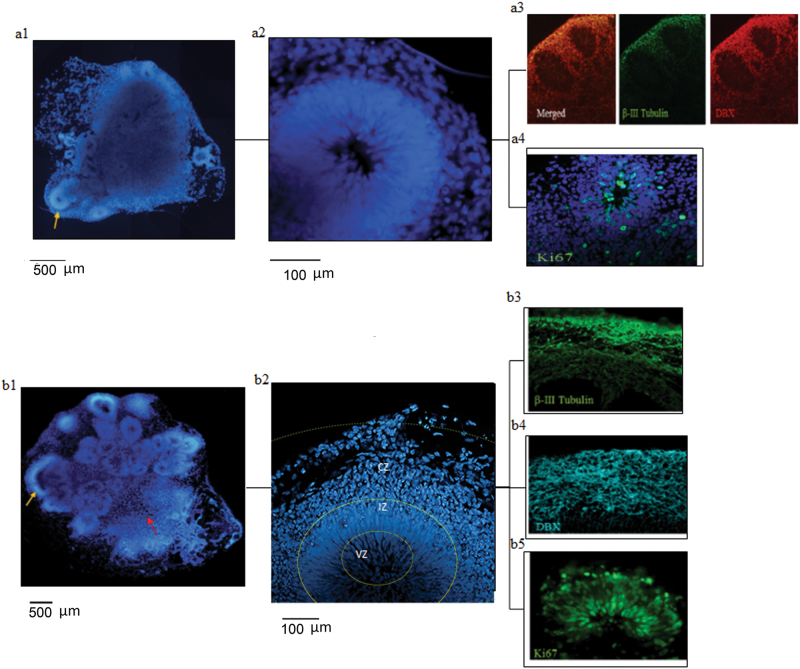
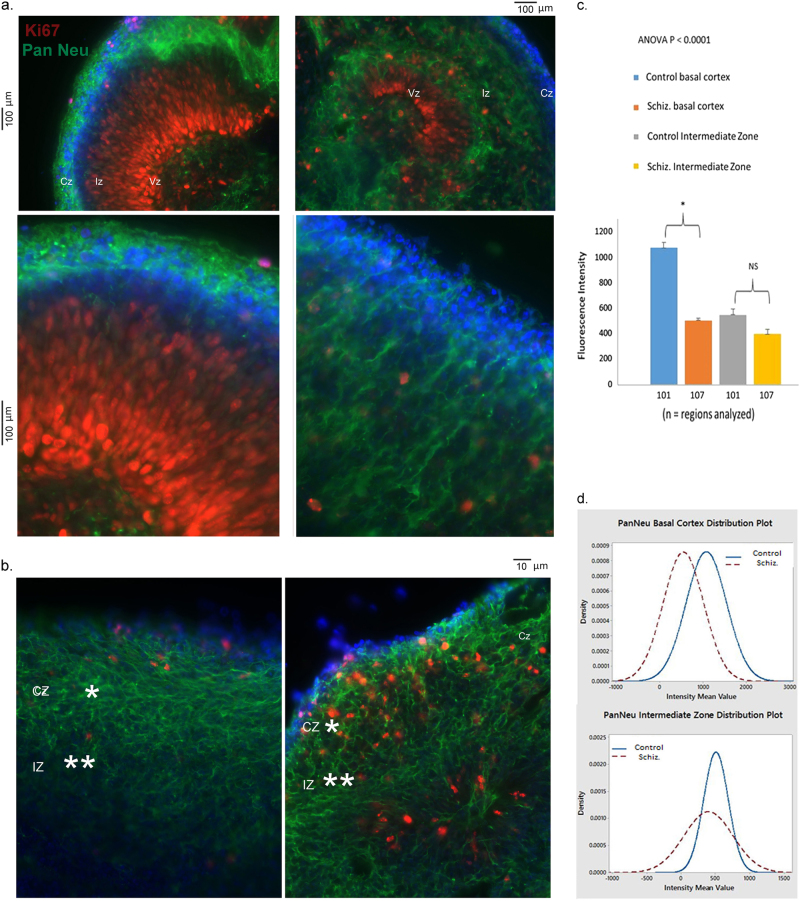
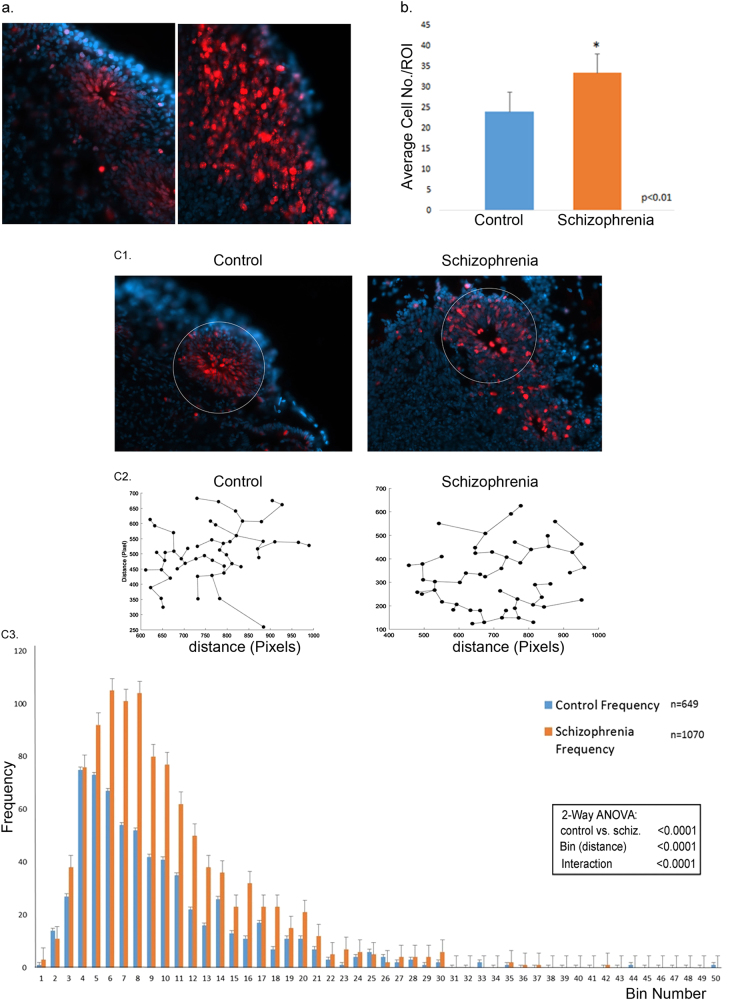
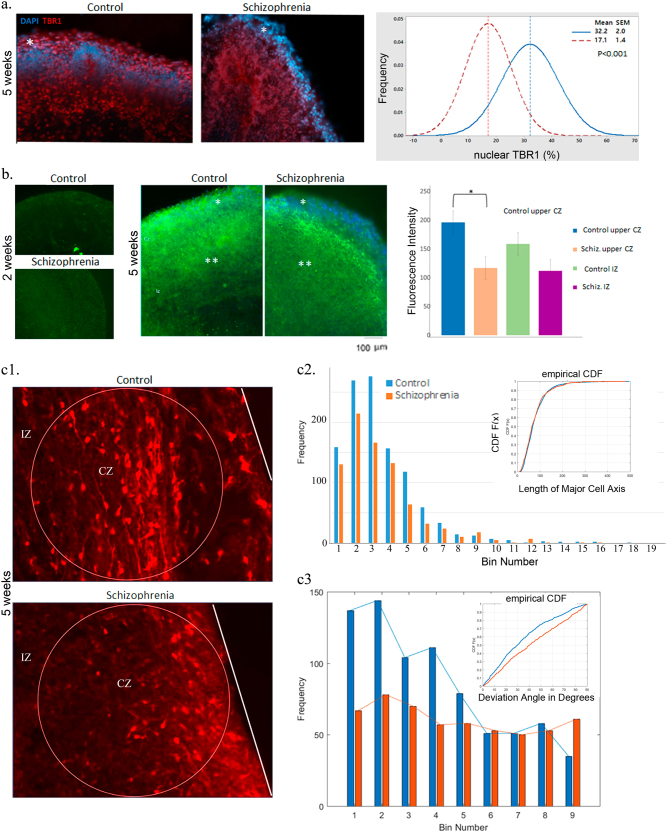
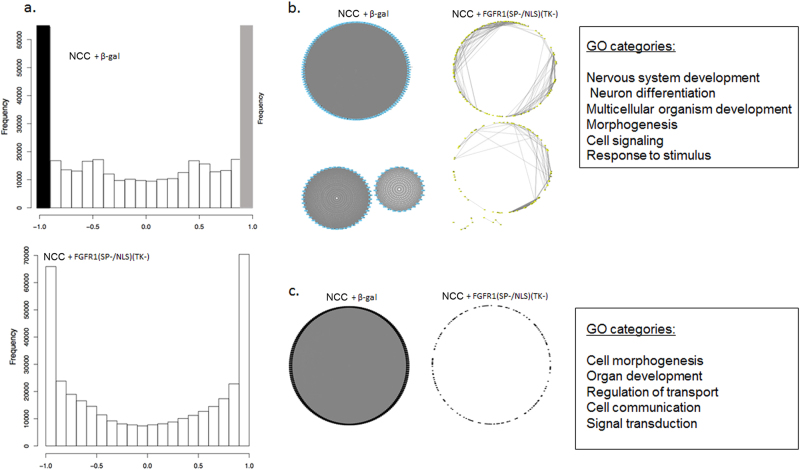
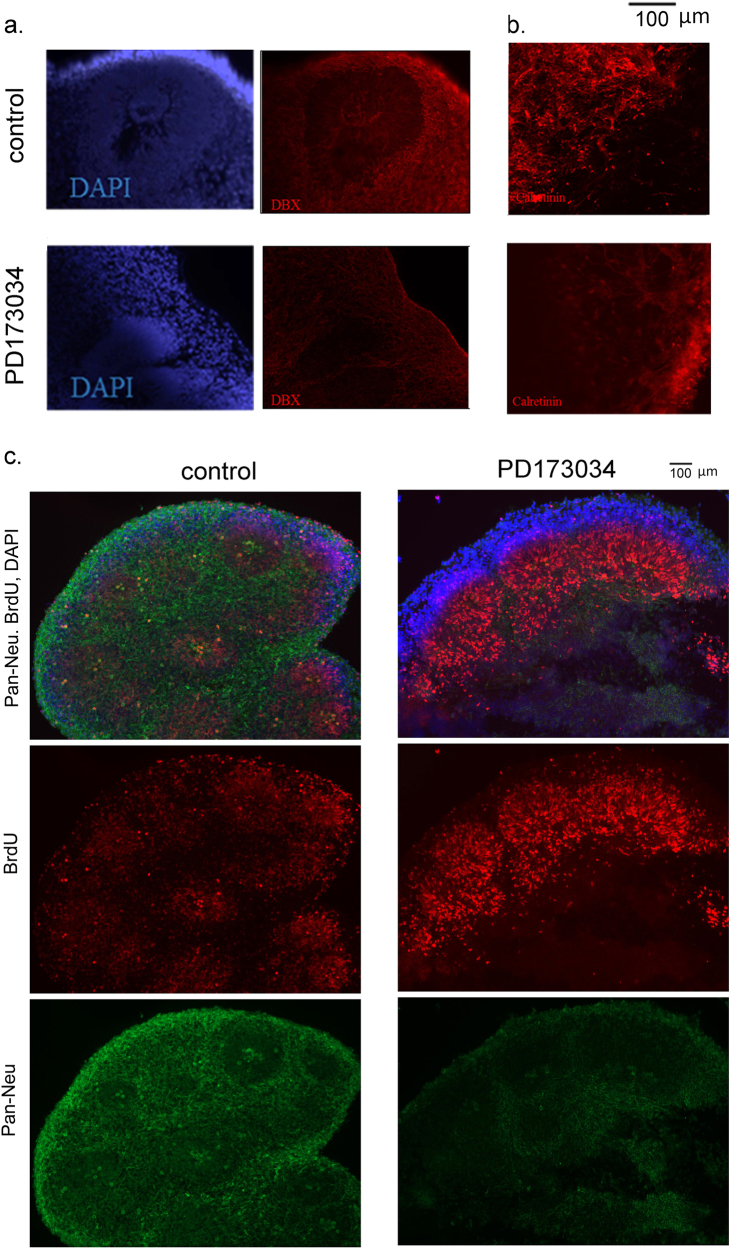
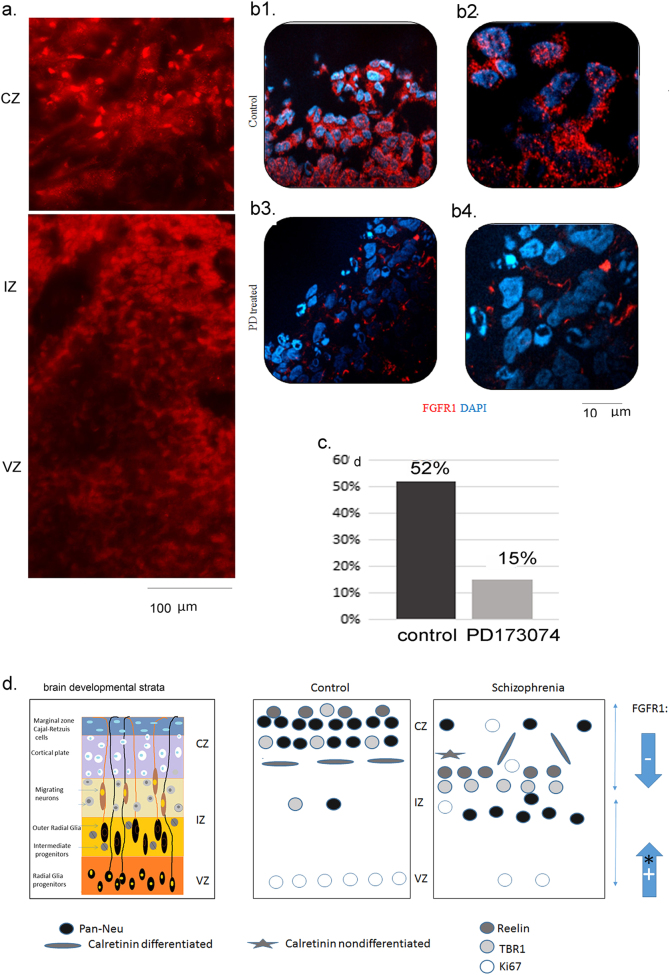
Studies of induced pluripotent stem cells (iPSCs) from schizophrenia patients and control individuals revealed that the disorder is programmed at the preneuronal stage, involves a common dysregulated mRNA transcriptome, and identified Integrative Nuclear FGFR1 Signaling a common dysregulated mechanism. We used human embryonic stem cell (hESC) and iPSC-derived cerebral organoids from four controls and three schizophrenia patients to model the first trimester of in utero brain development. The schizophrenia organoids revealed an abnormal scattering of proliferating Ki67+ neural progenitor cells (NPCs) from the ventricular zone (VZ), throughout the intermediate (IZ) and cortical (CZ) zones. TBR1 pioneer neurons and reelin, which guides cortico-petal migration, were restricted from the schizophrenia cortex. The maturing neurons were abundantly developed in the subcortical regions, but were depleted from the schizophrenia cortex. The decreased intracortical connectivity was denoted by changes in the orientation and morphology of calretinin interneurons. In schizophrenia organoids, nuclear (n)FGFR1 was abundantly expressed by developing subcortical cells, but was depleted from the neuronal committed cells (NCCs) of the CZ. Transfection of dominant negative and constitutively active nFGFR1 caused widespread disruption of the neuro-ontogenic gene networks in hESC-derived NPCs and NCCs. The fgfr1 gene was the most prominent FGFR gene expressed in NPCs and NCCs, and blocking with PD173074 reproduced both the loss of nFGFR1 and cortical neuronal maturation in hESC cerebral organoids. We report for the first time, progression of the cortical malformation in schizophrenia and link it to altered FGFR1 signaling. Targeting INFS may offer a preventive treatment of schizophrenia.


Conflict of interest statement

The authors declare that they have no competing financial interests.

Figures

Fig. 1
Fig. 1. Representative hESC (H9) cerebral organoids at (a) 8 and (b) 18 days of development
(a1, b1) tile scanning of DAPI; yellow arrows point to cortical rosettes, enlarged in a2 and b2; at day 18, zones are outlined—ventricular zone (VZ), intermediate zone (IZ), and cortical zone (CZ). Immunostaining: (A4, B5) Ki67+ proliferating cells; (a3, b3, b4), doublecortin (DCX+) neuroblasts, βIII-tubulin+ immature neurons
Fig. 2
Fig. 2. Disorganized migration of proliferating cells and depletion of cortical neurons in schizophrenia iPSC cerebral organoids
Organoids were coimmunostained for Ki67 (red) and Pan-Neu (green). Nuclei were stained with DAPI (blue). a 2-week organoids—images show representative sections of organoids, control (iPSC line BJ1) and schizophrenia (iPSC line 1835). In schizophrenia organoids, note the dispersion of proliferating (Ki67+) cells outside the VZ into IZ and CZ, fewer mature Pan-Neu+ neurons in CZ, and the appearance of Pan Neu+ neurons in the IZ. b 5-week iPSC organoids: control (line 2937) and schizophrenia (line 2038)—representative images of control and schizophrenia organoids. In schizophrenia organoids, note dispersion of Ki67+ cells into CZ, reduced density of Pan Neu+ neurites in basal CZ and the presence of Pan Neu+ cells with neurites in the IZ. 3D rotational confocal images of control (line 3651) and schizophrenia (line 1835) organoids are shown in Video 1a and b. Pan-Neu immunofluorescence intensity was measured in multiple randomly selected ROI (1 × 102 μm2 in basal cortex (*) and in IZ (**)). c 5-week organoids—Pan-Neu immunofluorescence intensity was measured in several ROIs (# shown on y-axis) of multiple organoids from three control and three schizophrenia patients. Note, significantly reduced Pan-Neu fluorescence intensity in basal cortex of the schizophrenia organoids and the lack of significant changes in the IZ. d Distribution of Pan-Neu intensity numbers in analyzed ROIs. Note the significant separation of the basal cortex plots in control and schizophrenia organoids and the lack of separation of the IZ plots
Fig. 3
Fig. 3. Quantification of disorganized migration of proliferating NPCs in schizophrenia compared to control cerebral organoids
a Exemplary images showing Ki67+ (red) proliferating NPCs in the center of the rosette of a control organoid (line 2937) and their dispersion in a schizophrenia organoid (line 2038) (nuclei were stained with DAPI). b Increased density of proliferating cells in schizophrenia organoids. ROIs were outlined on organoid images from three control and three schizophrenia patients, as shown in (c1). Bar graph shows significantly higher average numbers of the KI67+ proliferating cells in schizophrenia ROIs than in control ROIs (17 control and 20 schizophrenia ROIs quantified). c Global Minimum Spanning Tree (MST) analysis of Ki67+ NPC dispersion within ROIs (c1—examples) was carried out using 17 control and 20 schizophrenia ROIs from three control cases and three schizophrenia patients (total of 649 and 1070 cells analyzed, respectively). The shortest connecting edges between cells were identified in pixels (c2) using MST calculating program and were grouped into bins (c3). Bin 1 contains edges of 0–5 pixels, bin 2 of 5–10 pixels, etc. Frequency indicates average numbers of cells per bin in all ROIs measured. Schizophrenia organoids displayed a shift towards longer MST distances. Two-Way ANOVA showed a significant interaction between organoid phenotype (control vs. disease) and the MST distances
Fig. 4
Fig. 4. (a) Decreased nuclear TBR1 (red) expression in the upper cortical zone of 5-week schizophrenia organoids
Nuclei were stained with DAPI. Images show representative sections of control (iPSC line BJ1) and schizophrenia (iPSC line 2038) organoids. Total number of DAPI-stained nuclei and the number of nuclei expressing TBR1 were counted in multiple randomly selected ROI (5 × 103 μm2, ∼50 cells/ ROI) within the upper cortical layers (*6 cells deep) of three control individuals and three patients. Percent of (TBR1 + DAPI)/DAPI-stained nuclei was determined for each ROI. Graph shows distribution of the % of TBR1 expressing cells in the individual ROIs (26 control and 33 schizophrenia ROIs). The difference between control and schizophrenia mean values was significant (t-test). Individual value plots are shown in Supplementary Fig. 5b. b Decreased reelin expression in schizophrenia organoid cortex. Images show control (BJ1) and schizophrenia (1835) organoids. Note the lack of reelin staining in 2-week organoids. In 5-week organoids, reelin immunofluorescence intensity was determined in randomly selected ROIs (3 × 103 μm2) in the upper CZ (*) and in the IZ (**) regions of three control individuals and three patients using Zen 2.0 Blue Imaging software (22 control and 17 schizophrenia upper CZ ROIs and the same number of IZ ROIs). ANOVA of four groups followed by Tukey posthoc test showed a significant decrease in the reelin expression in the schizophrenia upper CZ and a lack of significant differences between control and schizophrenia in the IZ. Individual value plots are shown in Supplementary Fig. 5. c Morphology and orientation of cortical calretinin interneurons. c1—images of control and schizophrenia organoids. A total of 770 control and 547 schizophrenia calretinin interneurons were measured in 20 and 16 ROIs, respectively, in the organoids from three control and three schizophrenia patients. The average cell density (d = number of cells/ROI) was not significantly different between control and schizophrenia (Supplementary Fig. 3a, b). c2—graph shows cell distribution (cumulative frequency) relative to their total length, including the cell body and neurites. An average cell body had a length of ∼50 pixels, 18 μm. A two-sample Kolmogorov–Smirnov test of cumulative density function (CDF shown in the inset) of control and schizophrenia groups found no significant difference between the length of control and schizophrenia interneurons. c3—angles between the long axis of each cell and the cortical surface organoids were computed as described in the Supplementary Methods. Graph shows distribution of cells (cumulative frequency) in bins corresponding to the deviation angles from the cortical surface. A two-sample Kolmogorov–Smirnov CDF test (CDFs shown in the inset) of control and schizophrenia groups yielded a highly significant difference (p-value of <13.9 × 10−7) between the orientation of control and schizophrenia interneurons, relative to the cortical surface
Fig. 5
Fig. 5. High expression of nuclear (n)FGFR1 in subcortical cells and the loss of nFGFR1 in cortical cells of schizophrenia organoids.
a 2-week organoids: control (iPSC line BJ1) and schizophrenia (iPSC line 1835). Schizophrenia organoids have high FGFR1 expressing cells in VZ and dispersed in IZ. Few nFGFR1+ cells are present in CZ of the schizophrenia organoids. Images of whole sections are shown in Supplementary Fig. 4, a4 and a5. b 5-week organoids—control (BJ1) organoids express nFGFR1 in CZ and IZ (inset shows negative control—omitted primary FGFR1 antibody), and schizophrenia (1835) organoids show depletion of FGFR1 immunostaining in CZ. Arrow points to nuclei with FGFR1 speckles. 3D rotational confocal images of control (line 3651) and schizophrenia (line 1835) organoids are shown in Video 2a and b. c Quantification of the % of DAPI-stained nuclei that were immunopositive for nFGFR1 in multiple randomly selected ROI (3 × 103 μm2, ∼40 cells/ ROI) in the upper CZ. The % of nFGFR1+ DAPI-stained nuclei was determined for multiple ROIs from the three control individuals and three patients. The difference between control and schizophrenia mean values was significant (t-test). Plots show distribution of the % of nFGFR1 positive nuclei in individual control (18 ROIs) and schizophrenia (12 ROIs). The individual value plots are shown in Supplementary Fig. 5d
Fig. 6
Fig. 6. (a) Histogram of pairwise mRNA correlations
Correlation was performed using three controls and three patients and triplicate cell samples. NPCs were transfected with control DNA or FGFR1(SP-/NLS)(TK-) and 24 h later were stimulated for 48 h with neuronal differentiation inducing media with cAMP/BDNF/GDNF (NCCs). Genes (861), which were affected by dominant negative nuclear FGFR1(SP-/NLS)(TK-) were analyzed. Genes that showed the highest positive (+0.9 to +1.0) correlations (changing in the same direction) are represented by the gray bar. Genes that showed the highest negative (−0.9 to −1.0) correlations (changing in the opposite directions) are shown as a black bar. b, c Among the FGFR1(SP-/NLS)(TK-) regulated genes, top 200 of the positively correlated genes (b) and top 200, which were negatively correlated genes (c) were selected for the circular network analysis. Gray lines link pairs of genes whose correlation is greater than 0.9. In the control β-galactosidase set, three separate networks were formed. In the FGFR1(SP-/NLS)(TK-) transfected cells, two weakly correlated networks and few individual correlated genes are observed. GO categories overrepresented by 200 top connected genes are listed
Fig. 7
Fig. 7. Treatment with PD173074 (days 8 and 18) affects cortical development in hESC H9 organoids
a Double staining for DAPI and doublecortin (DBX, neuroblasts). b PD173074 reduces expression of calretinin in hESC organoids. c BrdU pulse-chase experiment. c—control hESC organoids, d—PD173074 treated (days 8 and 18) organoids. PD173074 inhibits cortical migration and neuronal differentiation of newborn cells in hESC organoids. Sections were coimmunostained for BrdU (red), Pan-Neu (green), and DAPI (blue). Merged and individual stains are shown. Inhibition of FGFR1 with PD173074 inhibits migration and formation of new BrdU+ cortical neurons in the CZ
Fig. 8
Fig. 8
a Distribution of FGFR1 in zones of hESC H9 organoids (fluorescent microscope images). b Reduction of nFGFR1 in CZ after PD173074 treatment (days 8–18)—confocal analysis of FGFR1 and DAPI co-staining; (b1) control and (b2) PD173074-treated cerebral organoids. (b3) control and (b4) PD173074, areas zoomed 63×. c Percentage of nFGFR1 expressing cells in CZ was reduced by PD173074—nFGFR1+ nuclei were counted in sets of 100 DAPI-stained nuclei. d Left—reference stratification of developing telencephalon and zones of cerebral organoids—ventricular (VZ), intermediate (IZ), cortical (CZ), marginal (MZ); middle and right—summary of results—in schizophrenia organoids, we found the following changes: (i) increased proliferation of Ki67 NPCs and migration outside the VZ into the IZ and CZ, (ii) diminished deposition of reelin in the developing cortex (known to guide cortico-petal migration), (iii) reduced cortical accumulation of pioneer TBR1 neurons and reduced formation of cortical neurons, (iv) stunted cortical neuronal development accompanied by a robust formation of the subcortical neurons, and (v) fewer calretinin interneurons forming horizontal processes (known to connect cortical columns). The premature development of NPCs into subcortical neurons may reflect excessive nFGFR1 (+)* signaling in differentiating schizophrenia NPCs (as found in earlier genomic studies). On the other hand, stunted cortical development likely reflects the loss of cortical nFGFR1 signaling. Modeling this loss in hESC organoids, by blocking FGFR1 signaling and depleting nFGFR1 with PD173074, replicates the impaired cortical development observed in schizophrenia iPSC organoids. The loss of cortical nnFGFR1 may underlie the stunted cortical development in schizophrenia

Similar articles

Cited by

References

    1. Arnold SE, Ruscheinsky DD, Han LY. Further evidence of abnormal cytoarchitecture of the entorhinal cortex in schizophrenia using spatial point pattern analyses. Biol. Psychiatry. 1997;42:639–647. doi: 10.1016/S0006-3223(97)00142-X. - DOI - PubMed
    1. Benes FM, Kwok EW, Vincent SL, Todtenkopf MS. A reduction of nonpyramidal cells in sector CA2 of schizophrenics and manic depressives. Biol. Psychiatry. 1998;44:88–97. doi: 10.1016/S0006-3223(98)00138-3. - DOI - PubMed
    1. Akbarian S, et al. Altered distribution of nicotinamide-adenine dinucleotide phosphate-diaphorase cells in frontal lobe of schizophrenics implies disturbances of cortical development. Arch. Gen. Psychiatry. 1993;50:169–177. doi: 10.1001/archpsyc.1993.01820150007001. - DOI - PubMed
    1. Bogerts B, Hantsch J, Herzer M. A morphometric study of the dopamine-containing cell groups in the mesencephalon of normals, Parkinson patients, and schizophrenics. Biol. Psychiatry. 1983;18:951–969. - PubMed
    1. Connor SE, et al. A study of hippocampal shape anomaly in schizophrenia and in families multiply affected by schizophrenia or bipolar disorder. Neuroradiology. 2004;46:523–534. doi: 10.1007/s00234-004-1224-0. - DOI - PubMed

Publication types

MeSH terms