. 2018 Nov 16;9(1):4826.
doi: 10.1038/s41467-018-07172-3.

Endothelial cell rearrangements during vascular patterning require PI3-kinase-mediated inhibition of actomyosin contractility

Affiliations

Endothelial cell rearrangements during vascular patterning require PI3-kinase-mediated inhibition of actomyosin contractility

Ana Angulo-Urarte et al. Nat Commun. .

Abstract

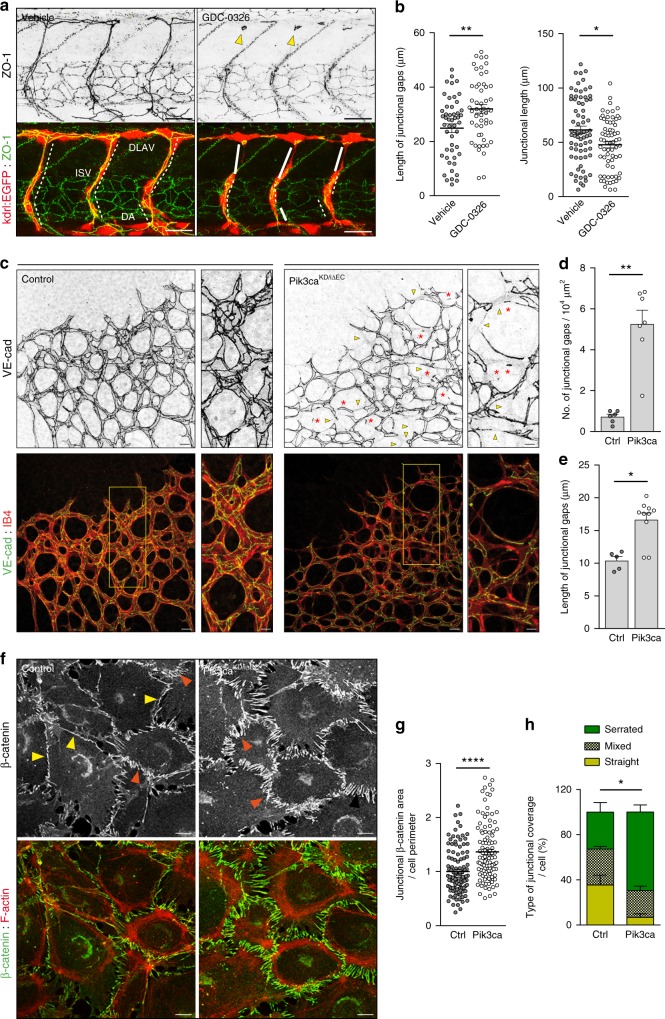
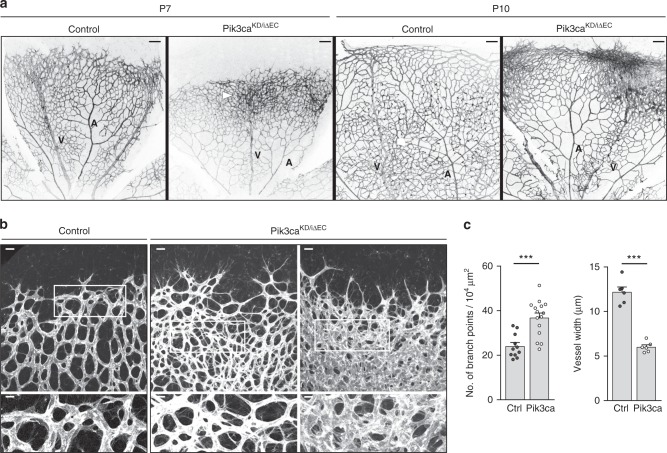
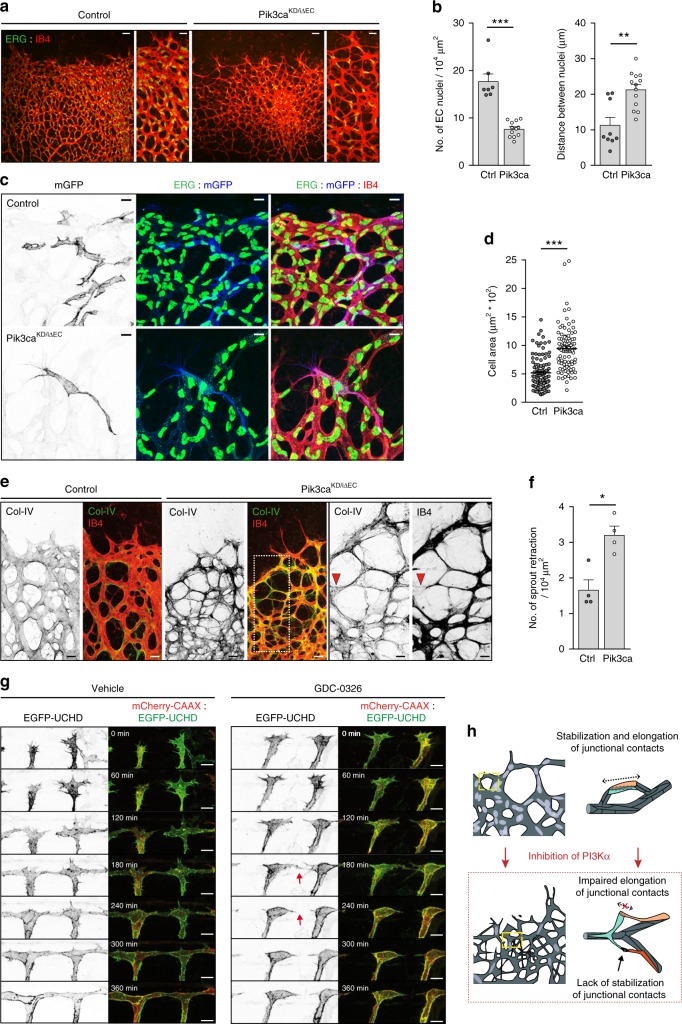
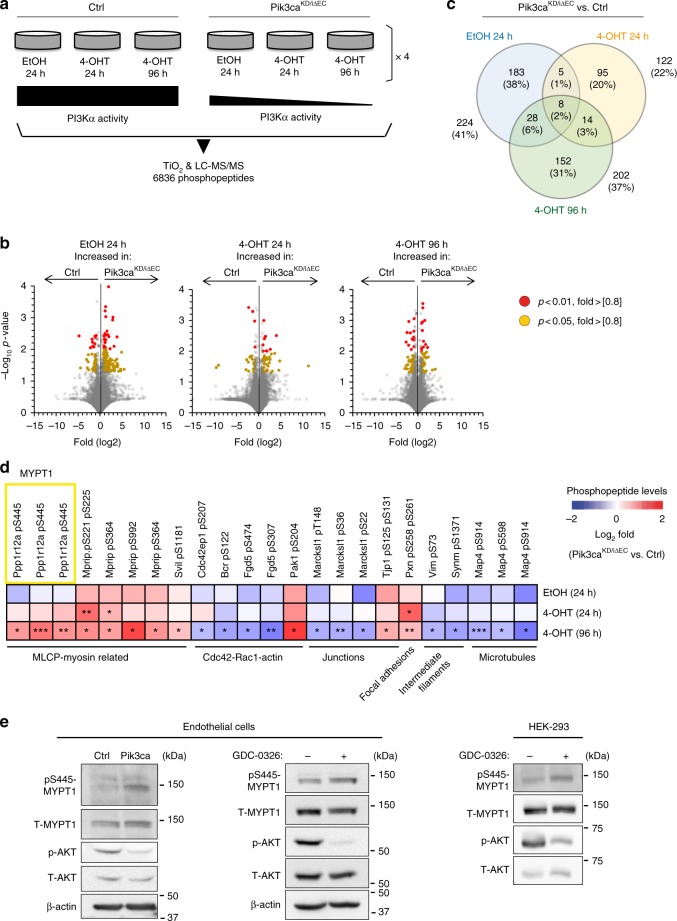
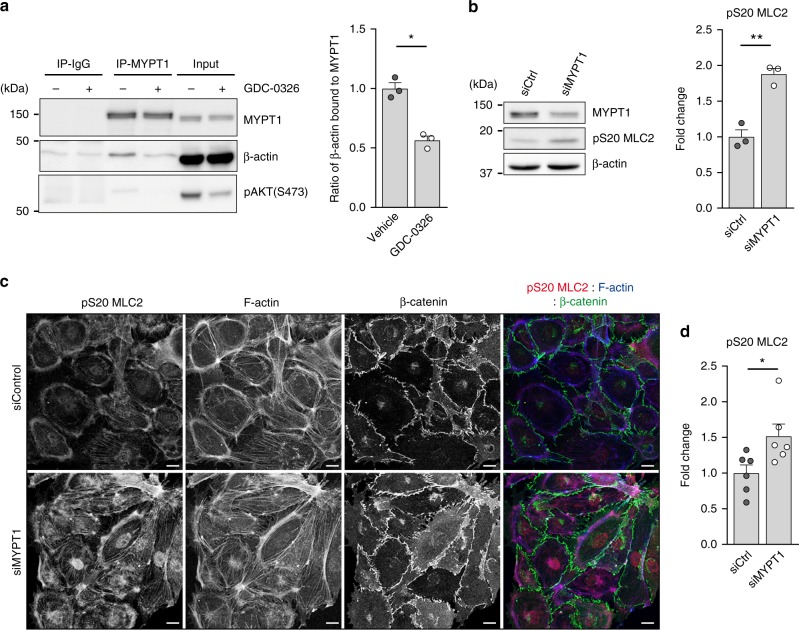
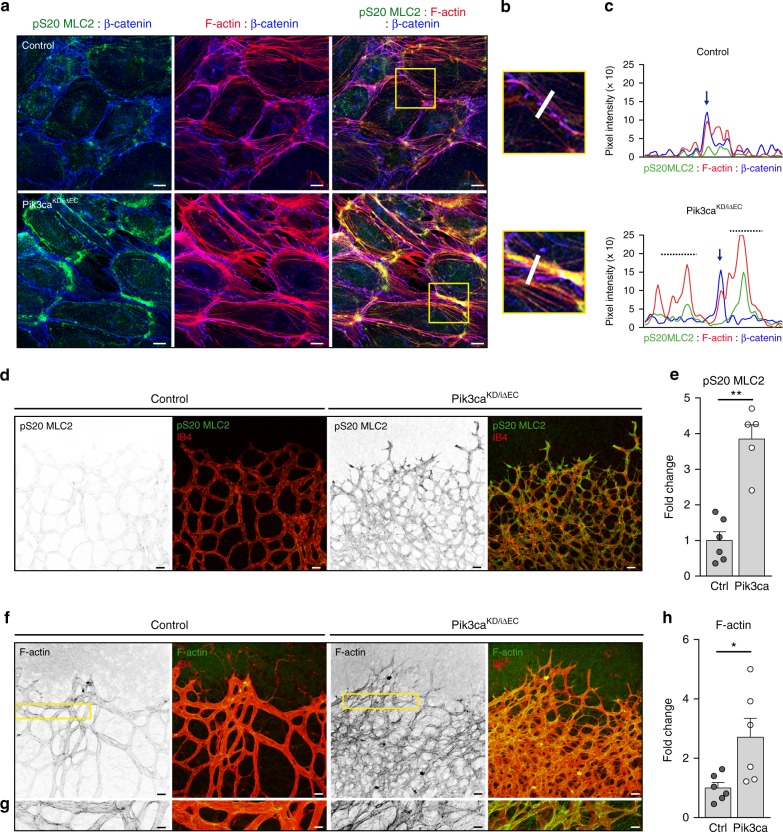
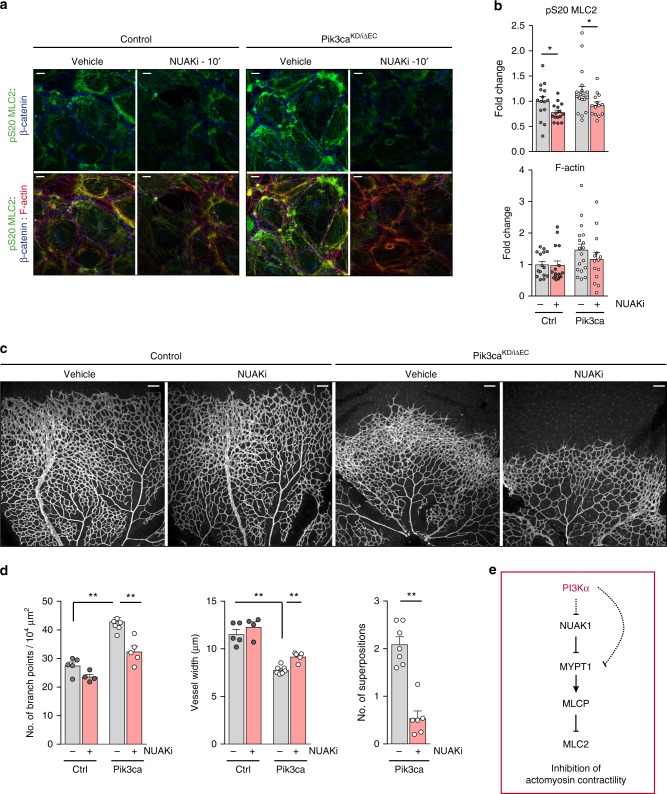
Angiogenesis is a dynamic process relying on endothelial cell rearrangements within vascular tubes, yet the underlying mechanisms and functional relevance are poorly understood. Here we show that PI3Kα regulates endothelial cell rearrangements using a combination of a PI3Kα-selective inhibitor and endothelial-specific genetic deletion to abrogate PI3Kα activity during vessel development. Quantitative phosphoproteomics together with detailed cell biology analyses in vivo and in vitro reveal that PI3K signalling prevents NUAK1-dependent phosphorylation of the myosin phosphatase targeting-1 (MYPT1) protein, thereby allowing myosin light chain phosphatase (MLCP) activity and ultimately downregulating actomyosin contractility. Decreased PI3K activity enhances actomyosin contractility and impairs junctional remodelling and stabilization. This leads to overstretched endothelial cells that fail to anastomose properly and form aberrant superimposed layers within the vasculature. Our findings define the PI3K/NUAK1/MYPT1/MLCP axis as a critical pathway to regulate actomyosin contractility in endothelial cells, supporting vascular patterning and expansion through the control of cell rearrangement.


Conflict of interest statement

M.G., O.C., and F.V. are recipients of an unrestricted research grant from Roche Pharma for the support of ProCURE program. The remaining authors declare no competing interests.

Figures

Fig. 1
Fig. 1
Defects in junctional remodelling upon inactivation of PI3Kα in endothelial cells. a Lateral views of intersomitic vessels (ISV) in vehicle and GDC-0326 (50 μM)-treated transgenic Tg(kdrl:EGFP)s843 (shown in red) embryos stained for ZO-1 (green) at 33 h post fertilization (hpf). Single ZO-1 staining is shown in upper row. DA refers to dorsal aorta and DLAV refers to dorsal longitudinal anastomotic vessels. White lines indicate ZO-1 negative staining; punctuate white lines indicate elongation of junction; yellow arrowheads show ring-shape junctions. b Quantification of the length of the dorsal part of the ISVs without ZO-1 (left graph) and length of the ISVs with continuous ZO-1 staining (right graph) in vehicle and GDC-0326 treated embryos (n ≥ 54 ISVs per treatment). c Representative maximum intensity projections of anti-VE-cadherin (green) and isolectin B4 (IB4, red) immunostained control and Pik3caKD/iΔEC mouse retinas at P7. Single channel is shown in upper row. Yellow islets show higher magnification of selected regions shown to the right. Yellow arrowheads indicate vascular segments without VE-cadherin staining; red asterisks indicate VE-cadherin-positive isolated rings or single-dots within the vascular tubes, indicating cell−cell junctional contacts that have not elongated. d, e Quantitative number of VE-cadherin-negative vessels (junctional gaps) per unit area (n ≥ 5 retinas per genotype) (d) and length of vessel structures without VE-cadherin (length of junctional gaps) (n ≥ 6 retinas per genotype) (e). f Confocal immunofluorescence images of primary mouse endothelial cells isolated from control and Pik3caKD/iΔEC mice stained for β-catenin (green) and F-actin (red) after being treated with 4-OHT for 72 h and re-plated on gelatin-coated slides for 24 h. Yellow arrowheads indicate straight junctional pattern; orange arrowheads indicate serrated junctional pattern. g Graph shows the average of β-catenin-positive area along junctional linescans (n ≥ 109 cells from six independent experiments). h Quantification of percentages of cells with serrated, straight or mixed junctions (n = 5 independent experiments). Scale bars, 30 µm (a), 20 µm (c), 10 µm (c small panel, f). Data in b, d, e, g, h represent mean ± SEM (error bars). *P < 0.05, **P < 0.01, ****P < 0.0001 were considered statistically significant. Statistical analysis was performed by the two-sided Mann–Whitney test
Fig. 2
Fig. 2
Endothelial PI3Kα regulates vascular growth. a Representative images of whole mount retinas stained with IB4 from control and Pik3caKD/iΔEC mouse littermates at P7 and at P10. Veins (V) and arteries (A) are indicated. White arrowheads show areas where the vascular plexus is superimposed. b Representative high-magnification images of whole mount retinas stained with IB4 from control and Pik3caKD/iΔEC mouse littermates at P7. Two independent areas for Pik3caKD/iΔEC retinas are shown. White islets show higher magnification of selected regions shown below. c Quantification of number of branch points per unit area and vessel width per unit area of control (Ctrl) and Pik3caKD/iΔEC (Pik3ca) retinas (n ≥ 6 retinas per genotype). Scale bars, 100 µm (a), 20 µm (b, upper panels), 10 µm (b, lower panels). Data represent mean ± SEM (error bars). ***P < 0.001. Statistical analysis was performed by the two-sided Mann–Whitney test
Fig. 3
Fig. 3
Cell stretching defects and anastomosis failure in Pik3caKD/iΔEC vessels. a Representative images of retinas stained for ERG (green) and IB4 (red) from control and Pik3caKD/iΔEC P7 pups. Higher magnification are shown to the right. b Quantification of endothelial cells per unit area assessed by ERG positivity and of the distance between two adjacent endothelial cell nuclei (n ≥ 6 retinas per genotype). c Immunostaining of single-cell labelling with membrane-bound GFP (mGFP, blue), endothelial nuclei (ERG, green) and blood vessel (IB4, red). Retinas from Pdgfb-iCre;Pik3caWT/flox were used as control. d Quantification of cell size of individual mGFP-positive cells in control and Pik3caKD/iΔEC retinas. At least 89 individual mGFP-positive cells from four independent retinas per genotype were quantified. e Images of control and Pik3caKD/iΔEC P7 retinas stained for collagen IV (green) and IB4 (red). Single channels are also shown. White punctuated islet in the image of a Pik3caKD/iΔEC retina shows higher magnification of selected region to the right. Red arrowheads indicate a retracting sprout. f Quantification of retracting sprouts per area (n = 4 retinas per genotype). g Images from a time-lapse movie (starting at 30 hpf) showing lateral views of ISV morphogenesis in transgenic Tg(UAS:EGFP-UCHD)ubs18;(kdrl:mCherry-CAAX)S916 embryos treated with vehicle (left panel) or GDC-0326 (50 μM) (right panel). Endothelial cell membrane is visualized in red and the actin cytoskeleton is visualized by F-actin binding domain of utrophin in green. Single channels are also shown. Red arrow shows a retracting event between two endothelial cells. h Schematic illustration showing the vascular defects driven by inactivation of PI3Kα (designed by Ana Angulo-Urarte). During vessel growth remodelling, stabilization, and elongation (punctuated arrow) of adherent junctional contacts is required between neighbouring endothelial cells to rearrange. Upon inactivation of PI3Kα, endothelial cells fail to stabilize (black arrow) and elongate (crossed punctuated arrow) junctional contacts. Scale bars, 40 µm (a), 20 µm (a amplified panels, e), 10 µm (c, e amplified panels) 15 µm (g). Data in b, d, and f represent mean ± SEM (error bars). *P < 0.05, **P < 0.01, ***P < 0.001. Statistical analysis was performed by the two-sided Mann−Whitney test
Fig. 4
Fig. 4
Phosphoproteomics elucidate downstream effectors of PI3Kα in endothelial cells. a Schematic illustration of the untargeted label-free mass spectrometry analysis. The study was conducted in Pik3caflox/flox (control) and Pdgfb-iCre;Pik3caKD/flox (Pik3caKD/iΔEC) mouse lung endothelial cells under exponential growing conditions upon preincubation with vehicle (EtOH) or 4-OHT for the indicated time points. The vehicle condition for analysis of the heterozygous inactivation of PI3Kα (Pik3caKD/flox without induction of CRE activity) was included as a further control and four different mice were analysed in each condition (a total of 24 samples). b Volcano plots exhibiting changes in phosphopeptides across genotypes. The Y axis represent the negative log10 of P value and the X axis shows the log2 of the fold change between control and Pik3caKD/iΔEC endothelial cells treated with vehicle (EtOH) for 24 h, 4-OHT for 24 h or 4-OHT for 96 h. Red and yellow dots represent significantly regulated phosphopeptides (P < 0.01 and P < 0.05 respectively) with a fold-change higher than 0.8 or lower than −0.8. c Venn diagram showing the number and percentage of phosphopeptides which are significantly upregulated or downregulated between experimental groups. Number and percentage of overlapping phosphopeptides between groups are also shown. d Heatmap indicating fold-changes in the phosphorylation of proteins related to the cytoskeleton. Phosphopeptides identified to be down- or upregulated in Pik3caKD/iΔEC vs. Ctrl are shown in blue and red, respectively across EtOH and 4-OHT treatments. Values shown represent mean fold-change over Ctrl. e Western blot validation of pS445 MYPT1 in mouse lung endothelial cells and HEK-293 cells upon genetic and pharmacological inhibition of PI3Kα. Control and Pik3caKD/iΔEC endothelial cells were treated with 4-OHT for 72 h, re-platted for 24 h and subjected to immunoblotting. Wild-type endothelial cells and HEK-293 cells were treated with vehicle or GDC-0326 for 48 h and subjected to immunoblotting. Quantification of at least three independent experiments is shown in Supplementary Figure 8
Fig. 5
Fig. 5
MYPT1 promotes dephosphorylation of MLC2 in endothelial cells. a Immunoblot analysis of HEK-293 cells treated with vehicle or GDC-0326 for 48 h using the indicated antibodies. Endogenous MYPT1 was immunoprecipitated and its ability to interact with actin was assessed in an overlay assay. Bars to the right show quantification of actin bound to total MYPT1 from three independent experiments. b Western blot analysis of MYPT1, pS20 MLC2 and β-actin in lysates of wild-type mouse lung endothelial cells transfected with siControl (siCtrl) or siMYPT1. Bars to the right show quantification of pS20 MLC2 normalized to β-actin from three independent experiments. c Images of endothelial cells transfected with siCtrl or siMYPT1, seeded on gelatin-coated plates 72 h post-transfection, and immunostained for β-catenin (green), pS20 MLC2 (red) and F-actin (blue). d Quantification of total cell pS20 MLC2 immunostaining intensity (shown as integrated density) of images shown in c (n ≥ 6 independent experiments). Scale bars, 15 µm (c). Data in a, b, and d represent mean ± SEM (error bars). *P < 0.05, **P < 0.01. Statistical analysis was performed in a, and b by the two-sided Student’s t test and in d by the two-sided Mann–Whitney test
Fig. 6
Fig. 6
Inactivation of PI3Kα results in increased actomyosin contractility. a pS20 MLC2 (green), F-actin (red) and β-catenin (blue) immunostaining of endothelial cells isolated from control and Pik3caKD/iΔEC mice treated with 4-OHT for 72 h and re-plated on gelatin-coated slides for 24 h. b Yellow islets show higher magnification of selected regions in a. c Representative fluorescence intensities of pS20 MLC2, β-catenin and F-actin immunostaining corresponding to the area depicted by the white line in b. Vertical blue arrows indicate endothelial junction between two endothelial cells. Punctuated lines highlight subcortical area. d pS20 MLC2 (green) and IB4 (red) staining of control and Pik3caKD/iΔEC P7 retinas. e Quantification of the intensity of pS20 MLC2 staining per vascular area (shown as integrated density) (n ≥ 5 retinas per genotype). f F-actin (green) and IB4 (red) staining of control and Pik3caKD/iΔEC P7 retinas. g High magnification of selected regions shown in (f) illustrates the increase in F-actin intensity induced in Pik3caKD/iΔEC endothelium. h Quantification of F-actin staining per vascular area (shown as integrated density) (n ≥ 6 retinas per genotype). Scale bars, 15 µm (a), 20 µm (d, f), 10 µm (g). Data in e and g represent mean ± SEM (error bars). *P < 0.05, **P < 0.01. Statistical analysis was performed by the two-sided Mann–Whitney test
Fig. 7
Fig. 7
Blockade of NUAK1 restores the endothelial phenotypes imposed by PI3Kα inactivation. a Confocal images of control and Pik3caKD/iΔEC endothelial cells treated with 4-OHT for 72 h, re-plated on gelatin-coated slides for 24 h and treated with 10 μM WZ4003 (NUAK1 inhibitor; NUAKi) or DMSO as control for 10 min, and stained for pS20 MLC2, β-catenin and F-actin. b Quantification of subcortical pS20 MLC2 (upper graph) and F-actin (lower graph) immunostaining intensities (shown as integrated density) (n ≥ 14 images of three independent experiments). c IB4-stained control and Pik3caKD/iΔEC retinas treated with DMSO as control or WZ4003 (NUAKi) at P6 (16:00), and isolated at P7 (1000 hours). d Quantification of branch points per unit area, vessel width per unit area, and superimposed vascular tubes per unit area (n ≥ 4 retinas per genotype and treatment). e Molecular mechanism by which PI3Kα suppresses actomyosin contractility. Scale bars, 15 µm (a), 100 µm (c). Data in b and d represent mean ± SEM (error bars). *P < 0.05, **P < 0.01. Statistical analysis was performed by the two-sided Mann–Whitney test

References

    1. Potente M, Gerhardt H, Carmeliet P. Basic and therapeutic aspects of angiogenesis. Cell. 2011;146:873–887. doi: 10.1016/j.cell.2011.08.039. - DOI - PubMed
    1. Adams RH, Alitalo K. Molecular regulation of angiogenesis and lymphangiogenesis. Nat. Rev. Mol. Cell Biol. 2007;8:464–478. doi: 10.1038/nrm2183. - DOI - PubMed
    1. Jakobsson L, et al. Endothelial cells dynamically compete for the tip cell position during angiogenic sprouting. Nat. Cell Biol. 2010;12:943–953. doi: 10.1038/ncb2103. - DOI - PubMed
    1. Phng LK, et al. Formin-mediated actin polymerization at endothelial junctions is required for vessel lumen formation and stabilization. Dev. Cell. 2015;32:123–132. doi: 10.1016/j.devcel.2014.11.017. - DOI - PubMed
    1. Arima S, et al. Angiogenic morphogenesis driven by dynamic and heterogeneous collective endothelial cell movement. Development. 2011;138:4763–4776. doi: 10.1242/dev.068023. - DOI - PubMed

Publication types

MeSH terms