. 2018 Nov 16;9(1):4811.
doi: 10.1038/s41467-018-06843-5.

A majority of HIV persistence during antiretroviral therapy is due to infected cell proliferation

Affiliations

A majority of HIV persistence during antiretroviral therapy is due to infected cell proliferation

Daniel B Reeves et al. Nat Commun. .

Abstract

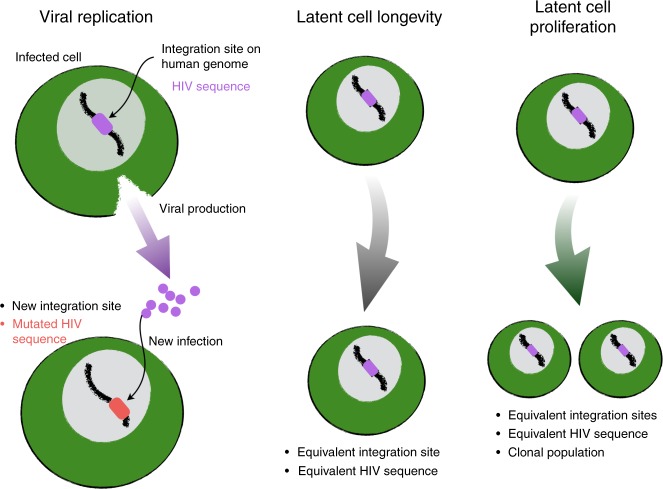
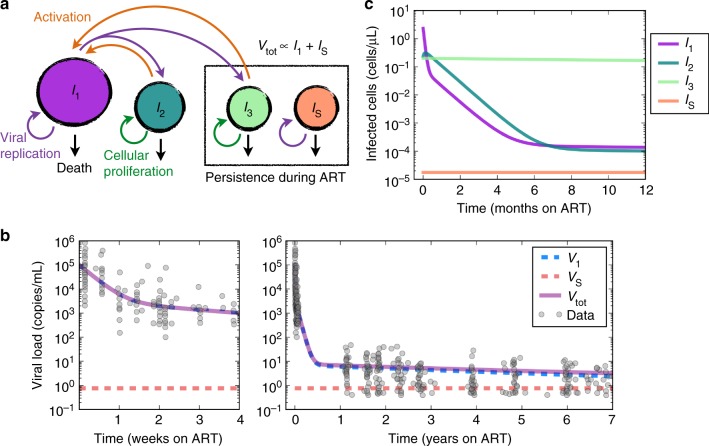
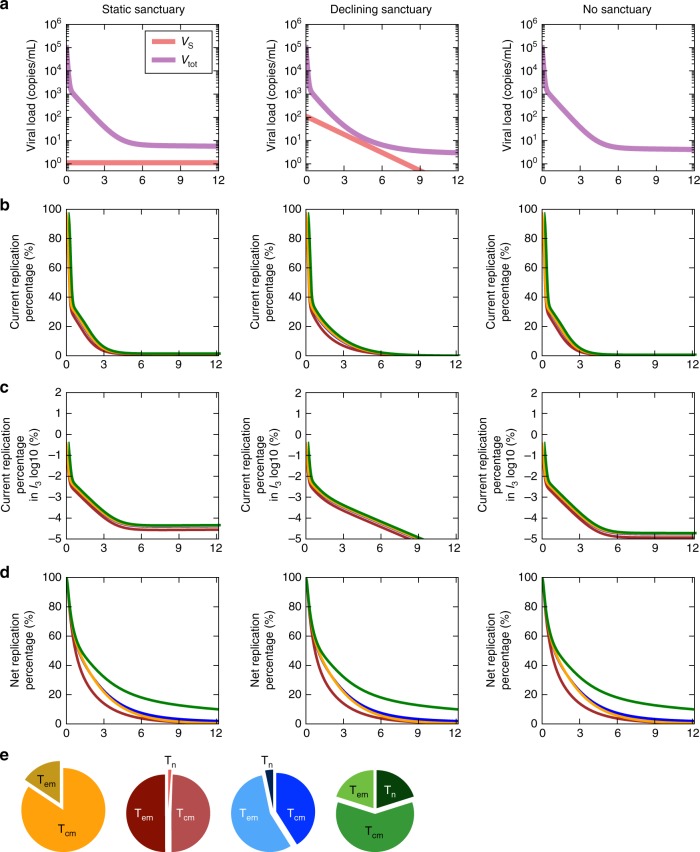
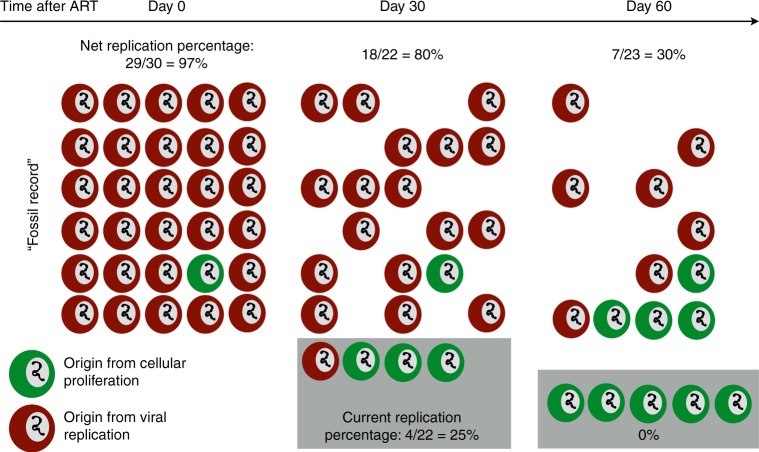
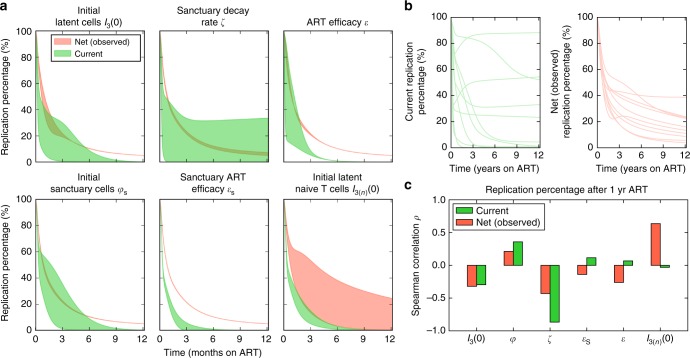
Antiretroviral therapy (ART) suppresses viral replication in people living with HIV. Yet, infected cells persist for decades on ART and viremia returns if ART is stopped. Persistence has been attributed to viral replication in an ART sanctuary and long-lived and/or proliferating latently infected cells. Using ecological methods and existing data, we infer that >99% of infected cells are members of clonal populations after one year of ART. We reconcile our results with observations from the first months of ART, demonstrating mathematically how a fossil record of historic HIV replication permits observed viral evolution even while most new infected cells arise from proliferation. Together, our results imply cellular proliferation generates a majority of infected cells during ART. Therefore, reducing proliferation could decrease the size of the HIV reservoir and help achieve a functional cure.


Conflict of interest statement

The authors declare no competing interests.

Figures

Fig. 1
Fig. 1
Genetic signatures of HIV persistence during ART. Viral replication despite antiretroviral therapy (ART) would lead to accrual of new mutations (HIV sequence color change) and novel chromosomal integration sites in newly infected cells. Longevity of latently infected cells maintains sequences and integration sites. Cellular proliferation of latently infected cells produces clonal populations carrying identical HIV sequences in identical integration sites
Fig. 2
Fig. 2
Evidence for clonal HIV sequences. a Total HIV DNA from integration site data, arranged as rank-abundance curves. Each panel represents a participant, and each curve the time point during ART (indicated in years in the panel legend). W and M in the panel headings distinguish the study. b Similar rank-abundance curves for replication-competent HIV DNA. Each panel represents a participant. Data used for analysis in Figs. 3 and 5 (noted by asterisks in panel titles) have sample size N > 20 sequences. c, d Sample sizes of total HIV DNA (c) and replication-competent HIV DNA (d) at each participant time point plotted against corresponding observed sequence richness. For all HIV DNA data and replication-competent HIV DNA data with sufficient sampling (N > 20), the observed richness is less than the sample size (below the dotted line y = x), owing to the presence of sequence clones. Observed richness correlates with sample size, indicating further sampling consistently uncovers new sequences. e, f Sample rarefaction curves for all 17 time points from the 8 study participants from a and five sufficiently sampled study participants from b. Rarefaction demonstrates the number of distinct integration sites or HIV sequences expected from a given sample size. For both data sources, at low sample size, distinct sequences are expected from each new sample. As sample size increases, distinct sequences are increasingly less likely to be detected owing to the presence of repeatedly detected sequence clones. Thus, curves increasingly flatten until all unique sequences are detected and the curve is completely flat. All colors correspond to data in a and b
Fig. 3
Fig. 3
Observations underestimate the number of distinct HIV sequences during ART. Observed sequence richness underestimates the true HIV sequence richness. For both data sources, Chao1 provides an estimate of the lower bound (min) of true sequence richness (error bars are asymmetric confidence intervals, see Supplementary Methods). In all cases, Chao1 estimates are above observed values. Our conservative modeling technique estimates a much higher upper bound (max) for true sequence richness. Nevertheless, the total HIV sequence population size (dashed lines: 109 for total HIV DNA and 107 for replication-competent HIV) is 1–2 orders of magnitude above the upper bound estimates for sequence richness, suggesting substantial clonality of HIV sequences. All marker colors correspond to data in Fig. 2a and b
Fig. 4
Fig. 4
Ecologic modeling suggests a majority of HIV DNA sequences are clonal. To describe the true rank-abundance distribution of the HIV reservoir, we used a power-law model and recapitulated experimental sampling (sample size equal to the experimental sample size) from 2500 theoretical power-law distributions to fit the best model to participant data in Fig. 2a. Theoretical distributions varied according to the slope of the power-law and the true sequence richness but were fixed at 109 total HIV DNA sequences. a Five best model fits (m1–5) to cumulative proportional abundance curves from a single representative participant time point (black circles: WR, 12 years on ART). b Heat map representing model fit (dark blue optimal) according to power-law exponent α and true sequence richness R. Black shaded area represents parameter sets excluded based on mathematical constraints of the power-law (upper bound on sequence richness). A wide range of values for sequence richness allow excellent model fit while the power-law exponent exponent is well-defined. c, d Extrapolations of five best models for the participant time point to a reservoir size of 109 cells carrying integrated HIV DNA. c Cumulative proportional abundances show that 104 to 107 clones constitute the entire reservoir. d Rank-abundance curves show the largest 1000 clones consist of >104 cells each. e, f Extrapolations of the maximum richness best-fit model for each participant time point (colored to match Fig. 2a) to a total HIV DNA reservoir size of 109 cells. e For each participant time point, even with the maximum possible sequence richness, we note a predominance of sequence clones. 50% of the reservoir may be held in the top 200 to 20 million clones. f A small number of massive clones (top 1000 clones) each consist of >104 cells and a massive number of smaller clones (~107) each consist of many fewer cells (<100)
Fig. 5
Fig. 5
Ecologic modeling suggests a majority of replication-competent HIV sequences are clonal. To describe the true rank-abundance distribution of the HIV reservoir, we used a power-law model and recapitulated experimental sampling (sample size equal to the experimental sample size) from 2500 theoretical power-law distributions to fit the best model to participant data in Fig. 2b. Theoretical distributions varied according to the slope of the power-law and the true sequence richness but were fixed at 107 replication-competent HIV DNA sequences. a Five best model fits (m1–5) to cumulative proportional abundance curves from a single representative participant (black circles: S10). b Heat map representing model fit (dark blue optimal) according to power-law exponent α and true sequence richness R. Black shaded area represents parameter sets excluded based on mathematical constraints of the power-law (upper bound on sequence richness). A wide range of values for sequence richness allow excellent model fit while power-law exponent is well-defined. c, d Extrapolations of five best models for a single participant to a reservoir size of 107 cells carrying replication-competent HIV. c Cumulative proportional abundances show that the top 200,000 ranked clones constitute the entire reservoir. d Rank-abundance curves show the top 100 clones consist of >2000 cells each. e, f Extrapolations of the maximum richness best-fit model for each sufficiently sampled participant (colored to match Fig. 2b) to a replication-competent reservoir size of 107 cells. e For each participant, even with the maximum possible sequence richness, we note a predominance of sequence clones. 50% of the reservoir may be held in the top 2 to 20 clones. f A small number of massive clones (top 100 clones) each consist of >103 cells and a massive number of smaller clones (~105) each consist of many fewer cells (<100)
Fig. 6
Fig. 6
Mechanistic modeling of HIV RNA decay during ART. a Model schematic: I1 cells produce virus, pre-integration latent cells I2 are longer lived and transition to I1, and long-lived latently infected cells I3(j) proliferate and die at measured rates depending on cell phenotype j (e.g., effector memory, central memory, naive). Sanctuary cells IS allow ongoing HIV replication despite ART. Parameters and their values are discussed in the Methods and listed in Table 1. b The mathematical model recapitulates observed HIV RNA data over weeks and years of ART. V1 is virus derived from I1 while VS is derived from IS. c I3 becomes the predominant infected cell state early during ART. IS is constrained to be very small to explain the lack of detectable viremia on fully suppressive ART. Lines are colored to match schematic in a
Fig. 7
Fig. 7
Most infected cells are generated via proliferation within 6 months of ART initiation. Model simulations contrast the number of cells generated by viral replication with those generated by cellular proliferation. The fraction of cells that arose due to viral replication at a time point is referred to as the current replication percentage. The fraction of cells remaining that arose at any time due to viral replication is referred to as the net replication percentage. Simulations are identical except for different assumptions regarding a drug sanctuary (IS) in each column. a Moving left to right, we assume a static drug sanctuary, a slowly declining drug sanctuary and no drug sanctuary. b Under all assumptions, once ART is initiated, most current infected cells arise due to cellular proliferation as opposed to HIV replication after 12 months of ART. c Current latently infected reservoir cells (I3) are generated almost entirely by proliferation soon after ART is initiated under all conditions. d The fraction of cells that remain that were generated by replication at any time (net) overestimates the fraction generated current percentage during the first 6 months of ART—a trend that is more notable when the reservoir contains a higher proportion of slowly proliferating naive T cells. Importantly, this is the quantity that would be observed experimentally (see Fig. 8). e Pie charts indicate reservoir compositions of T cell subsets from published data and correspond with colored lines in ad
Fig. 8
Fig. 8
Qualitative illustration of the fossil record phenomenon. In an example population of 30 infected cells, the proportion of infected cells that were once generated by HIV replication (the net replication percentage, or fossil record of HIV replication) remains >30% for the first 2 months of ART. However, in this time, the proportion of cells newly generated by HIV replication (current, shaded box) becomes negligible. The net fraction is observed experimentally, so our simulations indicate a contemporaneous representation of the HIV reservoir cannot be observed until the fossil record is completely washed out, sometime between 6 months and a year of ART
Fig. 9
Fig. 9
Sensitivity analysis of model results. ac See Methods for complete simulated parameter ranges. a Local sensitivity analysis (green: current; red: net, or observed) revealed no meaningful difference in percentage of new infected cells generated by viral replication after a year of ART despite variability in initial reservoir volume I3(0), sanctuary fraction φS, and ART effectiveness in and out of the sanctuary (ϵS and ϵ). Only an extremely low, or zero, sanctuary decay rate ζ predicted that a meaningful percentage (25%) of infected cells would be newly generated by HIV replication at one year, despite the fact that signals of evolution are not typically observed at this time point. Including a high percentage of slowly proliferating naive CD4+ T cells (Tn) in the reservoir alters the percentage of net, but not current, replication percentage. b 25 examples from 1000 global sensitivity analysis simulations. HIV replication accounted for fewer than 25% of current and net infected cells after a year of ART in a majority of simulations. c The parameters most correlated with current and net replication percentage at 1 year of ART are different. Current replication percentage inversely correlates with sanctuary decay rate while net (observed) replication percentage positively correlates with reservoir composition (quantified with the fraction of naive latently infected cells). Correlations are measured with the Spearman correlation coefficient

References

    1. Volberding PA, Deeks SG. Antiretroviral therapy and management of HIV infection. Lancet. 2010;376:49–62. doi: 10.1016/S0140-6736(10)60676-9. - DOI - PubMed
    1. Crooks AM, et al. Precise quantitation of the latent HIV-1 reservoir: implications for eradication strategies. J. Infect. Dis. 2015;212:1361–1365. doi: 10.1093/infdis/jiv218. - DOI - PMC - PubMed
    1. Siliciano JD, et al. Long-term follow-up studies confirm the stability of the latent reservoir for HIV-1 in resting CD4+ T cells. Nat. Med. 2003;9:727–728. doi: 10.1038/nm880. - DOI - PubMed
    1. Lorenzo-Redondo R, et al. Persistent HIV-1 replication maintains the tissue reservoir during therapy. Nature. 2016;530:51–56. doi: 10.1038/nature16933. - DOI - PMC - PubMed
    1. Gunthard HF, et al. Evolution of envelope sequences of human immunodeficiency virus type 1 in cellular reservoirs in the setting of potent antiviral therapy. J. Virol. 1999;73:9404–9412. - PMC - PubMed

Publication types

MeSH terms

Substances