. 2018 Nov 16;9(1):4821.
doi: 10.1038/s41467-018-07341-4.

RET rearrangements are actionable alterations in breast cancer

Affiliations

RET rearrangements are actionable alterations in breast cancer

Bhavna S Paratala et al. Nat Commun. .

Abstract

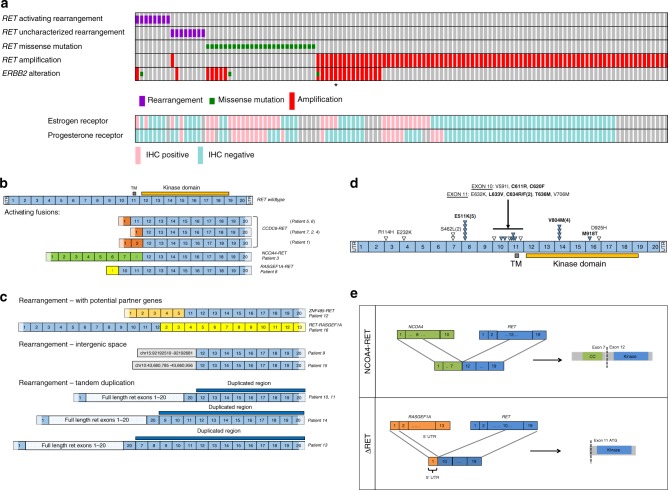
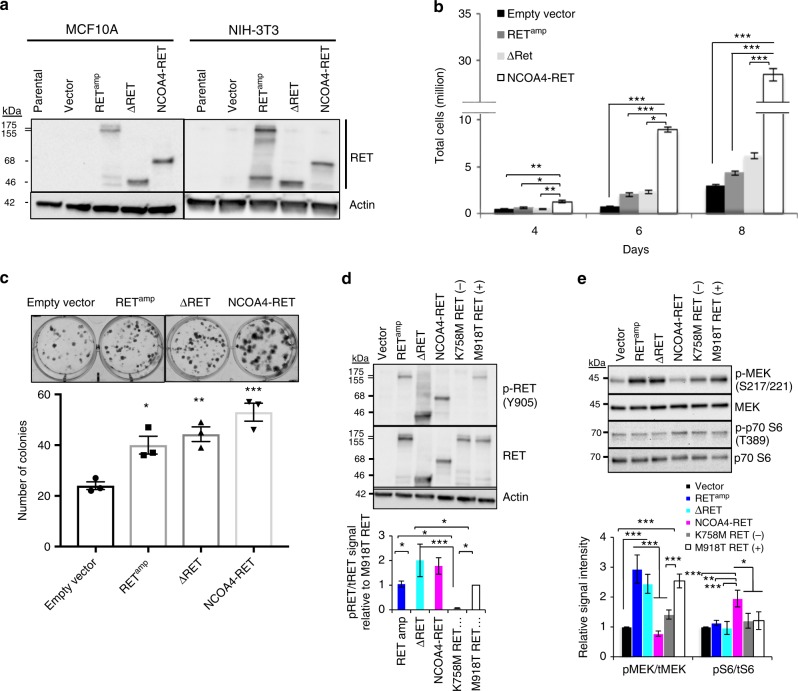
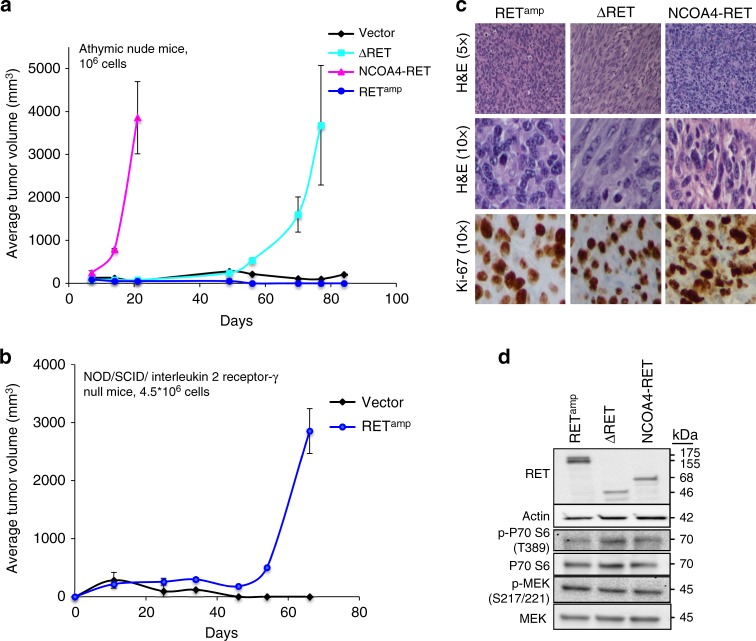
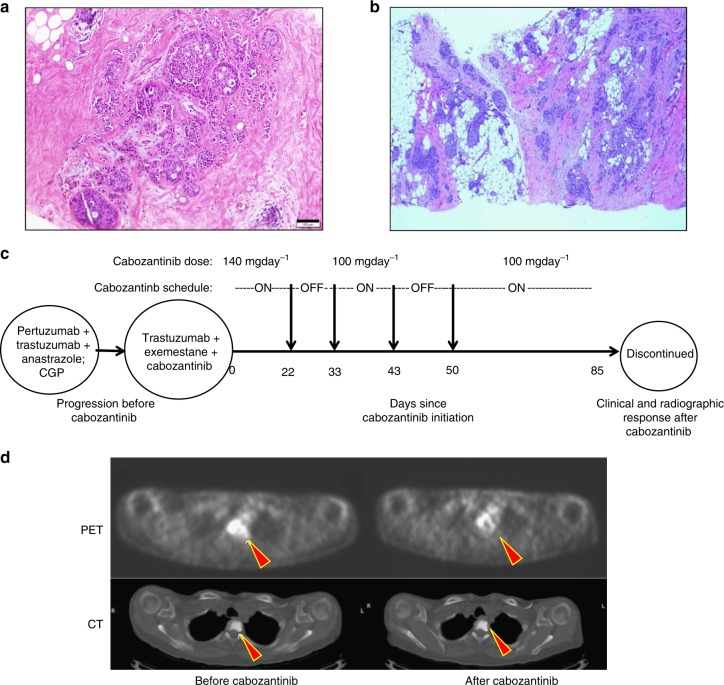
Fusions involving the oncogenic gene RET have been observed in thyroid and lung cancers. Here we report RET gene alterations, including amplification, missense mutations, known fusions, novel fusions, and rearrangements in breast cancer. Their frequency, oncogenic potential, and actionability in breast cancer are described. Two out of eight RET fusions (NCOA4-RET and a novel RASGEF1A-RET fusion) and RET amplification were functionally characterized and shown to activate RET kinase and drive signaling through MAPK and PI3K pathways. These fusions and RET amplification can induce transformation of non-tumorigenic cells, support xenograft tumor formation, and render sensitivity to RET inhibition. An index case of metastatic breast cancer progressing on HER2-targeted therapy was found to have the NCOA4-RET fusion. Subsequent treatment with the RET inhibitor cabozantinib led to a rapid clinical and radiographic response. RET alterations, identified by genomic profiling, are promising therapeutic targets and are present in a subset of breast cancers.


Conflict of interest statement

J.H.C., B.Y., A.B.S., L.M.G., J.S.R., and S.M.A. are employees of and own stock in Foundation Medicine, Inc. K.M.H. is now an employee of and owns stock in Merck. The remaining authors declare no competing interests.

Figures

Fig. 1
Fig. 1
Recurrent RET rearrangements in breast cancer. a OncoPrint of RET alterations in breast cancer. A case-by-case comparison of 121 breast cancers (column) carrying either a RET activating or uncharacterized rearrangement, missense mutation, or amplification (rows) to their ERBB2 amplification status (row) by clinical genomic profiling and available ER (Estrogen Receptor), PR (Progesterone Receptor) status (rows) from routine immunohistochemistry, generated using the oncoprint software,. Only one case harbored both a RET rearrangement and a RET amplification. *RET protein expression in tissue from case with RET amplification is verified by western blot (Supplementary Fig. 4c). b RET fusions. Exon composition comparing full-length, wild-type RET with activating fusions identified in this study. Activating fusions maintain the exons (12–19) required for an intact kinase domain. Six patient samples carried the CCDC6-RET fusion. NCOA4-RET and a novel RASGEF1A-RET fusion initially detected in the index cases are functionally characterized in this report. UTR untranslated region, TM Transmembrane domain. c RET rearrangements. Exon composition of rearrangements including RET exons fused with novel partner genes (ZNF485, RASGEF1A), rearrangements of kinase domain-coding exons 12–19 of RET into intergenic space, rearrangements resulting in tandem duplications that involve exons 12–19 of RET. d RET point mutations. Schematic depicting location and number of the 25 RET mutations. Filled triangles and bold font indicate characterized activating mutations based on literature and open triangles represent uncharacterized mutations that have been described as somatic in cancer. Number in bracket represents number of cases. e Illustration of index case fusions (NCOA4-RET and RASGEF1A-RET) depicting breakpoints in exon 8 for NCOA4 and intron 11 for RET resulting in a product encoding NCOA4 (exons 2–7) fused to RET (exons 12–19). Breakpoints in intron 1 of RASGEF1A and intron 9 of RET modeled to result in an N-terminally truncated product ΔRET, as exon 1 of RASGEF1A is part of 5′ UTR and exon 11 of RET contains a potential alternate start site. CC coiled-coil domain, UTR untranslated region, ATG methionine start codon
Fig. 2
Fig. 2
Transforming activity and oncogenic signaling of RET alterations. a MCF10A (human breast epithelial) and NIH/3T3 (immortalized mouse fibroblasts) cells overexpressing RET wild-type (RETamp), NCOA4-RET, and ΔRET. Expressed proteins were detected using a C-terminal RET antibody at predicted sizes of 155/175, 68, and 46 kDa respectively. NIH/3T3 cells transduced with RETamp, NCOA4-RET, and ΔRET show increased b growth rates and c clonal expansion compared to cells transduced with vector alone. For growth curve experiments, 20,000 cells were plated per dish in triplicate for all cell lines and counted at days 4, 6, and 8. For clonogenic studies, 150 cells were plated per well in triplicate for all cell lines and stained with crystal violet at the end of 14 days. d Immunoblot analysis of NIH/3T3 cells overexpressing RETamp, ΔRET, and NCOA4-RET reveal phosphorylation at tyrosine 905 and e downstream signaling measured after serum starvation for 24 h. In (d) and (e), kinase inactive mutant (K758M) and constitutively active mutant (M918T) refer to full-length RET variants used as negative and positive controls respectively. Results shown are representative of experiments performed thrice and error bars indicate s.d. (n = 3). p ≤ 0.05 (*), ≤0.01 (**), ≤0.001 (***) are statistically significant and analyzed by ANOVA and Tukey’s multiple comparisons test. Open-ended brackets depict comparison between the indicated group(s) and each of the groups under the bracket. Where brackets are absent, comparison is with empty vector
Fig. 3
Fig. 3
Fusion cell lines exhibit dose-dependent response to RET inhibition. a Dose−response curves after 72 h of drug treatment with cabozantinib or sorafenib in NIH/3T3 cells expressing RETamp, ΔRET, NCOA4-RET, and vector. Cell viability normalized to vehicle (DMSO)-treated cells. Error bars indicate s.d. of three replicates and are representative of three independent experiments (n = 3). b Western blot indicating inhibition of RET fusion kinase, MEK and P70 S6 signaling with increasing concentration of cabozantinib in NIH/3T3 cells transiently expressing NCOA4-RET or ΔRET. Measurements were made after overnight serum starvation and 1 h of incubation with cabozantinib in the absence of serum. Graphs represent image densitometry analysis of western blots from three independent experiments (n = 3). Ratio of phosphorylated to total proteins is measured at each concentration and mean values with error bars indicating s.d. are plotted relative to DMSO-treated control. c Dose-dependent reduction in ΔRET and NCOA4-RET colony numbers upon treatment with increasing concentrations of cabozantinib in NIH/3T3 transduced cells for 14 days. 0 represents DMSO-treated controls. All cells were plated at equal numbers per well in triplicates per experiment. Error bars indicate s.d. of three replicate measurements per condition (n = 3) and are representative of experiments performed three times. p ≤ 0.05 (*), ≤0.01 (**) and ≤0.001 (***) by ANOVA (one-way for (b) and two-way for (c)) with Tukey’s multiple comparisons test. Open-ended brackets depict comparison between the indicated group and each of the groups under the bracket. Where brackets are absent, comparison is with DMSO control
Fig. 4
Fig. 4
ΔRET and NCOA4-RET are tumorigenic. Growth curve of tumors formed upon subcutaneous injection of transduced NIH/3T3 cells at a 1×10⁶ cells, bilateral flank injections in athymic, nude mice (n = 4 injection sites for vector, ΔRET, and RETamp and n = 6 injection sites for NCOA4-RET) and b >4.5×10⁶ cells, bilateral flank injections in NOD/SCID/ interleukin 2 receptor γ null mice (n = 4 injection sites per group) for vector and RETamp cells. Error bars represent mean ± s.d. c Representative staining for hematoxylin and eosin (H&E) demonstrates a packed population of tumor cells (top row, ×5 magnification). At higher power (middle row, ×10 magnification) tumor cells reveal mitoses. Tumor cells stain positive after immunohistochemistry for proliferation marker Ki-67 (bottom row, ×10 magnification). d Immunoblot of tumor protein lysates from NIH/3T3 xenografts using the C-terminal RET antibody and downstream signaling proteins
Fig. 5
Fig. 5
Cabozantinib inhibits tumor growth driven by RET fusions. Mean tumor volume was measured in NIH/3T3 xenograft tumors driven by a NCOA4-RET (n = 8 or 6 injection sites per group) or b ΔRET (n = 14 or 12 injection sites per group) under treatment with either cabozantinib at 30 mg kg−1, 60 mg kg−1, or saline vehicle control for 14 days. Treatment started at day 0. Error bars represent mean ± s.d., ***(p ≤ 0.001) represent comparisons between both treatment groups and vehicle-treated controls when depicted above the vehicle curve or between indicated groups and #(p ≤ 0.001) represents comparisons between day 0 and day 14 for the treatment groups (two-way ANOVA with Tukey’s multiple comparison test). Mouse and tumor images are representatives from each treatment group at the end of study after 14 days of treatment. Scale bars indicate 10 mm. c Immunoblot of tumor protein lysates collected at the end of 14 days of treatment to measure changes in NCOA4-RET, ΔRET (detected by V-5 tag antibody, actin as loading control). Mice were treated on the day of tumor harvest for 4 h with saline vehicle or cabozantinib (30 or 60 mg kg−1) and sacrificed. n = 3 xenograft samples per treatment condition. d Representative hematoxylin and eosin (H&E) staining of tumor tissue revealing a high grade sarcomatoid distribution (top row, ×20 magnification) and immunohistochemistry of markers Ki-67, Cleaved Caspase-3 for comparison between vehicle and cabozantinib treatment groups in NCOA4-RET and ΔRET xenograft experiments (middle and bottom row, ×40 magnification)
Fig. 6
Fig. 6
Clinical response to targeted therapy in a patient with RET-fusion+ve breast cancer. a Histology image of stage I ER+/HER2− tumor. Scale bar indicates 100 μm. b Histology of the regional/distant recurrence of ER+/PR−/HER2 3+ tumor from the right axillary tail, ×4 magnification. Genomic profiling on this tissue revealed NCOA4-RET fusion (same as patient 3 in Fig. 1b). c Treatment schematic and timeline showing initiation of cabozantinib (day 0) after progressing on HER2-targeted treatment (pertuzumab, trastuzumab) and anastrazole. Targeted genomic profiling identified the presence of NCOA4-RET fusion. Based on the finding, cabozantinib, a RET inhibitor, was added along with trastuzumab and exemestane as second-line treatment. Intermittent treatment and dose reduction was required due to side effects. Clinical and radiographic response was observed 85 days after cabozantinib initiation. d Representative PET (top row) and CT (bottom row) images of thoracic spine lesion (filled red arrows) before and after cabozantinib treatment. PET signal avidity is reduced after treatment

References

    1. Agrawal N, et al. Integrated genomic characterization of papillary thyroid carcinoma. Cell. 2014;159:676–690. doi: 10.1016/j.cell.2014.09.050. - DOI - PMC - PubMed
    1. Wang R, et al. RET fusions define a unique molecular and clinicopathologic subtype of non-small-cell lung cancer. J. Clin. Oncol. 2012;30:4352–4359. doi: 10.1200/JCO.2012.44.1477. - DOI - PubMed
    1. Mulligan LM. RET revisited: expanding the oncogenic portfolio. Nat. Rev. Cancer. 2014;14:173–186. doi: 10.1038/nrc3680. - DOI - PubMed
    1. Richardson DS, Gujral TS, Peng S, Asa SL, Mulligan LM. Transcript level modulates the inherent oncogenicity of RET/PTC oncoproteins. Cancer Res. 2009;69:4861–4869. doi: 10.1158/0008-5472.CAN-08-4425. - DOI - PubMed
    1. Drilon A, et al. Cabozantinib in patients with advanced RET-rearranged non-small-cell lung cancer: an open-label, single-centre, phase 2, single-arm trial. Lancet Oncol. 2016;17:1653–1660. doi: 10.1016/S1470-2045(16)30562-9. - DOI - PMC - PubMed

Publication types

MeSH terms