. 2018 Nov 16;9(1):4834.
doi: 10.1038/s41467-018-07394-5.

NUAK2 is a critical YAP target in liver cancer

Affiliations

NUAK2 is a critical YAP target in liver cancer

Wei-Chien Yuan et al. Nat Commun. .

Abstract

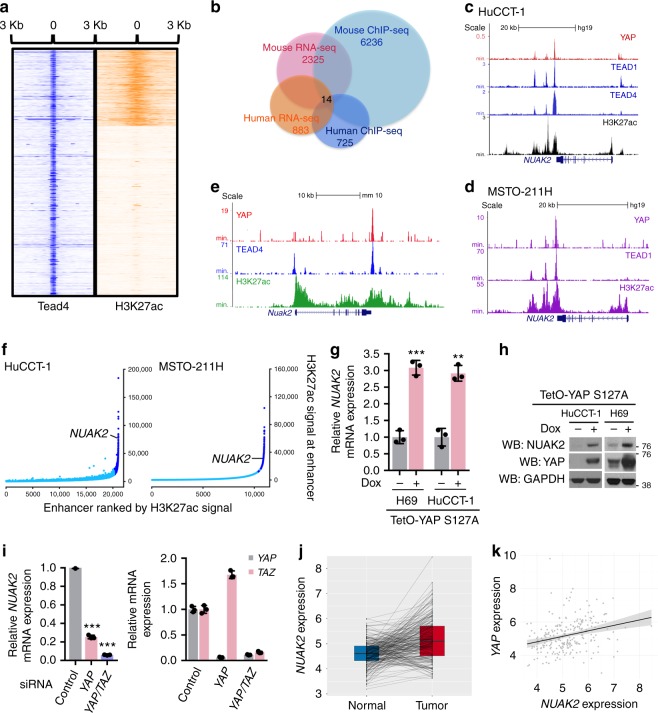
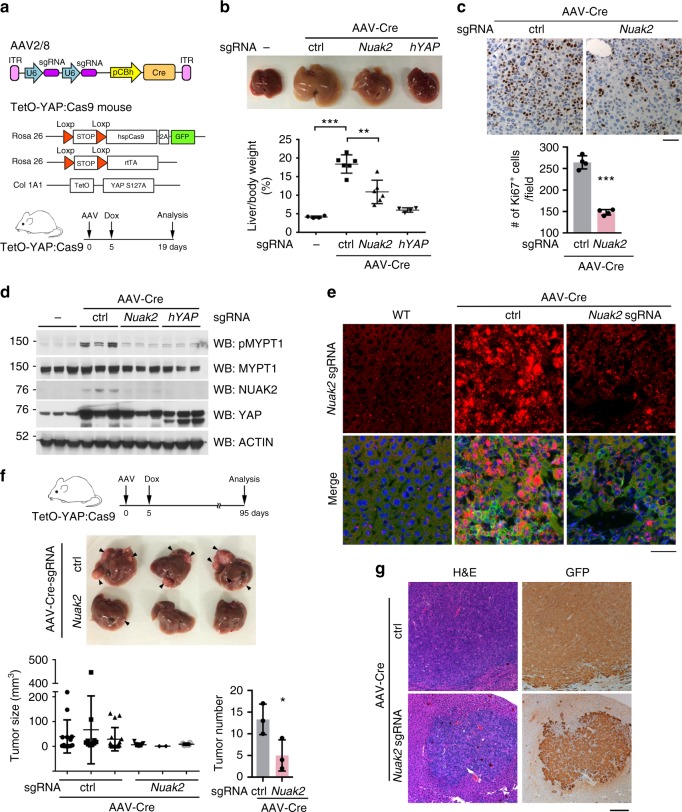
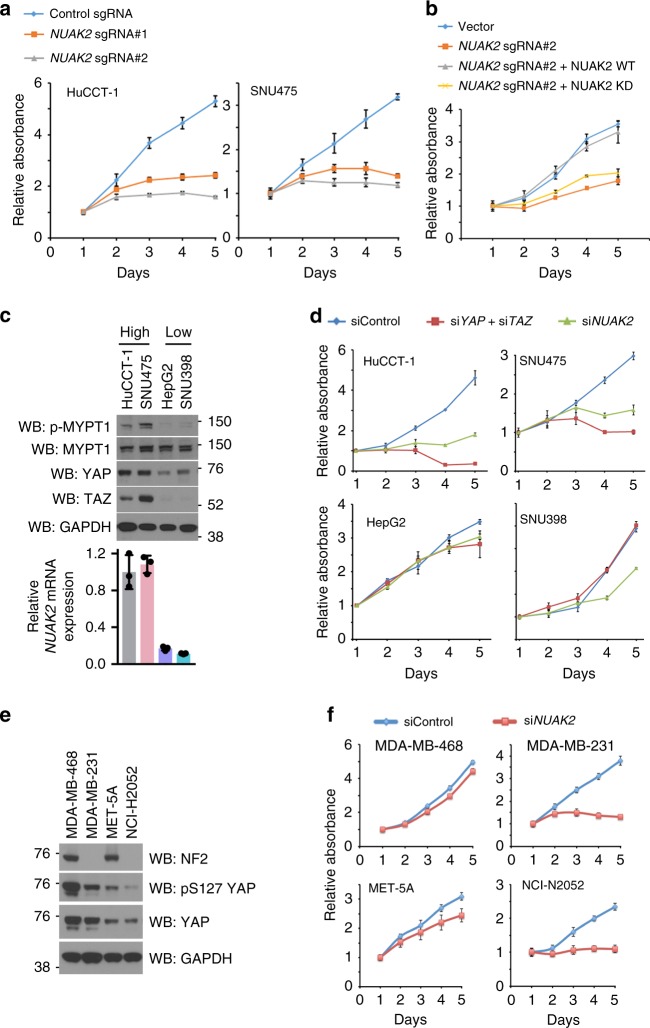
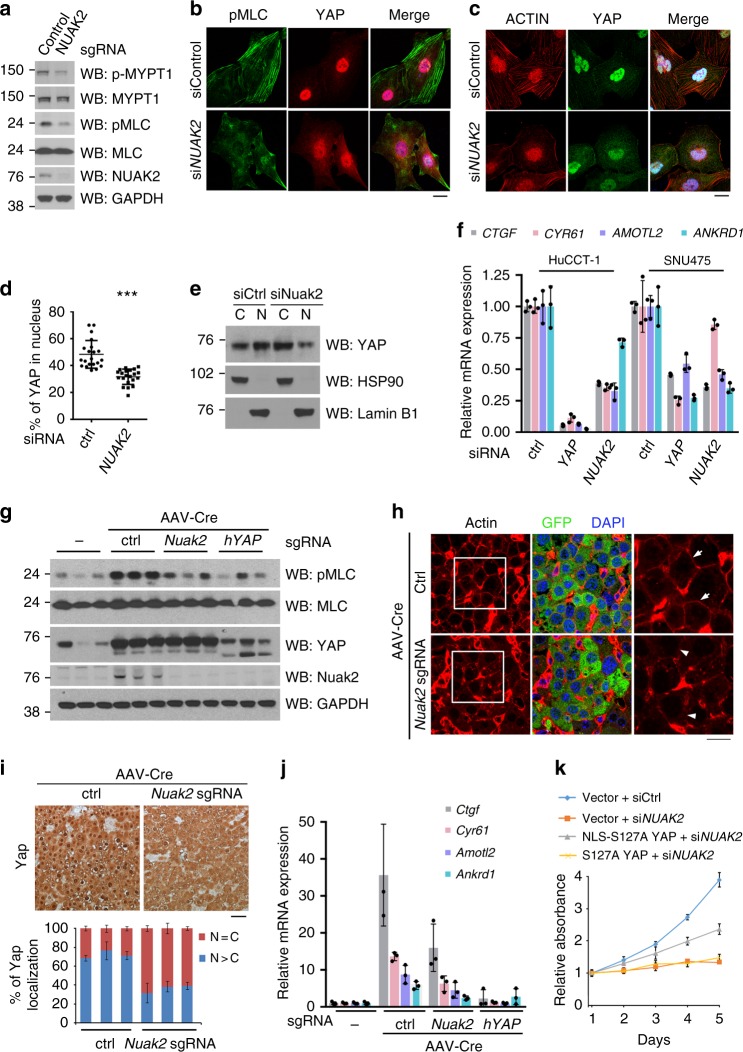
The Hippo-YAP signaling pathway is a critical regulator of proliferation, apoptosis, and cell fate. The main downstream effector of this pathway, YAP, has been shown to be misregulated in human cancer and has emerged as an attractive target for therapeutics. A significant insufficiency in our understanding of the pathway is the identity of transcriptional targets of YAP that drive its potent growth phenotypes. Here, using liver cancer as a model, we identify NUAK2 as an essential mediator of YAP-driven hepatomegaly and tumorigenesis in vivo. By evaluating several human cancer cell lines we determine that NUAK2 is selectively required for YAP-driven growth. Mechanistically, we found that NUAK2 participates in a feedback loop to maximize YAP activity via promotion of actin polymerization and myosin activity. Additionally, pharmacological inactivation of NUAK2 suppresses YAP-dependent cancer cell proliferation and liver overgrowth. Importantly, our work here identifies a specific, potent, and actionable target for YAP-driven malignancies.


Conflict of interest statement

The authors declare no competing interests.

Figures

Fig. 1
Fig. 1
NUAK2 is a direct target of YAP. a Heatmap representing TEAD4/H3K27ac ChIP-seq signal in a window of ±3 Kb from the center of TEAD4 peaks. Clustering results from the K-means method. b Venn diagram displays overlapping genes from 4 different datasets to identify 14 accordant YAP downstream genes. The datasets include: (1) a TEAD4 ChIP-seq from the liver of induced TetO-YAP mice, (2) a YAP ChIP-seq, from human cholangiocellular carcinoma cell line, HuCCT-1, (3) an RNA-seq from HuCCT-1 cells upon YAP/TAZ silencing, and (4) an RNA-seq from the liver of induced TetO-YAP mice. c, d Genomic tracks display ChIP-seq data for the indicated antibodies around the NUAK2 gene in HuCCT-1 (c) and MSTO-211H cells (d). e Genomic tracks display ChIP-seq data for the indicated antibodies around the Nuak2 gene in primary hepatocytes of TetO-YAP S127A mice placed on Dox for 4 days. f Hockey-stick plot representing H3K27ac signal across enhancer regions for all enhancers in HuCCT-1 (left panel) and MSTO221H (right panel) cells. Super enhancers are labeled by dark blue, with the super enhancer of Nuak2 marked. g qPCR analysis of NUAK2 expression in HuCCT-1 and H69 cells stably expressing Dox-inducible YAP-S127A. Data are presented as mean ± SD; n = 3. The two-tailed, Student’s t test was used to compare between two groups and expressed as P values. *P < 0.05, **P < 0.01, ***P < 0.001. h YAP overexpression promotes NUAK2 expression. Dox-inducible HuCCT-1 and H69 cells treated with or without Dox for 24 h were assayed by Western blot for the indicated antibodies. i qPCR analysis of NUAK2 expression in HuCCT-1 cells transfected with indicated siRNA for 72 h (left panel). Right panel showing the knockdown efficiency of YAP and TAZ. Data are presented as mean ± SD; n = 3. The two-tailed, Student’s t test was used to compare between two groups and expressed as P values. *P < 0.05, **P < 0.01, ***P < 0.001. j Expression profiles of NUAK2 and YAP in HCC patient specimens and their adjacent normal specimens. n = 233 pairs, P = 6.84E−15 (paired Wilcoxon test). k Spearman correlation analysis of NUAK2 expression with YAP expression in HCC patient samples. n = 247, Rs = 0.34, P = 3.2E−08
Fig. 2
Fig. 2
NUAK2 plays a critical role in YAP-driven hepatomegaly and tumorigenesis. a Top, schematic of AAVs utilized containing two sgRNAs targeting either Nuak2 or transgenic YAP. Middle, transgenic mice bearing these three alleles were used for CRISPR/Cas9-mediated knockout of Nuak2 in a YAP overexpression model. Bottom, experimental flow chart depicting protocol for YAP-mediated acute liver overgrowth. b Gross morphology of the livers of TetO-YAP:Cas9 transgenic mice infected with indicated AAV virus and placed on Dox for 2 weeks. Liver/body weight ratio of mice mentioned before was plotted. Data are presented as mean ± SD; n = 4 or 6. The two-tailed, Student’s t test was used to compare between two groups and expressed as P values. *P < 0.05, **P < 0.01, ***P < 0.001. c Representative Ki67 staining of liver sections as in (b) and quantification of Ki67 positive cells were shown. Data are presented as mean ± SD; n = 4 mice per group, 5 or 6 high power field (HPF) per animal. The two-tailed, Student’s t test was used to compare between two groups and expressed as P values. *P < 0.05, **P < 0.01, ***P < 0.001. Bar, 25 μm. d Western blot analysis from livers of TetO-YAP:Cas9 mice as indicated. MYPT1 is a target of NUAK2 and it is used as a surrogate for its activity. Each lane represents a different mouse liver. e The designated liver tissue sections were analyzed by RNAscope for Nuak2 (red) and co-stained with anti-GFP antibody (green) and DAPI (blue). Bar, 50 μm. f Experimental flow chart depicting protocol for long-term YAP-driven tumorigenesis. Gross morphology of livers in TetO-YAP:Cas9 transgenic mice infected with indicated AAVs. Arrowheads indicate visible tumor nodules. Bottom, size and number of tumors are indicated per histological analysis. Data are presented as mean ± SD; n = 3 animals. The two-tailed, Student’s t test was used to compare between two groups and expressed as P values. *P < 0.05, **P < 0.01, ***P < 0.001. g Hematoxylin and eosin (H&E) and IHC analysis of liver tumor sections as in (f). Bar, 100 μm
Fig. 3
Fig. 3
NUAK2-dependency in YAP-driven cancer lines. a Growth curves of HuCCT-1 and SNU475 cells transfected with either scrambled (ctrl) or NUAK2 sgRNAs using crystal violet assessment of cell growth. Data are presented as mean ± SD; n = 6. b Growth curves of HuCCT-1 cells transfected with scramble or NUAK2 sgRNA and/or vectors expressing cDNAs encoding wild-type or kinase-dead NUAK2 with a mutated PAM sequence, thus the construct DNA would not be targeted by Cas9. Data are presented as mean ± SD; n = 5. The expression of NUAK2 is shown in Supplementary Fig. 3c. c Western blot and qPCR analysis depicting levels of phospho-S445 MYPT1, MYPT1, YAP, TAZ, and NUAK2 in various human liver cancer cell lines. d Cell growth curves of liver cancer cell lines following transfection with siRNAs against YAP/TAZ, NUAK2 or control sequence. Data are presented as mean ± SD; n = 4. The knockdown efficiency of YAP, TAZ, and NUAK2 is shown in Supplementary Fig. 3f–h. e Western blot analysis depicting levels of NF2, YAP, and phospho-S127 YAP in indicated human cancer cell lines. f Cell growth curves of indicated cancer cell lines following transfection with siRNAs against NUAK2 or control sequence. Data are presented as mean ± SD; n = 6. The knockdown efficiency of NUAK2 is shown in Supplementary Fig. 3i
Fig. 4
Fig. 4
NUAK2 regulates YAP localization and activity via the actomyosin skeleton. a Western blot analysis of phospho-S445 MYPT1, MYPT1, NUAK2, phospho-MLC, and MLC in SNU475 cells transfected with indicated siRNAs. b, c Confocal analysis of SNU475 cells expressing indicated siRNAs and stained with DAPI and indicated antibodies. Bar, 20 μm. d The percentage of YAP localized in the nucleus was quantified in SNU475 shown in (c). Data are presented as mean ± SD; n = 21 HPF. The two-tailed, Student’s t test was used to compare between two groups and expressed as P values. *P < 0.05, **P < 0.01, ***P < 0.001. e Cytosolic and nuclear fractions isolated from HuCCT-1 cells transfected with indicated siRNA were analyzed by Western blot. HSP90 serves as cytosolic marker, and Lamin B1 as nuclear marker. f qPCR analysis of YAP downstream genes in HuCCT-1 and SNU475 cells transfected with indicated siRNA. n = 3, mean ± SD. The knockdown efficiency of YAP and NUAK2 are shown in Supplementary Figure 4a. g TetO-YAP:Cas9 mice were infected with high-dose (5 × 1010 GC/mouse) AAV-Cre with the indicated sgRNA and administered Dox for 4 days. A piece of liver from three independent mice was analyzed by Western blot analysis. Each lane represents a different mouse liver. h The liver sections as in (g) were stained with anti-actin (red), anti-GFP (green) antibody, and DAPI. Arrows indicate the junctional actin; arrowheads point to the impaired actin bundles. Bar, 20 μm. i IHC analysis for YAP and relative quantification YAP localization. n = 3, mean ± SD. Bar, 20 μm j qPCR analysis of YAP downstream genes in TetO-YAP:Cas9 mice livers in g. n = 3 mice, mean ± SD. k Growth curves of HuCCT-1 cells stably expressing Dox-inducible YAP mutants transfected with scramble or NUAK2 siRNA. Data are presented as mean ± SD; n = 8
Fig. 5
Fig. 5
HTH-02-006 attenuates YAP-driven cell proliferation, hepatomegaly and tumorigenesis. a Chemical structures and IC50 of HTH-02-006. b In the presence of 100 μM [γ-32P]ATP, NUAK2 activity was analyzed using 200 μM Sakamototide with the indicated concentrations of HTH-02-006. The results are presented as the percentage of kinase activity relative to the DMSO-treated control. Results are mean ± S.D. n = 2. c Western blot analysis of phospho-S445 MYPT1, MYPT1, phospho-MLC, and MLC in SNU475 cells treated with HTH-02-006. d Cell growth curves of indicated liver cancer cell lines. Cells were treated with increasing concentrations of HTH-02-006 for 120 h. Data are presented as mean ± SD; n = 3. e Western blot analysis of indicated antibodies in wild-type and A236T mutant cells treated with/without HTH-02-006. f Growth curves of HuCCT-1 wild-type and A236T mutant cells treated with increasing concentrations of HTH-02-006 for 120 h. Data are presented as mean ± SD; n = 3. g TetO-YAP S127A mice infected with AAV-Cre were fed Dox for 14 days. Data are presented as mean ± SD; n = 7 animals per group. HTH-02-006 was administered by intraperitoneal injection twice a day during the 14 days period. Gross morphology of the liver in TetO-YAP S127A mice treated with HTH-02-006. Liver/body weight ratio of TetO-YAP S127A mice at the end of period is shown. Ki67 staining of liver sections and quantification of Ki67 positive cells are shown. Data are presented as mean ± SD; n = 3, 5 HPF per mouse. The two-tailed, Student’s t test was used to compare between two groups and expressed as P values. *P < 0.05, **P < 0.01, ***P < 0.001. h Immunoblotting of liver lysates from TetO-YAP S127A mice treated for 14 days with vehicle or HTH-02-006. Three independent samples from each treatment were used. Each lane represents a different mouse liver. i Tumor growth of HuCCT-1 TetO-YAP S127A cells in a xenograft model. Nude mice were fed with or without Dox. HTH-02-006 (10 mg/kg) was administered by intraperitoneal injection twice a day. Data are presented as mean ± SD; n = 4 animals per group

Similar articles

Cited by

References

    1. Camargo FD, et al. YAP1 increases organ size and expands undifferentiated progenitor cells. Curr. Biol. 2007;17:2054–2060. doi: 10.1016/j.cub.2007.10.039. - DOI - PubMed
    1. Zhou D, et al. Mst1 and Mst2 maintain hepatocyte quiescence and suppress hepatocellular carcinoma development through inactivation of the Yap1 oncogene. Cancer Cell. 2009;16:425–438. doi: 10.1016/j.ccr.2009.09.026. - DOI - PMC - PubMed
    1. Benhamouche S, et al. Nf2/Merlin controls progenitor homeostasis and tumorigenesis in the liver. Genes Dev. 2010;24:1718–1730. doi: 10.1101/gad.1938710. - DOI - PMC - PubMed
    1. Lu L, et al. Hippo signaling is a potent in vivo growth and tumor suppressor pathway in the mammalian liver. Proc. Natl Acad. Sci. USA. 2010;107:1437–1442. doi: 10.1073/pnas.0911427107. - DOI - PMC - PubMed
    1. Kango-Singh M, Singh A. Regulation of organ size: insights from the Drosophila Hippo signaling pathway. Dev. Dyn. 2009;238:1627–1637. doi: 10.1002/dvdy.21996. - DOI - PubMed

Publication types

MeSH terms