. 2018 Nov 16;9(1):4816.
doi: 10.1038/s41467-018-07286-8.

Optogenetic dissection of Rac1 and Cdc42 gradient shaping

Affiliations

Optogenetic dissection of Rac1 and Cdc42 gradient shaping

S de Beco et al. Nat Commun. .

Abstract

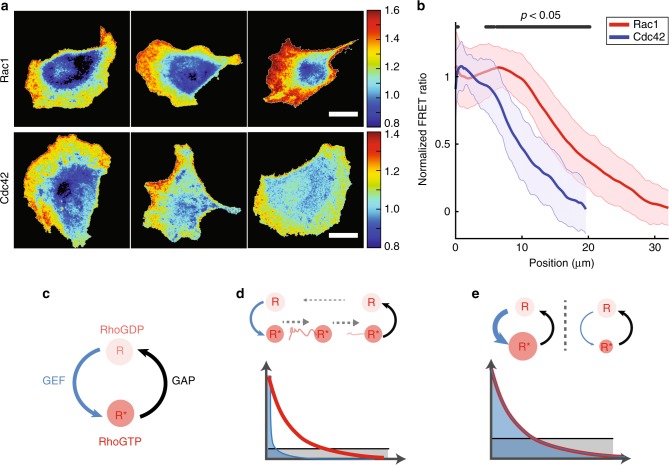
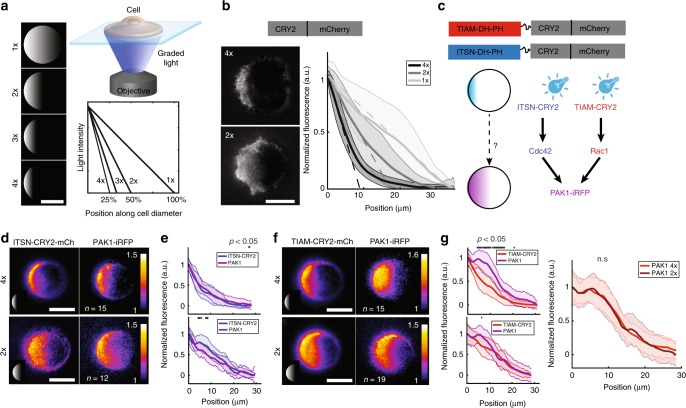
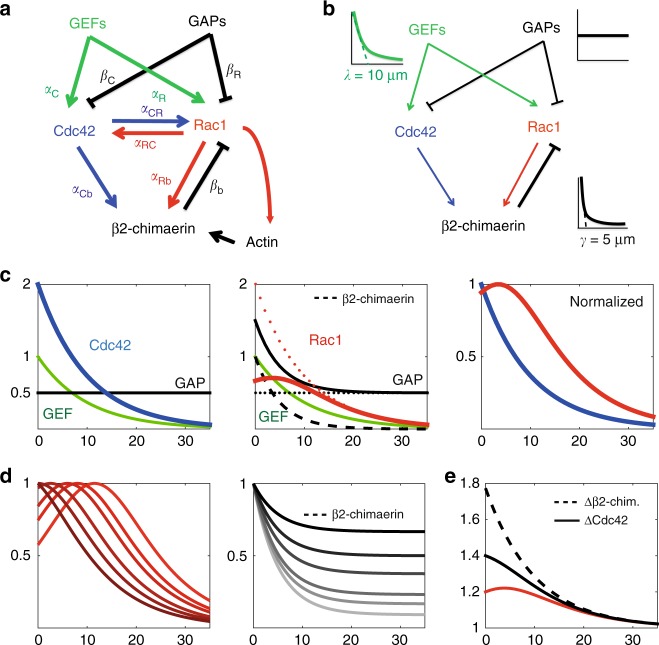
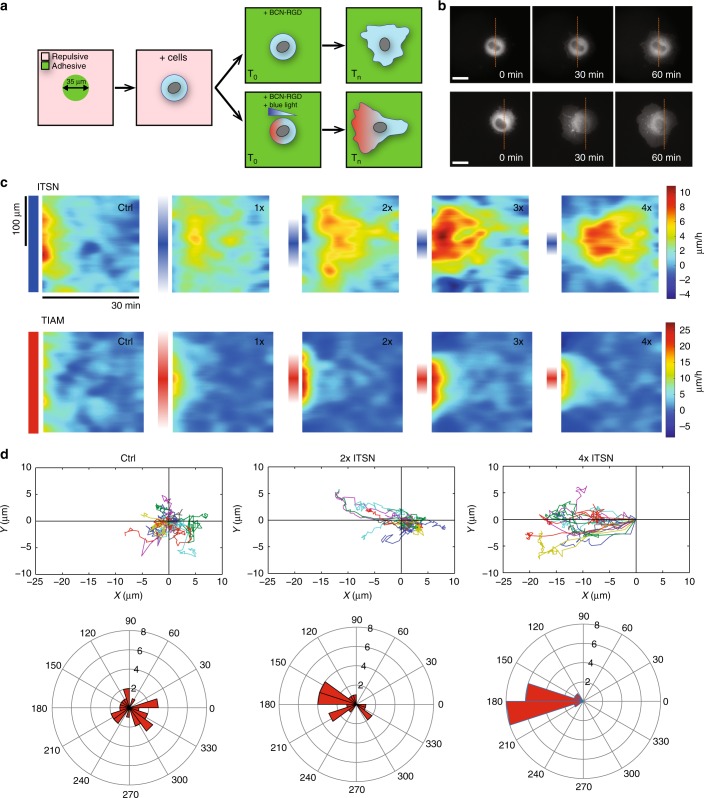
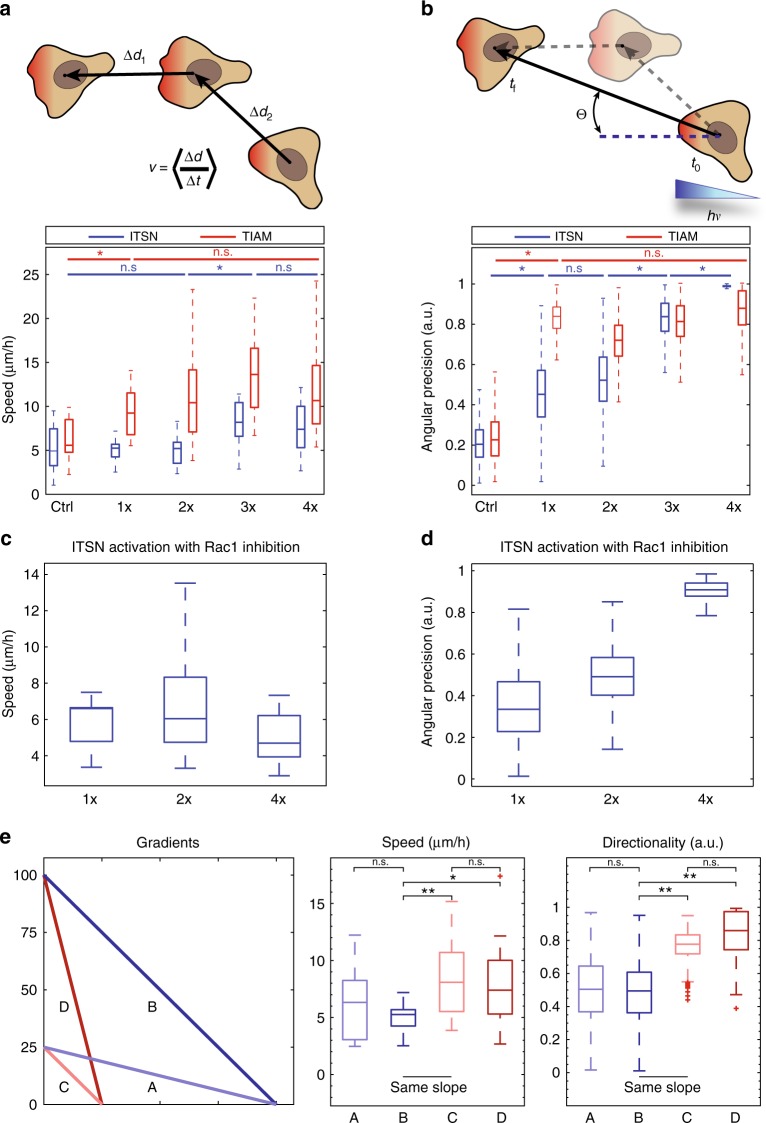
During cell migration, Rho GTPases spontaneously form spatial gradients that define the front and back of cells. At the front, active Cdc42 forms a steep gradient whereas active Rac1 forms a more extended pattern peaking a few microns away. What are the mechanisms shaping these gradients, and what is the functional role of the shape of these gradients? Here we report, using a combination of optogenetics and micropatterning, that Cdc42 and Rac1 gradients are set by spatial patterns of activators and deactivators and not directly by transport mechanisms. Cdc42 simply follows the distribution of Guanine nucleotide Exchange Factors, whereas Rac1 shaping requires the activity of a GTPase-Activating Protein, β2-chimaerin, which is sharply localized at the tip of the cell through feedbacks from Cdc42 and Rac1. Functionally, the spatial extent of Rho GTPases gradients governs cell migration, a sharp Cdc42 gradient maximizes directionality while an extended Rac1 gradient controls the speed.


Conflict of interest statement

The authors declare no competing interests.

Figures

Fig. 1
Fig. 1
Rac1 and Cdc42 activity gradients have different shapes. a FRET biosensors were used to monitor Rac1 (top) or Cdc42 (bottom) activity in freely migrating HeLa cells. GTPase activity is measured by the FRET ratio, and represented with a color scale. Several representative cells are shown. Scale bar: 20 µm. b Mean normalized FRET ratio of Rac1 (red) and Cdc42 (blue) is plotted as a function of the distance from the cell edge. The error bars indicate the standard deviation (s.d.) of n = 31 (Rac1) or n=19 (Cdc42) cells. Black segments at the top show positions at which the curves are statistically different (p < 0.05, Wilcoxon’s rank sum test). c Rho GTPase cycle, where the protein switches between an inactive and active state thanks to activators (GEFs) and deactivators (GAPs). d, e Two simplified mechanisms can explain the formation of cellular-scale Rho GTPase gradients. d A sharply localized GEF (blue profile) acts as a punctual source of active Rho GTPases (red) that are further transported by diffusion or flow (dashed gray arrows) until they reverse to the inactive state thanks to a GAP (black). e A cellular-scale distributed GEF locally activates the Rho GTPase such that both have the same profile
Fig. 2
Fig. 2
Cdc42 and Rac1 have different responses to GEF activation. a We imposed GEF activity gradients of different slopes using optogenetics. Patterned illumination with grayscale levels (left) was shone onto the samples, imposing linear light gradients of the same amplitude but different spatial extents on cells attached on round micropatterns of 35 µm in diameter (top right). The reference gradient called 1× spans over the whole diameter of the cell. The gradient 2× spans over a half cell diameter, and therefore has a slope twice as sharp as for the gradient 1× (bottom right). b Membrane recruitment of the optogenetic partner CRY2-mCherry to the basal side of cells on round micro-patterns following 30 min of illumination with 4× (top left) and 2× (bottom left) gradients. mCherry fluorescence (solid lines) was measured along the cell diameter following illumination with 1× (light gray), 2× (medium gray) and 4× (black) gradients (dashed lines). Error bars indicate the s.d. of n = 15 (1×), n = 24 (2×) and n = 15 (4×) cells. c We activated GEFs of Cdc42 (ITSN) or Rac1 (TIAM) with light gradients and measured the fluorescence pattern of PAK1-iRFP. Schemes at the top represent the fusion proteins used. d PAK1-iRFP recruitment following 4x (top) or 2× (bottom) activation gradients of ITSN. Fluorescence was recorded using TIRFM in HeLa cells on round micro-patterns, and initial fluorescence was subtracted for normalization. Micrographs represent the averaged fluorescence of n = 15 (4×, top) or n = 12 (2×, bottom) cells. Insets show the illumination patterns (not to scale). e Normalized fluorescence of ITSN-CRY2-mCherry (blue) and PAK1-iRFP (purple) was measured along the cell diameter and averaged (solid lines). Error bars: s.d. Gray lines at the top show positions at which the curves are statistically different (p < 0.05, Wilcoxon’s rank sum test). f PAK1-iRFP recruitment following 4× (top, n = 15) or 2× (bottom, n = 19) activation gradients of TIAM. g Normalized fluorescence of TIAM-CRY2-mCherry (red) and PAK1-iRFP (purple) along the cell diameter of n = 15 (4×, top) or n = 19 (2×, bottom) cells, Error bars: s.d. Gray: Wilcoxon’s rank sum test (p < 0.05). Single cell data for e and g are presented in Supplementary Figure 3. Scale bars: 20 µm
Fig. 3
Fig. 3
Cdc42 and β2-chimaerin are involved in shaping the activity gradient of Rac1. a We activated GEFs of Cdc42 (ITSN) or Rac1 (TIAM) with light gradients and measured the fluorescence pattern of Abi1-iRFP. b Averaged Abi1-iRFP recruitment (right column) following 4× activation gradients (left column) of TIAM (n = 10, top) or ITSN (n = 11, bottom) visualized using TIRFM on round micro-patterns. The averaging procedure is explained in the Methods section. Insets show the illumination patterns (not to scale). c Non-normalized Rac1 FRET ratio profiles along cell diameters of cells treated with control siRNA (n = 38, red) or Cdc42-directed siRNA (n = 37, black). Error bars: s.d. Gray lines at the top show positions at which the curves are statistically different (p < 0.05, Wilcoxon’s rank sum test). d, e β2-chimaerin-iRFP (right) recruitment following 4× activation gradients (left) of TIAM (n = 11, top) or ITSN (n = 12, bottom), imaged in TIRFM on round micro-patterns. d Micrographs represent the averaged fluorescence (see Methods). e Normalized fluorescence of β2-chimaerin-iRFP was measured along the cell diameter following the activation of ITSN-CRY2-mCherry (blue, n = 12) or TIAM-CRY2-mCherry (red, n = 11). Error bars: s.d. f Non-normalized Rac1 FRET ratio profiles along cell diameters of cells treated with control siRNA (n = 38, red) or β2-chimaerin-directed siRNA (n = 25, black). Error bars: s.d. Gray: Wilcoxon rank sum test (p < 0.05). g β2-chimaerin staining (left, Gamma correction was applied to images in order to visualize the full dynamics) compared to normalized Rac1 FRET (middle) in the same cells. Insets show zoomed regions of the cell edge. Levels of β2-chimaerin (black) and Rac1 activity (red) are anticorrelated at the cell front (right panel, n = 8, Error bars: s.d). h PAK1-iRFP (purple) recruitment following 4× activation gradients of TIAM (red) after treatment with β2-chimaerin-directed siRNA (n = 14). Curves were found not significantly different on their whole length (Wilcoxon, p > 0.05). i PAK1-iRFP (purple) recruitment following 4× activation gradients of TIAM (red) after treatment with JLY cocktail (n = 23). n.s., nonsignificant. j β2-chimaerin staining after DMSO (left) or JLY cocktail (right) treatment. k Fraction of cell perimeter showing β2-chimaerin signal at the cell edge larger than in the cytosol (DMSO: n = 11, JLY: n = 10). Fluorescence at the cell edge was measured along a 1-μm-thick line obtained from the thresholding-based segmentation of the cell shape. The signal in the cytosol was evaluated from a 1 μm-thick line outlining that cell edge on its cytosolic side. Box plots represent the median, interquartile (box), 1.5 IQR (whiskers), and outliers (red crosses). Statistical significance was evaluated using Wilcoxon’s rank sum test. ***p ≤ 0.001. Scale bars: 20 µm
Fig. 4
Fig. 4
A minimal model for Cdc42 and Rac1 gradient formation. a Full model based on our experimental findings. Activation rates are denoted by α and deactivation rates by β. b A minimal model that recapitulates the formation of Cdc42 and Rac1 gradients. c Gradient shaping of Cdc42 and Rac1. Since the absolute amplitude of Rho GTPases are unknown, we assigned the following arbitrary values to the rates: αC=αR=1; βC=βR=0.5; and βb=1. Left: Cdc42 (blue) is set by an exponentially distributed GEF (green) with a characteristic length λ=10 µm and uniform GAP (black). Middle: Rac1 (red) requires an additional GAP, β2-chimaerin (dashed black, characteristic length γ=5 µm), that is localized more sharply at the cell edge than Rac1 GEF (green). The overall GAP activity (plain black) is the sum of β2-chimaerin and a uniform GAP (dashed black). As a result, the putative Rac1 gradient without β2-chimaerin (dashed red) is chopped off at the cell edge resulting in a bell-shaped gradient (plain red). Right: once normalized to 1, Cdc42 and Rac1 gradients present distributions that are similar to the ones measured in cells. d Effect of the relative ratio r=βR/βb between uniformly distributed GAPs and the localized gradient of β2-chimaerin on the position of the Rac1 bump. Left: Rac1 gradients obtained with decreasing values of r (r = 2, 1, 0.6, 0.3, 0.2, 0.1 respectively from dark to light red). Right: exponentially distributed β2-chimaerin (dashed line) and uniformly distributed GAPs (βR=2, 1, 0.6, 0.3, 0.2, 0.1 from dark to light gray, solid lines) corresponding to the values used for the left plot. e Effects of Cdc42 or β2-chimaerin inhibition in silico on the Rac1 gradient (αCb=0.4, and αRb=0.3). The profiles are normalized (by the same factor) to match the FRET signal values measured experimentally (Fig. 2c, d)
Fig. 5
Fig. 5
Scheme of the quantitative migration assay. a Cells are seeded on 35 µm round patterns. After complete adhesion, the adhesive reagent BCN-RGD is added and binds to the coverslip’s surface, allowing free 2D cell migration (top). Directed migration can be triggered by optogenetic activation of GEFs through light gradients at the same time as cell adhesion is released (bottom). b Examples of cells expressing CIBN-GFP-CAAX and TIAM-CRY2-mCherry with (3× gradient, bottom) or without (top) photo-activation (visualized: TIAM-CRY2-mCherry). Time indicates the duration after addition of BCN-RGD and concomitant blue light illumination. The dashed orange line corresponds to the initial position of the cell center. c, d HeLa cells expressing CIBN-GFP-CAAX and ITSN-CRY2-mCherry or CIBN-GFP-CAAX and TIAM-CRY2-mCherry were illuminated with various gradients of light as the adhesive patterns were released. c Average morphodynamic maps for each condition (ITSN: top, TIAM: bottom). The vertical axis corresponds to the coordinate along the cell contour (centered on the direction of the light gradient) and the horizontal axis corresponds to time. The local velocity of the edge of the cell membrane is color coded accordingly to the bar on the right side. Gradient extents are schemed on the left side of each map. ITSN: n=25 (control with uniform illumination), n=16 (1× gradient), n=20 (2×), n = 19 (3×) or n = 16 (4×). TIAM: n = 19 (ctrl), n = 18 (1×), n = 18 (2×), n = 17 (3×), n = 18 (4×). d We tracked the position of the centroid of individual cells. Top: Trajectories of cells stimulated with various gradients of ITSN. Bottom: The angles between the displacement vector (initial to final centroid position) and the stimulation axis for each cell are represented in polar coordinates. Scale bars: 20 µm
Fig. 6
Fig. 6
Cdc42 and Rac1 drive different cellular responses. a, b Trajectories of cells stimulated as represented in Fig. 5 were analyzed quantitatively. a Cell speed defined as the instantaneous velocity of the cell displacement averaged over five consecutive time frames (top scheme). Box plots show instantaneous velocity of cells expressing CIBN-GFP-CAAX together with ITSN-CRY2-mCherry (blue) or TIAM-CRY2-mCherry (red) stimulated with various gradients of light (ITSN: n = 25 (ctrl), n = 16 (1×), n = 20 (2×), n = 19 (3×), n = 16 (4×), TIAM: n = 19 (ctrl), n = 18 (1×), n = 18 (2×), n = 17 (3×), n = 18 (4×)). Box plots represent the median, interquartile (box), 1.5 IQR (whiskers). b Directionality defined as the angular precision of cell displacement: the angle of displacement was measured using the initial position averaged over the first three frames and the final position averaged over the last three frames (top scheme). Angles were then bootstrapped and angular precision was calculated with the formula r=(1n*i=1n sinθi)2+(1n*i=1n cosθi)2. Box plots represent the median, interquartile (box), 1.5 IQR (whiskers). Statistical significance between consecutive conditions was evaluated using Wilcoxon’s rank sum test. *p ≤ 0.05. n.s., nonsignificant (p > 0.05). c Speed and d directionality measurements on HeLa cells expressing CIBN-GFP-CAAX and ITSN-CRY2-mCherry after Rac1 inhibition with 100 µM NSC 23766 and stimulated with various Cdc42 gradients. n = 8 (1×), n = 16 (2×) or n = 17 (4×). e Effects of slope, amplitude, and spatial extent of Cdc42 gradients on cell velocity and angular precision. HeLa cells expressing CIBN-GFP-CAAX and ITSN-CRY2-mCherry were stimulated with varying gradients of light. Gradients in blue (a, b) and red (c, d) have two distinct spatial extents. Gradients in light (a, c) and dark (b, d) color have two distinct amplitudes. Two gradients (b, c) have the same slope. n = 13 (a), n = 16 (b), n = 22 (c), n = 16 (d). *p ≤ 0.05, **p ≤ 0.01, n.s., nonsignificant (p > 0.05) (Wilcoxon rank sum test)

References

    1. Van Haastert PJM, Devreotes PN. Chemotaxis: signalling the way forward. Nat. Rev. Mol. Cell Biol. 2004;5:626–634. doi: 10.1038/nrm1435. - DOI - PubMed
    1. Weiner OD, et al. Hem-1 complexes are essential for Rac activation, actin polymerization, and myosin regulation during neutrophil chemotaxis. PLoS Biol. 2006;4:186–199. doi: 10.1371/journal.pbio.0040038. - DOI - PMC - PubMed
    1. Bray D. Axonal growth in response to experimentally applied mechanical tension. Dev. Biol. 1984;102:379–389. doi: 10.1016/0012-1606(84)90202-1. - DOI - PubMed
    1. Choquet D, Felsenfeld DP, Sheetz MP. Extracellular matrix rigidity causes strengthening of integrin–cytoskeleton linkages. Cell. 1997;88:39–48. doi: 10.1016/S0092-8674(00)81856-5. - DOI - PubMed
    1. Pelham RJ, Wang YL. Cell locomotion and focal adhesions are regulated by the mechanical properties of the substrate. Biol. Bull. 1998;194:348–350. doi: 10.2307/1543109. - DOI - PubMed

Publication types

MeSH terms