. 2018 Nov 16;9(1):4817.
doi: 10.1038/s41467-018-07248-0.

Non-obstructive intracellular nanolasers

Affiliations

Non-obstructive intracellular nanolasers

Alasdair H Fikouras et al. Nat Commun. .

Abstract

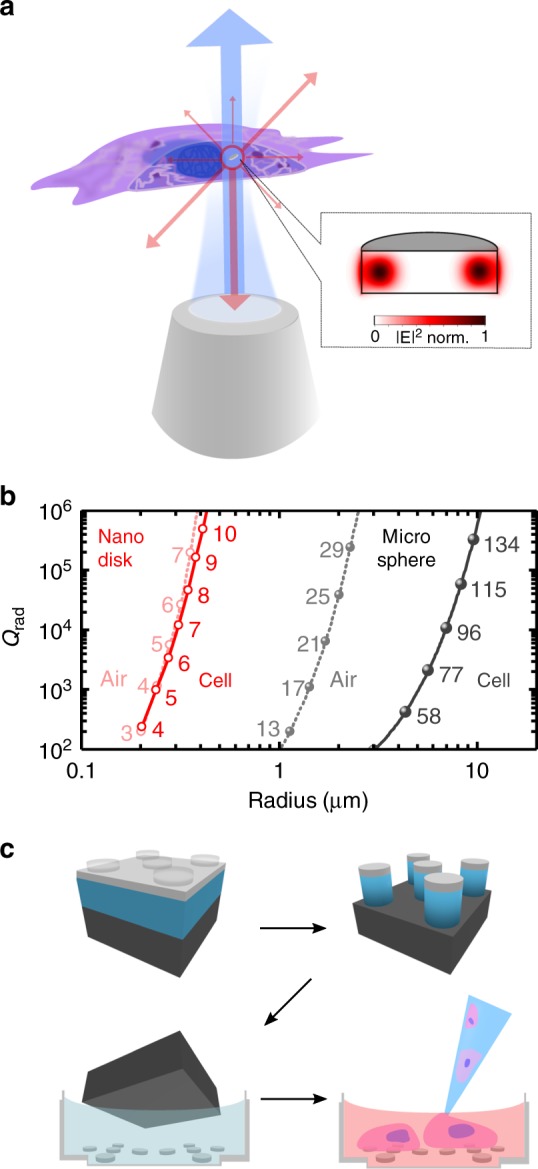
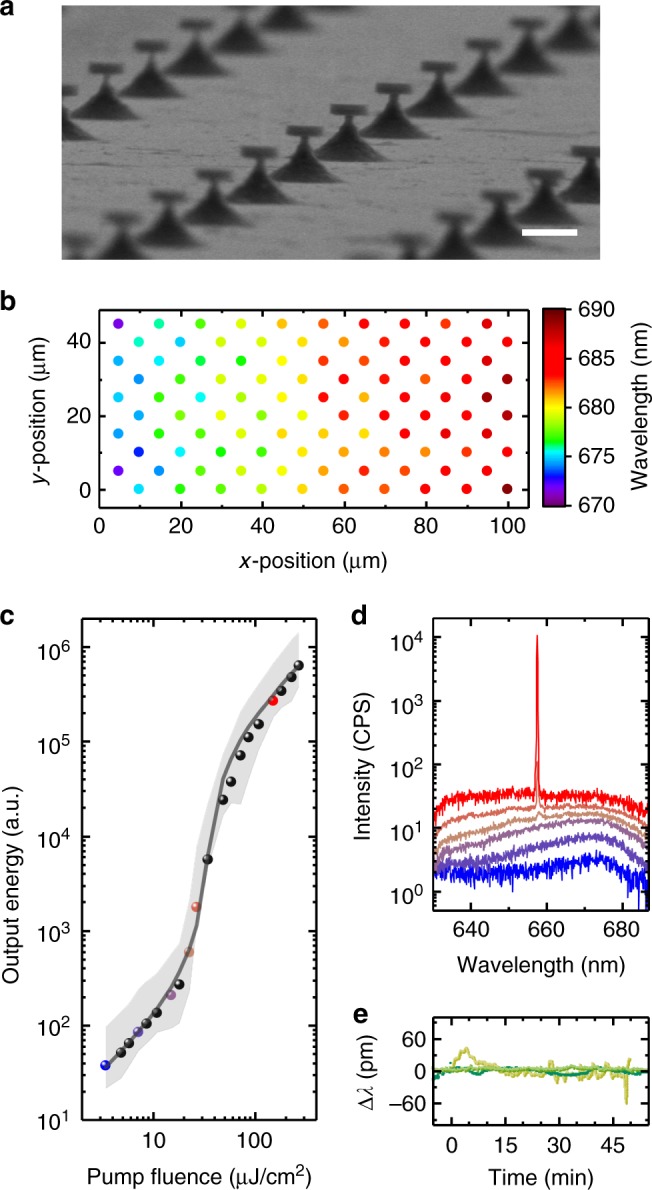
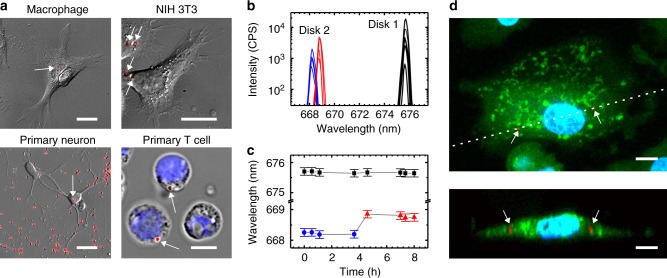
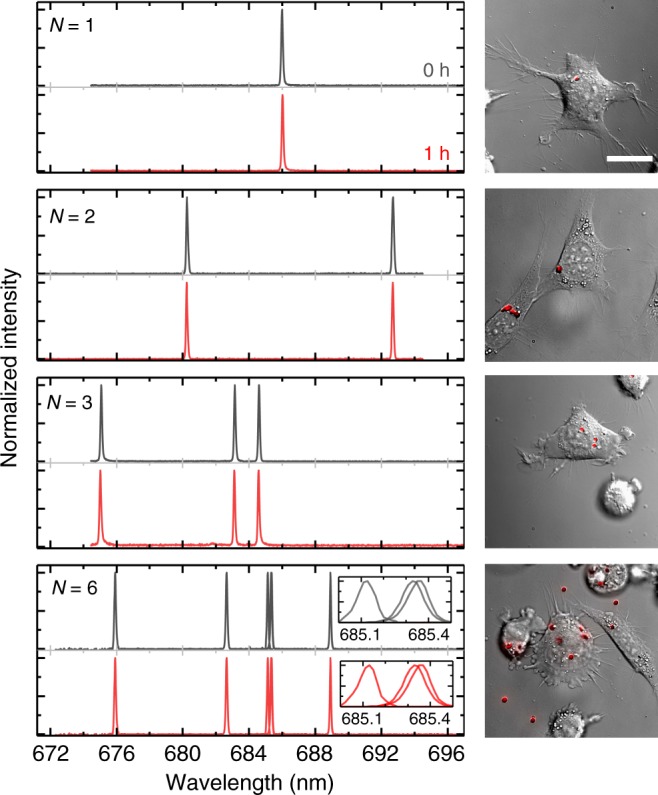
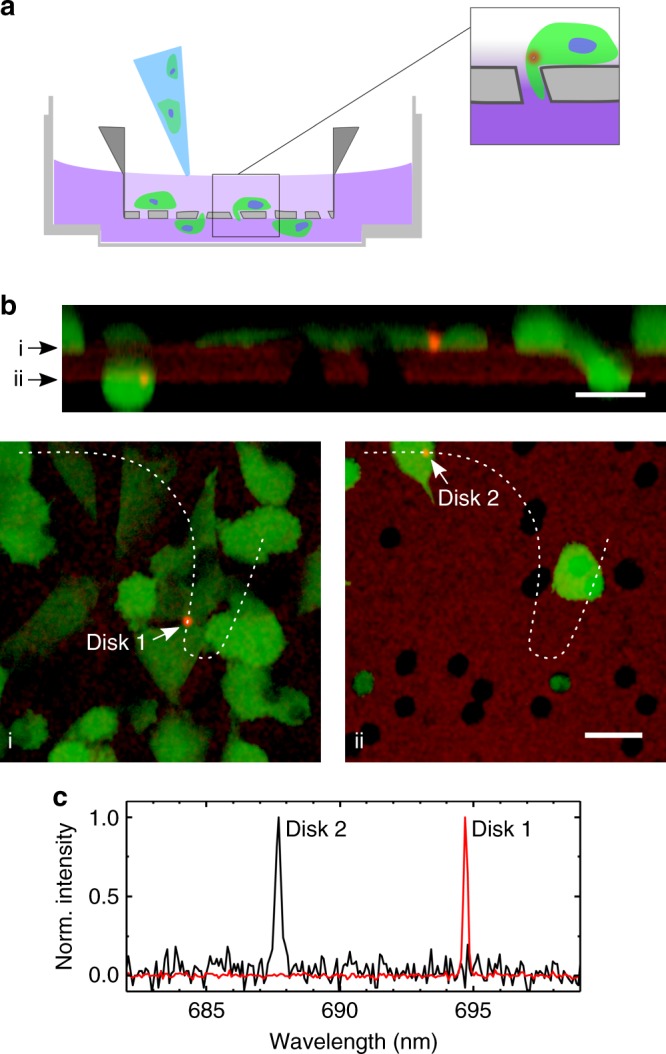
Molecular dyes, plasmonic nanoparticles and colloidal quantum dots are widely used in biomedical optics. Their operation is usually governed by spontaneous processes, which results in broad spectral features and limited signal-to-noise ratio, thus restricting opportunities for spectral multiplexing and sensing. Lasers provide the ultimate spectral definition and background suppression, and their integration with cells has recently been demonstrated. However, laser size and threshold remain problematic. Here, we report on the design, high-throughput fabrication and intracellular integration of semiconductor nanodisk lasers. By exploiting the large optical gain and high refractive index of GaInP/AlGaInP quantum wells, we obtain lasers with volumes 1000-fold smaller than the eukaryotic nucleus (Vlaser < 0.1 µm3), lasing thresholds 500-fold below the pulse energies typically used in two-photon microscopy (Eth ≈ 0.13 pJ), and excellent spectral stability (<50 pm wavelength shift). Multiplexed labeling with these lasers allows cell-tracking through micro-pores, thus providing a powerful tool to study cell migration and cancer invasion.


Conflict of interest statement

The authors declare no competing interests.

Figures

Fig. 1
Fig. 1
Concept and modeling of intracellular nanodisk lasers. a Illustration of a semiconductor nanodisk laser internalized into a cell. The disk is optically pumped through a microscope objective (blue) with laser emission (red) collected by the same objective. Insert shows the calculated profile of the lowest radial order transverse electric (TE) mode for a 750 nm diameter disk made of a GaInP/AlGaInP quantum-well structure. b Finite element modeling of the radiative Q-factor of lowest radial order TE modes in whispering gallery mode micro-resonators with different radii. Comparison between GaInP/AlGaInP nanodisks and polystyrene microspheres, both placed either in air or within a cell. Numbers next to each symbol indicate the angular quantum number of the corresponding mode; the vacuum wavelength for all modes was kept fixed at 680 nm. Lines are guides to the eye. c Schematic illustration of the nanolithography based fabrication of nanodisk lasers, the under-etch process for transfer into cell nutrient medium, and the subsequent culture of cells for disk internalization
Fig. 2
Fig. 2
Nanodisk laser characterization. a Scanning electron microscopy image of an array of as fabricated nanodisks on struts. Scale bar, 1 µm. b Color map illustrating the lasing wavelengths for a region of 100 nanodisks on the sample from (a), showing an increase in wavelength with increasing disk diameter. c Log-log plot of light intensity emitted by detached nanodisk lasers in cell medium as a function of pump intensity. Average threshold curve for N = 10 nanodisks (symbols), min/max output energy band of same disks (gray band) and fit to the average with rate-equation model (gray line). d Emission spectra for a representative nanodisk at pump fluences corresponding with the colored symbols in (c). e, Spectral stability of lasing peak for three typical detached nanodisks in cell medium under continuous excitation at 100 Hz; intensity of pump pulses, 100 µJ cm−2
Fig. 3
Fig. 3
Cellular uptake and lasing from semiconductor nanodisks. a Differential interference contrast (DIC) microscopy of primary human macrophage, NIH 3T3s, primary mouse neurons and primary human T cells with internalized nanodisks (overlaid red fluorescence, indicated by white arrows). Nucleus of T cells labeled by blue Hoechst dye. b Laser spectra collected over period of 8 h for nanodisk inside a macrophage (Disk 1, black) and of a second disk that is internalized by the same cell during the experiment (Disk 2; blue before uptake, red after uptake). c Peak wavelength for spectra in (b) over time. Error bars indicate FWHM of spectra. d Laser scanning confocal fluorescence microscopy image of fixed macrophage with nanodisks (red fluorescence, indicated by white arrows), nucleus in blue (Hoechst), and cytosol in green (Calcein-AM). Maximum intensity projection (top) and vertical cross-section along the dotted line in the top panel. All scale bars, 20 µm; except for primary T cell, 5 µm
Fig. 4
Fig. 4
Demonstration of optical barcoding of cells with multiple nanodisk lasers. Emission spectrum from NIH 3T3 cells with N = 1, 2, 3, and 6 internalized nanodisk lasers, comparing spectra at the beginning of the experiment and after 1 h (left). DIC microscopy images of the same cells with overlaid red fluorescence from nanodisks (right). Inset for N = 6 shows spectra collected for individual excitation of three lasers with similar emission spectra. Scale bar, 20 µm
Fig. 5
Fig. 5
Migration of cells with nanodisk lasers through a microporous membrane. a Schematic cross-section of transwell migration assay, with cell culture dish, membrane insert and disk-containing cells that are seeded into the low-nutrient medium on the top side of the membrane before migrating through pores in membrane towards nutrient-rich medium on the lower side. b Live cell laser scanning confocal microscopy of membrane insert (weak red auto-fluorescence) with eGFP labeled NIH 3T3 cells (green) and nanodisk lasers (bright red). Arrows in top panel indicate the xy-slices shown in the bottom panels; dashed lines in bottom panels indicate the path of the cross-section in the top panel. Images use a logarithmic color scale to visualize weak membrane fluorescence and bright disk fluorescence simultaneously. Scale bars, 20 µm. c Lasing spectra of Disks 1 and 2 in (b), recorded in parallel with confocal microscopy

Comment in

  • Tiny intracellular lasers.
    Strack R. Strack R. Nat Methods. 2019 Feb;16(2):144. doi: 10.1038/s41592-019-0322-1. Nat Methods. 2019. PMID: 30700895 No abstract available.

References

    1. Aioub M, El-Sayed MA. A real-time surface enhanced raman spectroscopy study of plasmonic photothermal cell death using targeted gold nanoparticles. J. Am. Chem. Soc. 2016;138:1258–1264. doi: 10.1021/jacs.5b10997. - DOI - PubMed
    1. Köker T, et al. Cellular imaging by targeted assembly of hot-spot SERS and photoacoustic nanoprobes using split-fluorescent protein scaffolds. Nat. Commun. 2018;9:607. doi: 10.1038/s41467-018-03046-w. - DOI - PMC - PubMed
    1. Levy ES, et al. Energy-looping nanoparticles: harnessing excited-state absorption for deep-tissue imaging. ACS Nano. 2016;10:8423–8433. doi: 10.1021/acsnano.6b03288. - DOI - PubMed
    1. Zhao T, et al. A transistor-like pH nanoprobe for tumour detection and image-guided surgery. Nat. Biomed. Eng. 2016;1:0006. doi: 10.1038/s41551-016-0006. - DOI - PMC - PubMed
    1. Shambat G, et al. Single-cell photonic nanocavity probes. Nano. Lett. 2013;13:4999–5005. doi: 10.1021/nl304602d. - DOI - PMC - PubMed

Publication types