. 2018 Nov 16;9(1):4824.
doi: 10.1038/s41467-018-07287-7.

Serotonin signals through a gut-liver axis to regulate hepatic steatosis

Affiliations

Serotonin signals through a gut-liver axis to regulate hepatic steatosis

Wonsuk Choi et al. Nat Commun. .

Erratum in

Abstract

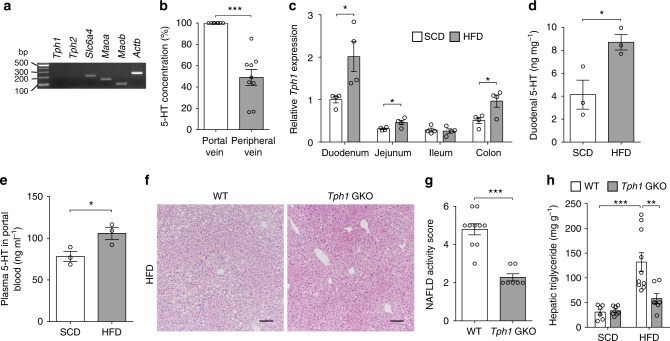
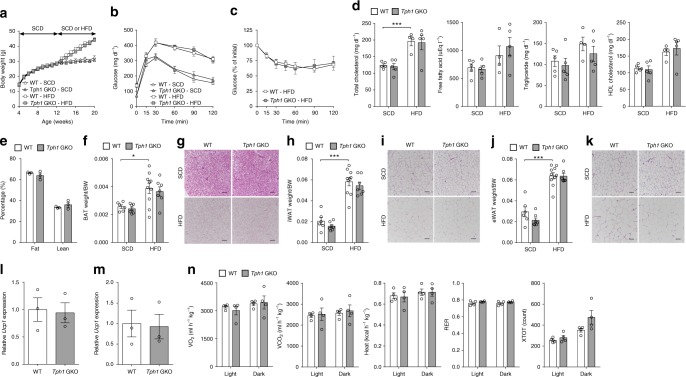
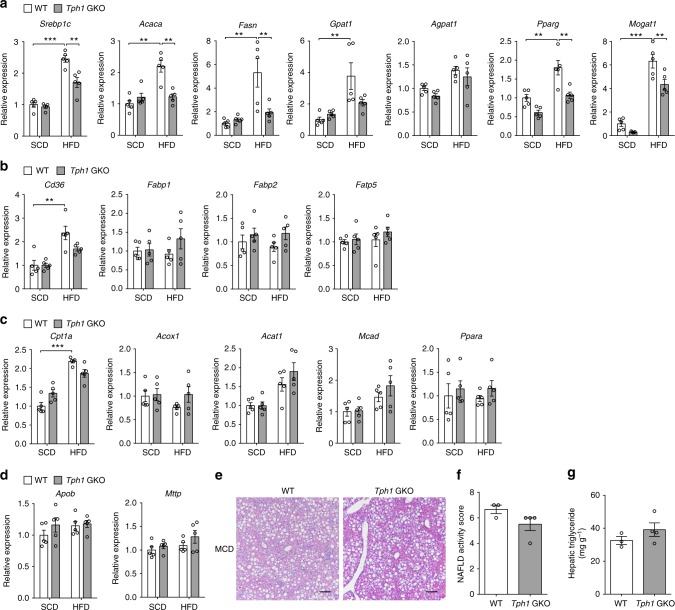
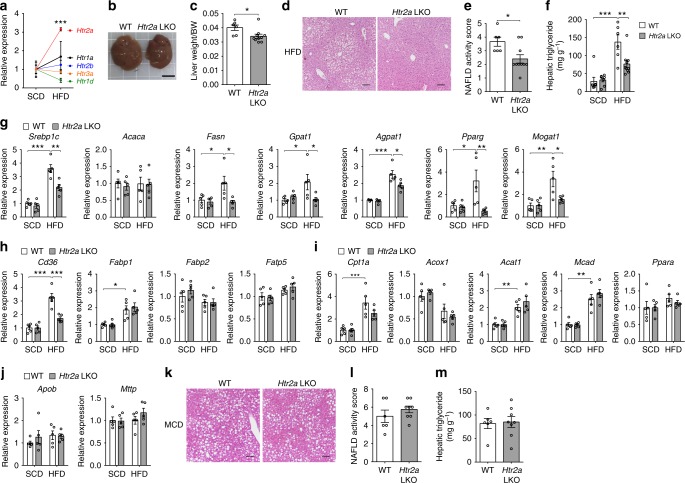
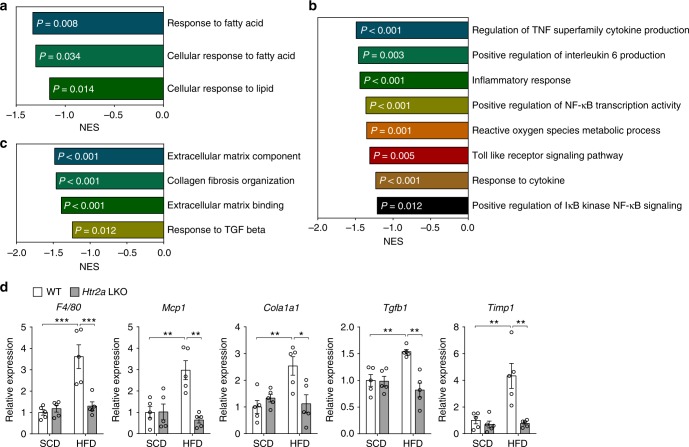
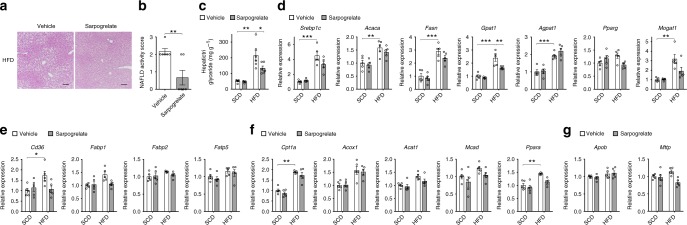
Nonalcoholic fatty liver disease (NAFLD) is increasing in worldwide prevalence, closely tracking the obesity epidemic, but specific pharmaceutical treatments for NAFLD are lacking. Defining the key molecular pathways underlying the pathogenesis of NAFLD is essential for developing new drugs. Here we demonstrate that inhibition of gut-derived serotonin synthesis ameliorates hepatic steatosis through a reduction in liver serotonin receptor 2A (HTR2A) signaling. Local serotonin concentrations in the portal blood, which can directly travel to and affect the liver, are selectively increased by high-fat diet (HFD) feeding in mice. Both gut-specific Tph1 knockout mice and liver-specific Htr2a knockout mice are resistant to HFD-induced hepatic steatosis, without affecting systemic energy homeostasis. Moreover, selective HTR2A antagonist treatment prevents HFD-induced hepatic steatosis. Thus, the gut TPH1-liver HTR2A axis shows promise as a drug target to ameliorate NAFLD with minimal systemic metabolic effects.


Conflict of interest statement

The authors declare no competing interests.

Figures

Fig. 1
Fig. 1
Gut-derived 5-HT regulates HFD-induced hepatic steatosis. a mRNA expression of genes involved in 5-HT metabolism as assessed by RT-PCR in liver from 8-week-old C57BL/6J mice. b Plasma 5-HT concentrations of portal blood and peripheral blood in humans. Portal blood concentration set as 100%; n = 9 per group. ce The 12-week-old male C57BL/6J mice were fed standard chow diet (SCD) or high-fat diet (HFD) for 8 weeks. c Tph1 mRNA expression in the duodenum, jejunum, ileum, and colon as assessed by qRT-PCR; n = 4 per group. d Duodenal 5-HT levels; n = 3 per group. e Plasma 5-HT levels in portal blood; n = 3 per group. fh The 12-week-old WT and Tph1 GKO mice were fed SCD or HFD for 8 weeks. f Representative liver histology by hematoxylin and eosin (H&E) staining from HFD-fed WT and Tph1 GKO mice. Scale bars, 100 μm. g Nonalcoholic fatty liver disease activity score (NAS) of HFD-fed WT and Tph1 GKO mice; n = 7–10 per group. h Hepatic triglyceride levels; n = 6–10 per group. Data are expressed as the means ± SEM. *P < 0.5, **P < 0.01, ***P < 0.001, Student’s t-test (be, g) or one-way ANOVA with post hoc Tukey’s test (h)
Fig. 2
Fig. 2
Gut-derived 5-HT does not affect systemic energy metabolism. an The 12-week-old WT and Tph1 GKO mice were fed SCD or HFD for 8 weeks. a Body weight trends; n = 6–10 per group. b Intraperitoneal glucose tolerance test (IPGTT) after 16 h fasting; n = 5 per group. c Intraperitoneal insulin tolerance test (IPITT) of HFD-fed WT and Tph1 GKO mice after 4 h fasting; n = 5 per group. d Plasma total cholesterol, free fatty acid, triglyceride, and high-density lipoprotein (HDL) cholesterol levels; n = 4–5 per group. e Percent fat body mass and lean body mass of HFD-fed WT and Tph1 GKO mice; n = 3 per group. f, h, j Adipose tissue to body weight ratio of BAT (f), iWAT (h), and eWAT (j); n = 6–10 per group. g, i, k Representative histology by H&E staining of sections from BAT (g), iWAT (i), and eWAT (k). Scale bars, 100 μm. l, m Relative mRNA expression of Ucp1 assessed by qRT-PCR in BAT (l) and iWAT (m) of HFD-fed WT or Tph1 GKO mice; n = 3 per group. n Metabolic parameters of HFD-fed WT or Tph1 GKO mice; n = 4 per group. Data are expressed as the means ± SEM. *P < 0.5, ***P < 0.001, Student’s t-test (c, e, l, m) or one-way ANOVA with post hoc Tukey’s test (a, b, d, f, h, j, n). VO2: oxygen consumption, VCO2: carbon dioxide production, RER: respiratory exchange ratio, XTOT: horizontal motor activity
Fig. 3
Fig. 3
Gut-derived 5-HT regulates lipogenic pathways in the liver. ad The 12-week-old WT and Tph1 GKO mice were fed SCD or HFD for 8 weeks. Relative mRNA expression of genes involved in lipogenesis (a), FA uptake (b), FA oxidation (c), and VLDL secretion (d) as assessed by qRT-PCR in liver; n = 5 per group. eg The 8-week-old WT and Tph1 GKO mice were fed MCD diet for 6 weeks. e Representative liver histology by H&E staining. Scale bars, 100 μm. f NAS; n = 3–4 per group. g Hepatic triglyceride levels; n = 3–4 per group. Data are expressed as the means ± SEM. **P < 0.01, ***P < 0.001, Student’s t-test (f, g) or one-way ANOVA with post hoc Tukey’s test (ad)
Fig. 4
Fig. 4
HTR2A mediates the lipogenic action of GDS in the liver. a Relative mRNA expression of indicated HTRs as assessed by qRT-PCR in liver of SCD- and HFD-fed C57BL/6J mice; n = 4 per group. bj The 12-week-old WT and Htr2a LKO mice were fed SCD or HFD for 8 weeks. Representative gross liver image (b) and liver weight (c) of HFD-fed WT and Htr2a LKO mice; n = 6–10 per group. Scale bar, 1 cm (b). d Representative liver histology by H&E staining from HFD-fed WT and Htr2a LKO mice. Scale bars, 100 μm. e NAS of HFD-fed WT and Htr2a LKO mice; n = 6–10 per group. f Hepatic triglyceride levels; n = 6–10 per group. gj Relative mRNA expression of genes involved in lipogenesis (g), FA uptake (h), FA oxidation (i), and VLDL secretion (j) as assessed by qRT-PCR in liver; n = 5 per group. km The 8-week-old WT and Htr2a LKO mice were fed MCD diet for 6 weeks. k Representative liver histology by H&E staining. Scale bars, 100 μm. l NAS; n = 6–8 per group. m Hepatic triglyceride levels; n = 6–8 per group. Data are expressed as the means ± SEM. *P < 0.5, **P < 0.01, ***P < 0.001, Student’s t-test (a, c, e, l, m) or one-way ANOVA with post hoc Tukey’s test (fj)
Fig. 5
Fig. 5
HTR2A mediates the inflammatory and fibrogenic action of GDS in the liver. ad The 12-week-old WT and Htr2a LKO mice were fed HFD for 8 weeks. ac GO gene sets were analyzed by GSEA for HFD-fed Htr2a LKO mice livers compared with WT littermates livers. Gene sets related to hepatic steatosis (a), inflammation (b), and fibrosis (c); n = 3 per group. d Relative mRNA expression of genes involved in inflammation and fibrosis as assessed by qRT-PCR in liver; n = 5 per group. Data are expressed as the means ± SEM. *P < 0.5, **P < 0.01, ***P < 0.001, one-way ANOVA with post hoc Tukey’s test (d)
Fig. 6
Fig. 6
HTR2A antagonist ameliorates HFD-induced hepatic steatosis. ag The 12-week-old mice were fed SCD or HFD for 8 weeks and were treated with vehicle or sarpogrelate daily per os. a Representative liver histology by H&E staining from HFD-fed vehicle and sarpogrelate treated mice. Scale bars, 100 μm. b NAS of HFD-fed vehicle and sarpogrelate-treated mice; n = 6 per group. c Hepatic triglyceride levels; n = 5–6 per group. dg Relative mRNA expression of genes involved in lipogenesis (d), FA uptake (e), FA oxidation (f), and VLDL secretion (g) as assessed by qRT-PCR in liver; n = 5 per group. Data are expressed as the means ± SEM. *P < 0.5, **P < 0.01, ***P < 0.001, Student’s t-test (b) or one-way ANOVA with post hoc Tukey’s test (cg)

References

    1. Younossi Z, et al. Global burden of NAFLD and NASH: trends, predictions, risk factors and prevention. Nat. Rev. Gastroenterol. Hepatol. 2018;15:11–20. doi: 10.1038/nrgastro.2017.109. - DOI - PubMed
    1. Pais R, et al. NAFLD and liver transplantation: current burden and expected challenges. J. Hepatol. 2016;65:1245–1257. doi: 10.1016/j.jhep.2016.07.033. - DOI - PMC - PubMed
    1. Michelotti GA, Machado MV, Diehl AM. NAFLD, NASH and liver cancer. Nat. Rev. Gastroenterol. Hepatol. 2013;10:656–665. doi: 10.1038/nrgastro.2013.183. - DOI - PubMed
    1. Promrat K, et al. Randomized controlled trial testing the effects of weight loss on nonalcoholic steatohepatitis. Hepatology. 2010;51:121–129. doi: 10.1002/hep.23276. - DOI - PMC - PubMed
    1. Sullivan S, Kirk EP, Mittendorfer B, Patterson BW, Klein S. Randomized trial of exercise effect on intrahepatic triglyceride content and lipid kinetics in nonalcoholic fatty liver disease. Hepatology. 2012;55:1738–1745. doi: 10.1002/hep.25548. - DOI - PMC - PubMed

Publication types

MeSH terms