

Employing a spatio-temporal contingency table for the analysis of cork oak cover change in the Sa Serra region of Sardinia
- PMID: 30446680
- PMCID: PMC6240039
- DOI: 10.1038/s41598-018-35319-1
Employing a spatio-temporal contingency table for the analysis of cork oak cover change in the Sa Serra region of Sardinia
Abstract
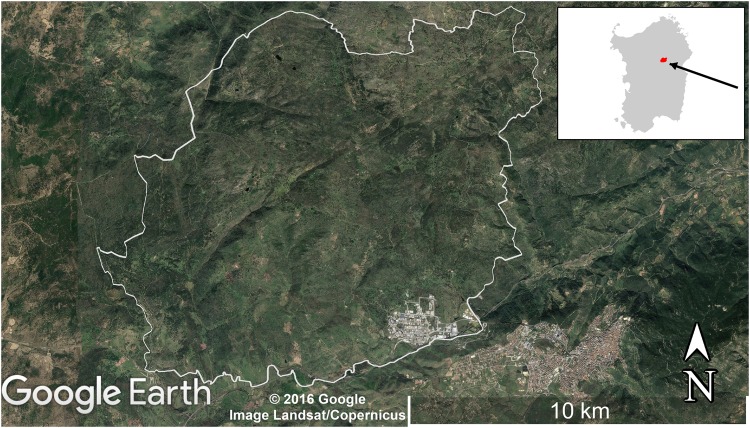
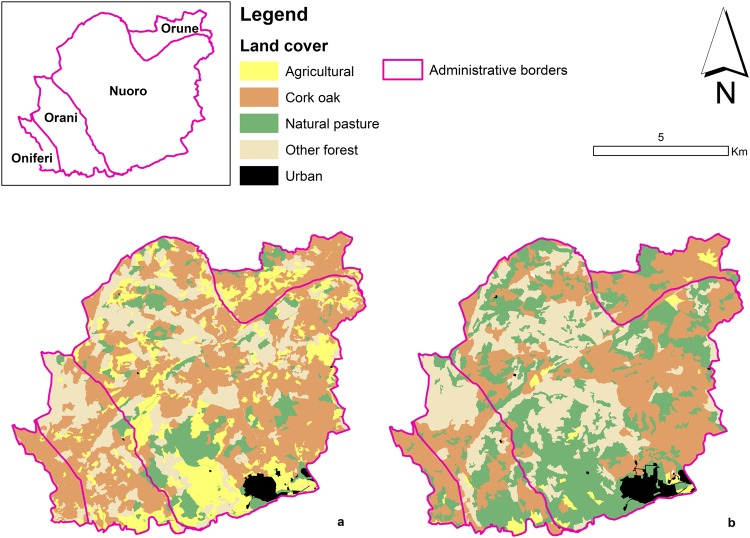
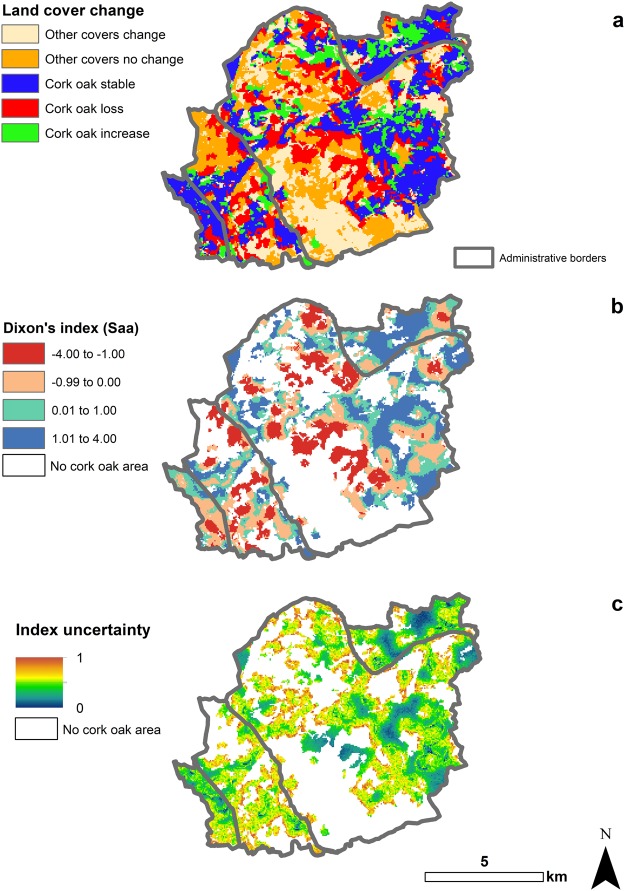
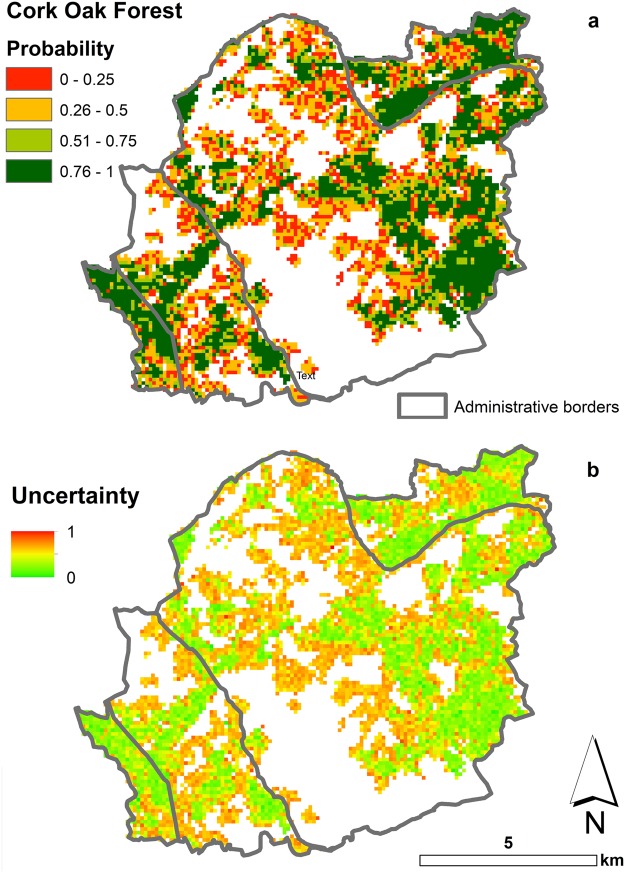
Land cover change analyses are common and, especially in the absence of explanatory variables, they are mainly carried out by employing qualitative methods such as transition matrices or raster operations. These methods do not provide any estimation of the statistical significance of the changes, or the uncertainty of the model and data, and are usually limited in supporting explicit biological/ecological interpretation of the processes determining the changes. Here we show how the original nearest-neighbour contingency table, proposed by Dixon to evaluate spatial segregation, has been extended to the temporal domain to map the intensity, statistical significance and uncertainty of land cover changes. This index was then employed to quantify the changes in cork oak forest cover between 1998 and 2016 in the Sa Serra region of Sardinia (Italy). The method showed that most statistically significant cork oak losses were concentrated in the centre of Sa Serra and characterised by high intensity. A spatial binomial-logit generalised linear model estimated the probability of changes occurring in the area but not the type of change. We show how the spatio-temporal Dixon's index can be an attractive alternative to other land cover change analysis methods, since it provides a robust statistical framework and facilitates direct biological/ecological interpretation.
Conflict of interest statement
The authors declare no competing interests.
Figures
References
-
- Aronson, J., Pereira, J. S. & Pausas, J. G. Cork oak woodlands on the edge: ecology, adaptive management, and restoration. (Island Press, 2012).
-
- Sedda L, Delogu G, Dettori S. Forty-four years of land use changes in a Sardinian cork oak agro-silvopastoral system: a qualitative analysis. The Open Forest Science Journal. 2011;4:57–66. doi: 10.2174/1874398601104010057. - DOI
-
- Santos Maria, Baumann Matthias, Esgalhado Catarina. Drivers of Productivity Trends in Cork Oak Woodlands over the Last 15 Years. Remote Sensing. 2016;8(6):486. doi: 10.3390/rs8060486. - DOI
-
- Urbieta IR, Zavala MA, Maranon T. Human and non-human determinants of forest composition in southern Spain: evidence of shifts towards cork oak dominance as a result of management over the past century. J Biogeogr. 2008;35:1688–1700. doi: 10.1111/j.1365-2699.2008.01914.x. - DOI
-
- Dettori S, Falqui A, Filigheddu MR, Sedda L. Growth performance of cork oak plantations recently established on farmlands in Sardinia, Italy. Forest@ - Rivista di Selvicoltura ed Ecologia Forestale. 2006;3:327–338. doi: 10.3832/efor0395-0030327. - DOI
Publication types
MeSH terms
LinkOut - more resources
Full Text Sources
