

Genetic structure and differentiation in Dendrocalamus sinicus (Poaceae: Bambusoideae) populations provide insight into evolutionary history and speciation of woody bamboos
- PMID: 30446690
- PMCID: PMC6240087
- DOI: 10.1038/s41598-018-35269-8
Genetic structure and differentiation in Dendrocalamus sinicus (Poaceae: Bambusoideae) populations provide insight into evolutionary history and speciation of woody bamboos
Abstract
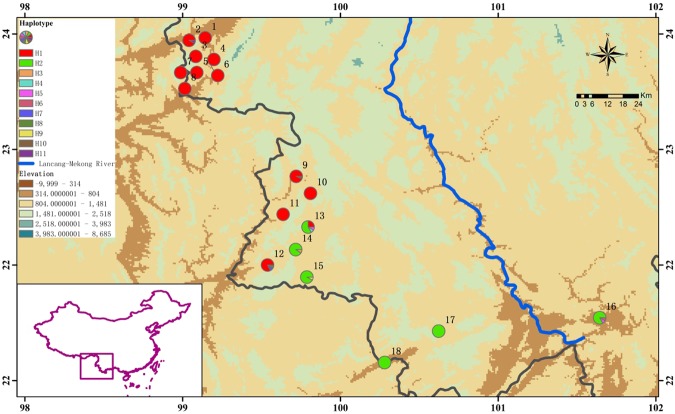
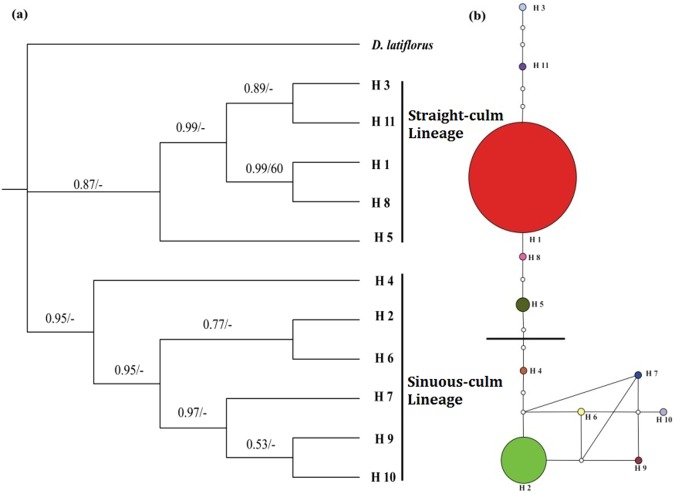
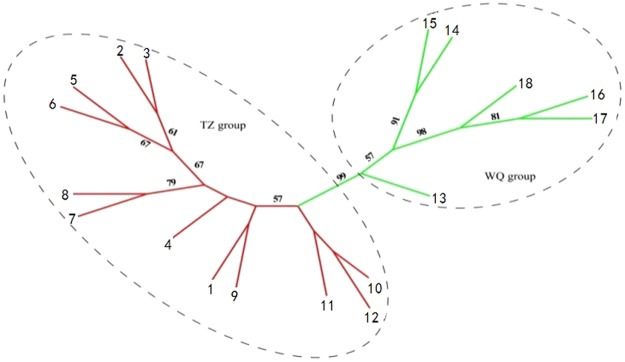
Evolutionary processes, speciation in woody bamboos are presently little understood. Here we used Dendrocalamus sinicus Chia & J.L. Sun as a model species to investigate dispersal or vicariance speciation in woody bamboos. Variation in three chloroplast DNA (cpDNA) fragments and eight simple sequence repeat markers (SSR) among 232 individuals sampled from 18 populations across the known geographic range of D. sinicus was surveyed. D. sinicus populations exhibited a high level of genetic differentiation which divided them into two groups that are consistent with different culm types. Eleven haplotypes and two lineages (Straight-culm and Sinuous-culm lineages) were identified from phylogenetic analyses, and a strong phylogeographic structure across the distribution range was found. The demographic and spatial expansion times of the Straight-culm lineage were calculated as 11.3 Kya and 20.8 Kya, respectively. The populations of D. sinicus had experienced dispersal and long-term isolation, although this trace was diluted by contemporary gene flow revealed by SSR data. Our results provide an phylogeographic insight to better understand the speciation processes of woody bamboos.
Conflict of interest statement
The authors declare no competing interests.
Figures


References
-
- Bamboo Phylogeny Group. An updated tribal and subtribal classification for the Bambusoideae (Poaceae). In: Process of the 9thWorld Bamboo Congress. (eds Gielis, J. & Potters, G.) 3–27 (World Bamboo Organization Antwerp Belgium, 2012).
-
- Li, D. Z. & Stapleton, C. Bambuseae. In: Flora of China (Volume 9, Poaceae) (eds Wu, Z. Y., Raven, P. H. & Hong, D. Y.) 1–180 (Science Press Beijing & Missouri Botanic Garden Press St. Louis USA, 2006).
-
- Sun, M. S., Yan, B., Xu, T. & Yu, L. X. Resources and Utilization of Bamboo Plants 1–34 (Science Press Beijing, 2015).
-
- Goh WL, et al. Multi-gene region phylogenetic analyses suggest reticulate evolution and a clade of Australian origin among paleotropical woody bamboos (Poaceae: Bambusoideae: Bambuseae) Plant Systematics and Evolution. 2013;299(1):239–257. doi: 10.1007/s00606-012-0718-1. - DOI
Publication types
MeSH terms
Substances
LinkOut - more resources
Full Text Sources
