Increased susceptibility to cortical spreading depression and epileptiform activity in a mouse model for FHM2
- PMID: 30446731
- PMCID: PMC6240030
- DOI: 10.1038/s41598-018-35285-8
Increased susceptibility to cortical spreading depression and epileptiform activity in a mouse model for FHM2
Abstract
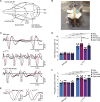
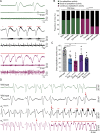
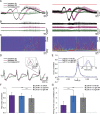
Migraine is a highly prevalent, debilitating, episodic headache disorder affecting roughly 15% of the population. Familial hemiplegic migraine type 2 (FHM2) is a rare subtype of migraine caused by mutations in the ATP1A2 gene, encoding the α2 isoform of the Na+/K+-ATPase, predominantly expressed in astrocytes. Differential comorbidities such as epilepsy and psychiatric disorders manifest in patients. Using a mouse model harboring the G301R disease-mutation in the α2 isoform, we set to unravel whether α2+/G301R mice show an increased susceptibility for epilepsy and cortical spreading depression (CSD). We performed in vivo experiments involving cortical application of KCl in awake head-restrained male and female mice of different age groups (adult and aged). Interestingly, α2+/G301R mice indeed showed an increased susceptibility to both CSD and epileptiform activity, closely replicating symptoms in FHM2 patients harboring the G301R and other FHM2-causing mutations. Additionally, this epileptiform activity was superimposed on CSDs. The age-related alteration towards CSD indicates the influence of female sex hormones on migraine pathophysiology. Therefore, the FHM2, α2+/G301R mouse model can be utilized to broaden our understanding of generalized epilepsy and comorbidity hereof in migraine, and may be utilized toward future selection of possible treatment options for migraine.
Conflict of interest statement
The authors declare no competing interests.
Figures


Similar articles
-
Glutamate-system defects behind psychiatric manifestations in a familial hemiplegic migraine type 2 disease-mutation mouse model.Sci Rep. 2016 Feb 25;6:22047. doi: 10.1038/srep22047. Sci Rep. 2016. PMID: 26911348 Free PMC article.
-
Increased susceptibility to cortical spreading depression in the mouse model of familial hemiplegic migraine type 2.PLoS Genet. 2011 Jun;7(6):e1002129. doi: 10.1371/journal.pgen.1002129. Epub 2011 Jun 23. PLoS Genet. 2011. PMID: 21731499 Free PMC article.
-
Enhanced susceptibility to cortical spreading depression in two types of Na+,K+-ATPase α2 subunit-deficient mice as a model of familial hemiplegic migraine 2.Cephalalgia. 2018 Aug;38(9):1515-1524. doi: 10.1177/0333102417738249. Epub 2017 Oct 17. Cephalalgia. 2018. PMID: 29041816
-
Insights into the Pathology of the α2-Na(+)/K(+)-ATPase in Neurological Disorders; Lessons from Animal Models.Front Physiol. 2016 May 4;7:161. doi: 10.3389/fphys.2016.00161. eCollection 2016. Front Physiol. 2016. PMID: 27199775 Free PMC article. Review.
-
[Genetics of migraine].Nervenarzt. 2006 Oct;77(10):1186, 1188-95. doi: 10.1007/s00115-006-2134-7. Nervenarzt. 2006. PMID: 16915377 Review. German.
Cited by
-
Cortical spreading depression can be triggered by sensory stimulation in primed wild type mouse brain: a mechanistic insight to migraine aura generation.J Headache Pain. 2022 Aug 19;23(1):107. doi: 10.1186/s10194-022-01474-0. J Headache Pain. 2022. PMID: 35986251 Free PMC article.
-
Hyperexcitable interneurons trigger cortical spreading depression in an Scn1a migraine model.J Clin Invest. 2021 Nov 1;131(21):e142202. doi: 10.1172/JCI142202. J Clin Invest. 2021. PMID: 34546973 Free PMC article.
-
The vascular Na,K-ATPase: clinical implications in stroke, migraine, and hypertension.Clin Sci (Lond). 2023 Oct 31;137(20):1595-1618. doi: 10.1042/CS20220796. Clin Sci (Lond). 2023. PMID: 37877226 Free PMC article. Review.
-
Astrocytic Glutamate Transporters and Migraine.Neurochem Res. 2023 Apr;48(4):1167-1179. doi: 10.1007/s11064-022-03849-w. Epub 2022 Dec 30. Neurochem Res. 2023. PMID: 36583835 Review.
-
A systematic literature review on the role of glial cells in the pathomechanisms of migraine.Front Mol Neurosci. 2023 Jun 30;16:1219574. doi: 10.3389/fnmol.2023.1219574. eCollection 2023. Front Mol Neurosci. 2023. PMID: 37456527 Free PMC article.
References
-
- Headache Classification Committee of the International Headache Society. The International Classification of Headache Disorders, 3rd edition (beta version). Cephalalgia. 33 629–808 (2013). - PubMed
-
- Bøttger P, Doğanlı C, Lykke-Hartmann K. Migraine- and dystonia-related disease-mutations of Na+/K+-ATPases: relevance of behavioral studies in mice to disease symptoms and neurological manifestations in humans. Neurosci. Biobehav. Rev. 2012;36:855–871. doi: 10.1016/j.neubiorev.2011.10.005. - DOI - PubMed
Publication types
MeSH terms
Substances
Supplementary concepts
Grants and funding
LinkOut - more resources
Full Text Sources
Medical
Molecular Biology Databases

