Review
. 2019 Mar;13(3):563-575.
doi: 10.1038/s41396-018-0309-4. Epub 2018 Nov 16.

A Foraging Mandala for Aquatic Microorganisms

Affiliations
Review

A Foraging Mandala for Aquatic Microorganisms

Vicente I Fernandez et al. ISME J. 2019 Mar.

Abstract

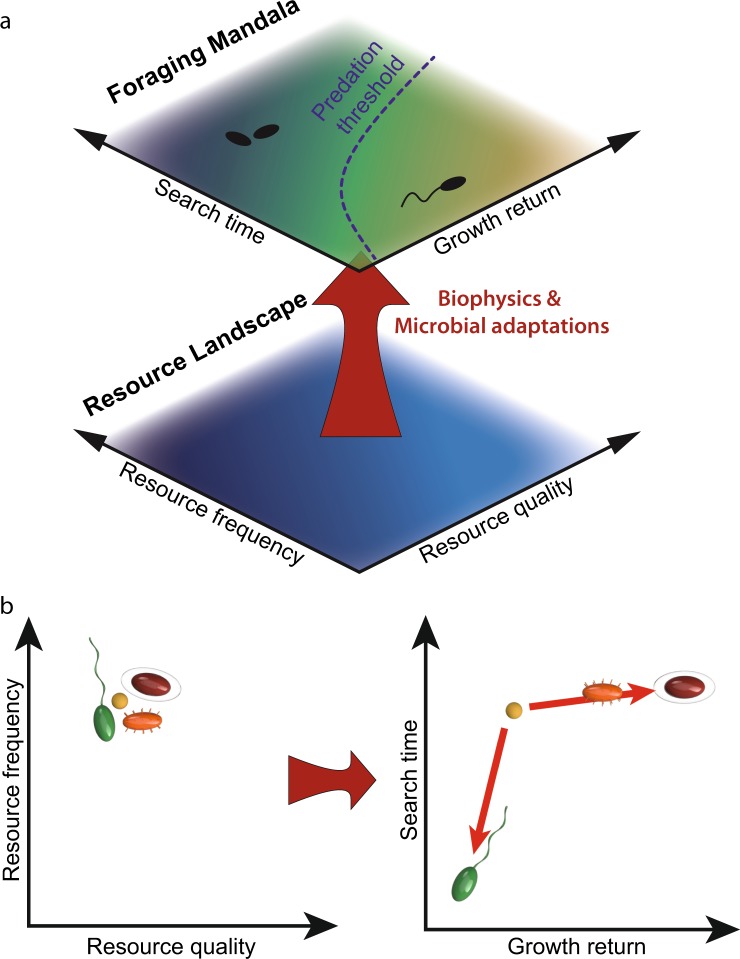
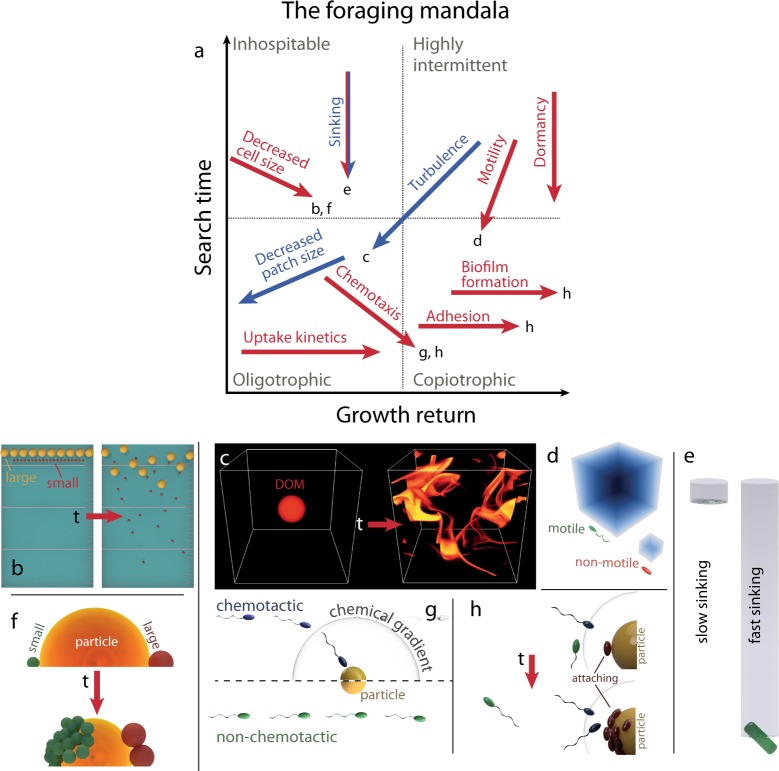
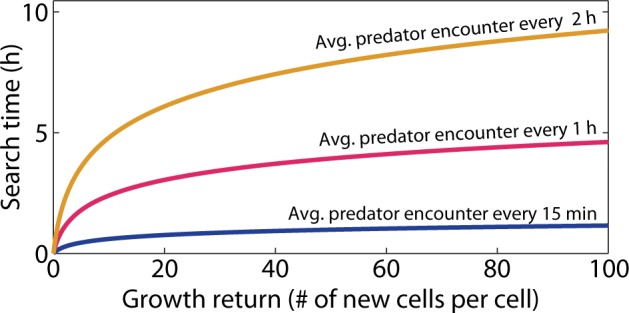
Aquatic environments harbor a great diversity of microorganisms, which interact with the same patchy, particulate, or diffuse resources by means of a broad array of physiological and behavioral adaptations, resulting in substantially different life histories and ecological success. To date, efforts to uncover and understand this diversity have not been matched by equivalent efforts to identify unifying frameworks that can provide a degree of generality and thus serve as a stepping stone to scale up microscale dynamics to predict their ecosystem-level consequences. In particular, evaluating the ecological consequences of different resource landscapes and of different microbial adaptations has remained a major challenge in aquatic microbial ecology. Here, inspired by Ramon Margalef's mandala for phytoplankton, we propose a foraging mandala for microorganisms in aquatic environments, which accounts for both the local environment and individual adaptations. This biophysical framework distills resource acquisition into two fundamental parameters: the search time for a new resource and the growth return obtained from encounter with a resource. We illustrate the foraging mandala by considering a broad range of microbial adaptations and environmental characteristics. The broad applicability of the foraging mandala suggests that it could be a useful framework to compare disparate microbial strategies in aquatic environments and to reduce the vast complexity of microbe-environment interactions into a minimal number of fundamental parameters.


Conflict of interest statement

The authors declare that they have no conflict of interest.

Figures

Fig. 1
Fig. 1
Schematic illustration of the foraging mandala for aquatic microorganisms. a The resource landscape (bottom plane), characterized in its simplest form by the frequency and quality of resource patches, is not the only determinant of foraging. Rather, biophysical processes and biological adaptations ‘map’ the resource landscape onto a foraging landscape – or foraging mandala (top plane). The latter consists of two axes – search time and growth return – that encompass foraging performance. The color-coding indicates how favorable a given condition is for microbial growth, with lighter colors corresponding to more favorable conditions (light blue in the resource landscape, yellow in the foraging mandala). b Organisms that inhabit the same resource landscape (same location in the resource landscape plane, at left) but have different foraging adaptations (planktonic – yellow; swimming – green; attaching – orange; attaching and biofilm forming – red) will occupy different regions in the foraging mandala (at right), representative of their different foraging performances in that resource landscape. For example, swimming reduces the search time and thus shifts the position on the mandala downward, while attachment and biofilm formation enhance the growth return and thus shift the position on the mandala rightward
Fig. 2
Fig. 2
The effect of different biophysical processes and biological adaptations on the location of a given foraging strategy in the foraging mandala. a Each factor affects one or both axes of the mandala. The quadrants in panel a identify different growth regions, corresponding to inhospitable growth conditions (top left), oligotrophic growth (bottom left), copiotrophic growth (bottom right), and highly intermittent conditions (top right). The arrows corresponding to each element denote the direction in which that element moves the position of a forager in the mandala. The red and blue arrows indicate biological factors and environmental elements, respectively. The “sinking” arrow is represented in both colors because both resources and microorganisms can sink. The spatial location of each arrow is only indicative of (and not limited to) the growth region where that element may be mostly expected. Elements are further illustrated individually in panels b through h. b Size directly affects search time for non-motile microorganisms because smaller objects (red) diffuse further than larger objects (yellow) in a given time (see also Eq. 1). c Turbulence affects both search time and growth return by deforming resource patches into a plethora of filaments, for which the search time as well as the growth return are lower than for the original patch (reproduced from ref. 20). d Motile microorganisms (green) explore greater volumes of water per unit time compared to non-motile microorganisms (red), resulting in a considerable reduction in the search time. e Both sinking and rising reduce the search time because the associated flow enhances encounter rates (see also Eq. 2). f Smaller cells (green) attain greater growth returns for the same resource compared to larger cells (red). g Chemotactic microorganisms (blue) need only encounter the cloud of solutes around a resource (e.g., a particle) in order to rapidly move to the resource, thus reducing the search time compared to non-chemotactic microorganisms (green). h Retaining position relative to a resource patch, whether by chemotaxis (blue cells) or attachment (purple cells), enhances growth return, as purely randomly motile microorganisms (green) rapidly lose position relative to the patch
Fig. 3
Fig. 3
Predation thresholds in the foraging mandala. Three curves define regions (below the curves) of the foraging mandala in which the growth return is sufficient to enable at least one cell on average to successfully reach the next resource. Above the curve, predation on average wipes out a population before the next resource is found. The threshold depends on the predation rate (labeled), which in turn is a function of the predator concentration

References

    1. Hansell DA, Carlson CA, Repeta DJ, Schlitzer R. Dissolved organic matter in the ocean: a controversy stimulates new insights. Oceanography. 2009;22:202–211. doi: 10.5670/oceanog.2009.109. - DOI
    1. Azam F, Fenchel T, Field JG, Gray JS, Meyer-Reil LA, Thingstad F. The ecological role of water-column microbes in the sea. Mar Ecol Prog Ser. 1983;10:257–263. doi: 10.3354/meps010257. - DOI
    1. Field CB, Behrenfeld MJ, Randerson JT, Falkowski P. Primary production of the biosphere: integrating terrestrial and oceanic components. Science. 1998;281:237–240. doi: 10.1126/science.281.5374.237. - DOI - PubMed
    1. Kirchman DL, editor. Microbial ecology of the oceans. Hoboken, N.J: Jhon Wiley & Sons; 2008.
    1. Margalef R. Function and structure in an ecosystem: organization of plankton. In: Elskens I, Sanfeld A, Vigneron J, editors. Etude et gestion du système marin. Bruxelles: Université Libre de Bruxelles; 1977. pp. 58–88.

Publication types