Time trends in adherence to UK dietary recommendations and associated sociodemographic inequalities, 1986-2012: a repeated cross-sectional analysis
- PMID: 30446763
- PMCID: PMC6398578
- DOI: 10.1038/s41430-018-0347-z
Time trends in adherence to UK dietary recommendations and associated sociodemographic inequalities, 1986-2012: a repeated cross-sectional analysis
Abstract
Background/objectives: Little is known about time trends in diet quality and associated inequalities in the UK. This study aimed to examine trends in adherence to four UK dietary recommendations, overall and among sociodemographic subgroups, from 1986 to 2012.
Subjects/methods: We conducted a repeated cross-sectional analysis using data from three UK diet surveys: Dietary and Nutritional Survey of British Adults 1986-87 (n = 2018), National Diet and Nutrition Survey (NDNS) 2000-01 (n = 1683) and NDNS Rolling Programme 2008-12 (n = 1632). We measured adherence to dietary recommendations for fruit and vegetables, salt, oily fish, and red and processed meat, estimated using food diary record data. We compared adherence across surveys and by four sociodemographic characteristics: sex, age, socioeconomic position and ethnicity.
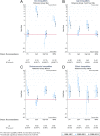
Results: Overall, population adherence to dietary recommendations was low to moderate, but improved over time. There were inequalities in adherence to all recommendations at all timepoints according to one or more sociodemographic characteristic. When inequalities were present, women, older adults, those with non-manual occupations and non-Whites were more likely to adhere to dietary recommendations. Although some dietary inequalities declined, most persisted across the three surveys.
Conclusions: The persistence of most inequalities highlights the need for further interventions to reduce dietary inequalities as well as improve overall population diet. The greatest simultaneous improvement in population adherence and reduction of inequalities was observed for salt, which may reflect the success of the UK Salt Reduction Programme. Similarly comprehensive programmes should be encouraged for other dietary components.
Conflict of interest statement
The authors declare that they have no conflict of interest.
Figures

References
-
- GBD 2016 Risk Factors Collaborators Global, regional, and national comparative risk assessment of 84 behavioural, environmental and occupational, and metabolic risks or clusters of risks, 1990–2016: a systematic analysis for the Global Burden of Disease Study 2016. Lancet. 2015;2017:1345–422. - PMC - PubMed
-
- Newton JN, Briggs ADM, Murray CJL, Dicker D, Foreman KJ, Wang H, et al. Changes in health in England, with analysis by English regions and areas of deprivation, 1990–2013: a systematic analysis for the Global Burden of Disease Study 2013. Lancet. 2015;386:2257–74. doi: 10.1016/S0140-6736(15)00195-6. - DOI - PMC - PubMed
-
- Public Health England. National Diet and Nutrition Survey Results from Years 1, 2, 3 and 4 (combined) of the Rolling Programme (2008/2009-211-2012). London: Public Health England; 2014.
Publication types
MeSH terms
Grants and funding
LinkOut - more resources
Full Text Sources
Medical

