. 2019 Feb;76(4):757-775.
doi: 10.1007/s00018-018-2966-x. Epub 2018 Nov 16.

Bardet-Biedl Syndrome proteins regulate cilia disassembly during tissue maturation

Affiliations

Bardet-Biedl Syndrome proteins regulate cilia disassembly during tissue maturation

Sarita Rani Patnaik et al. Cell Mol Life Sci. 2019 Feb.

Abstract

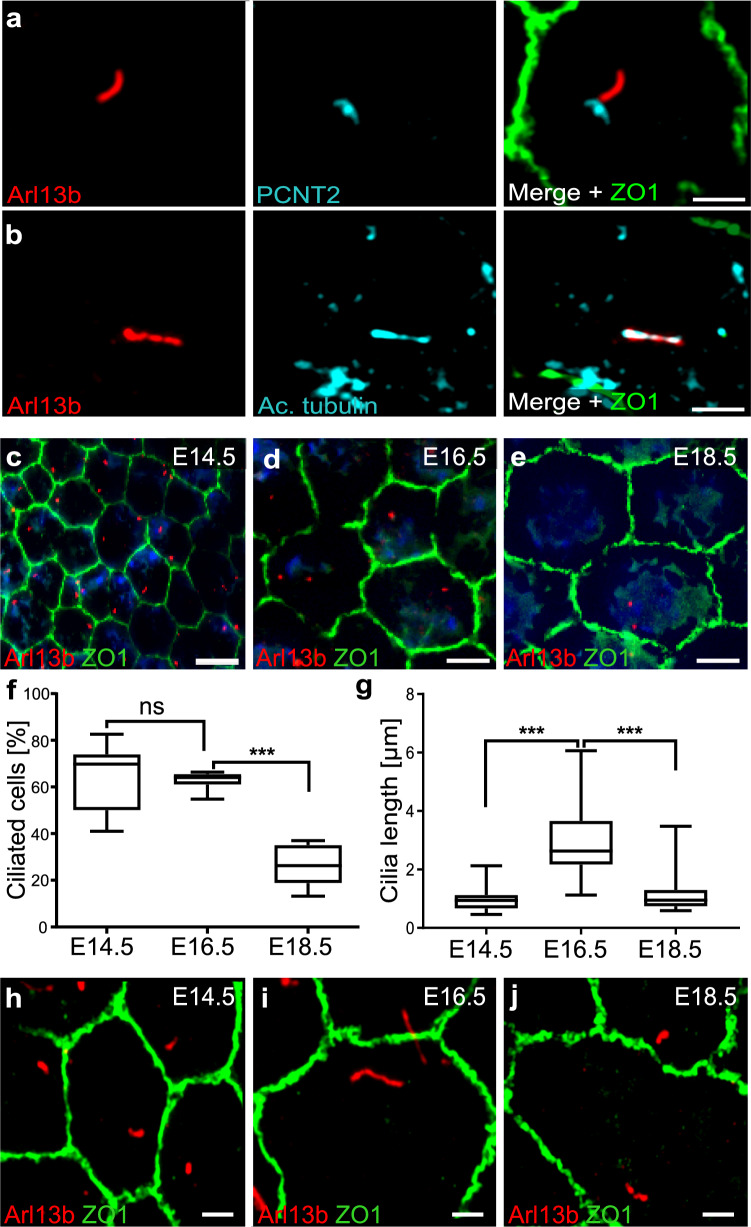
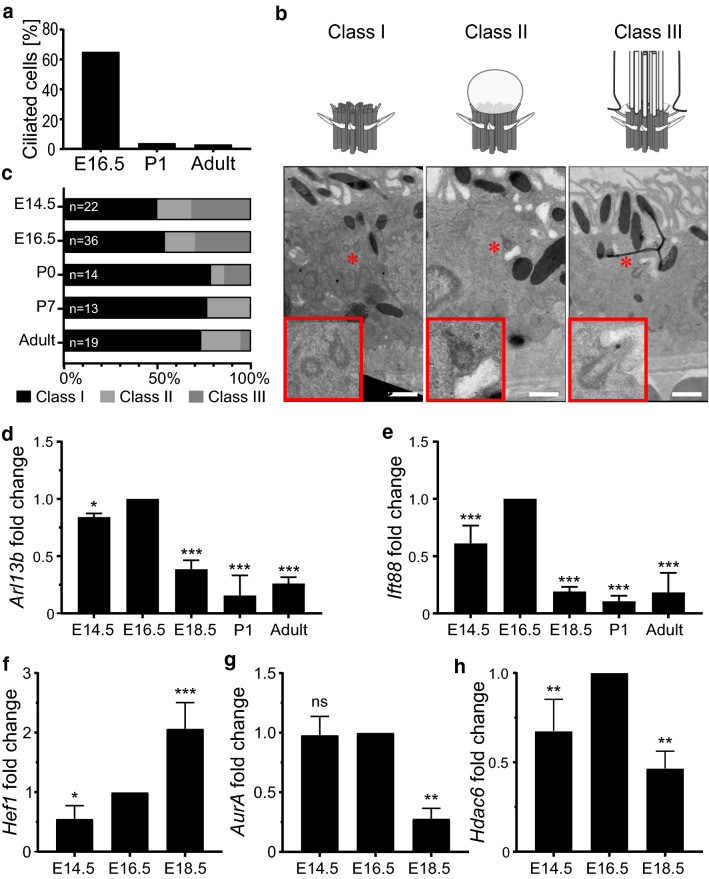
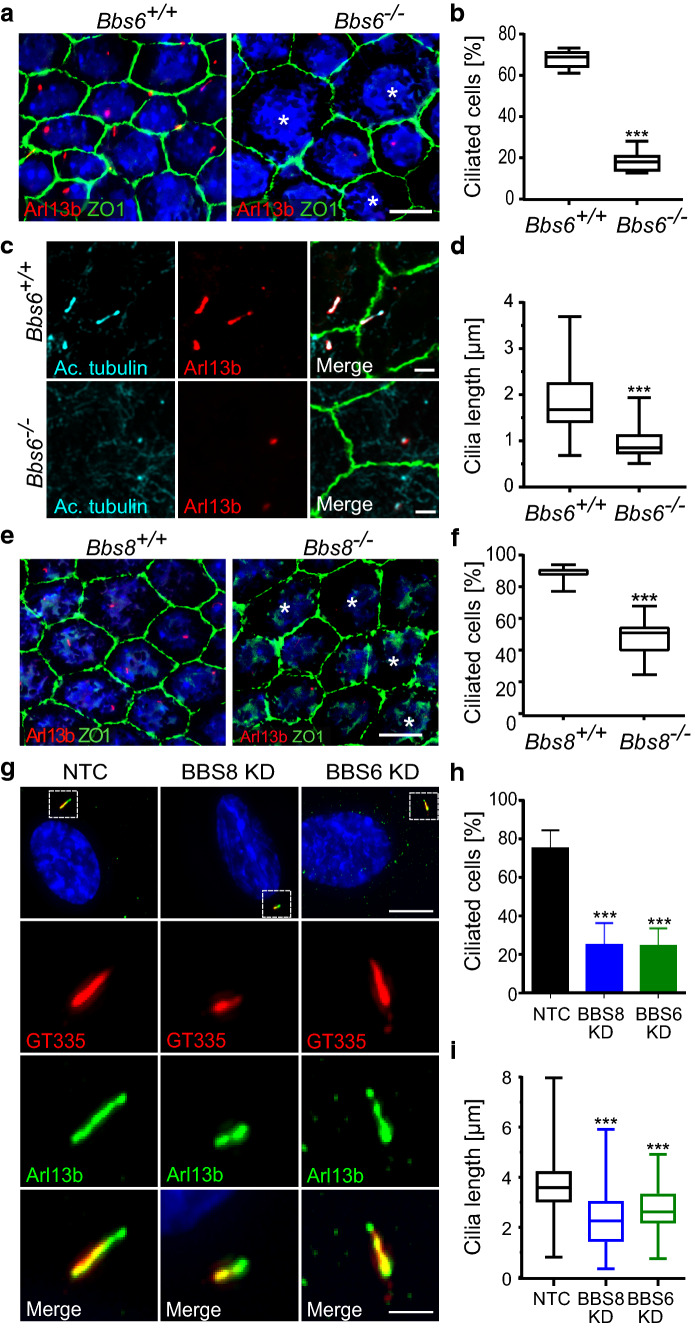
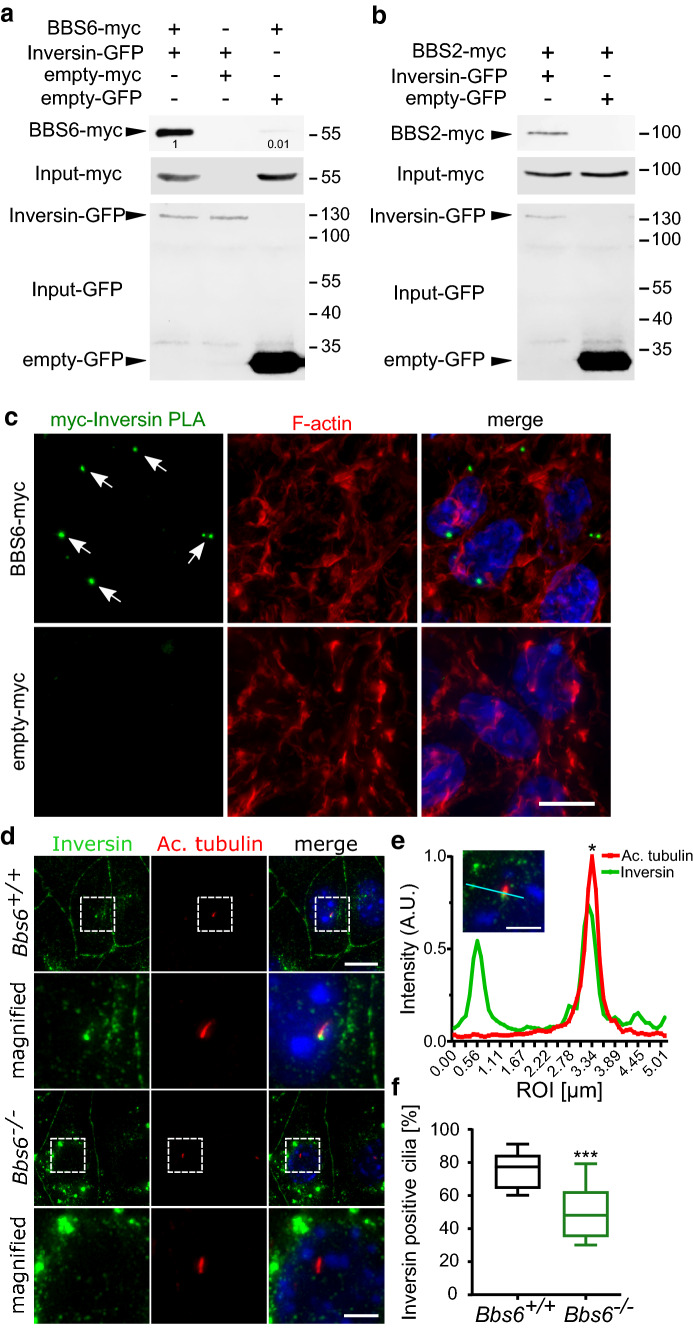
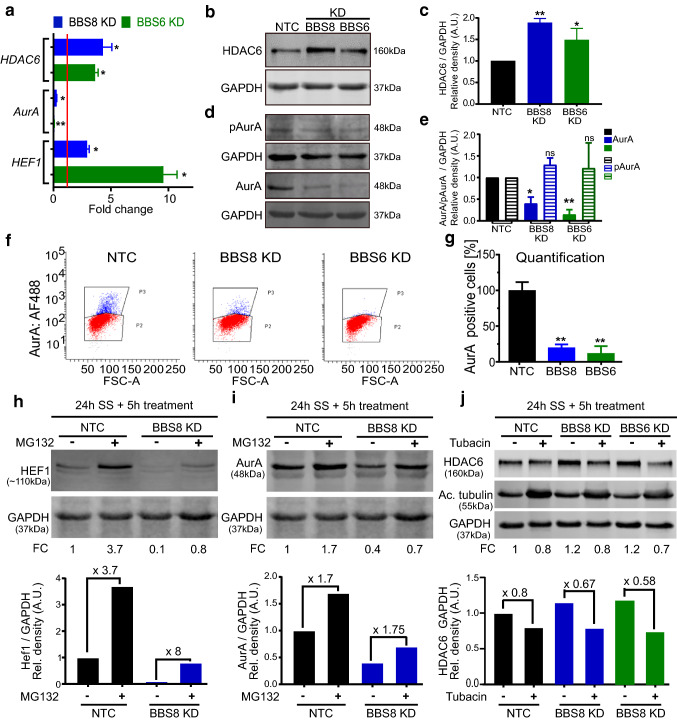
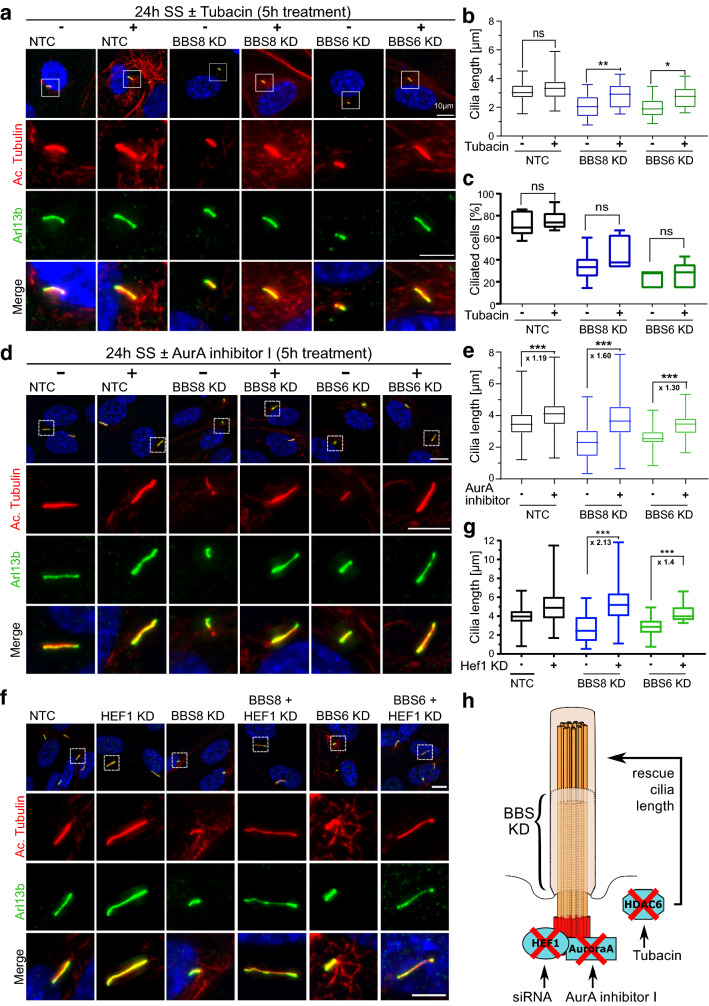
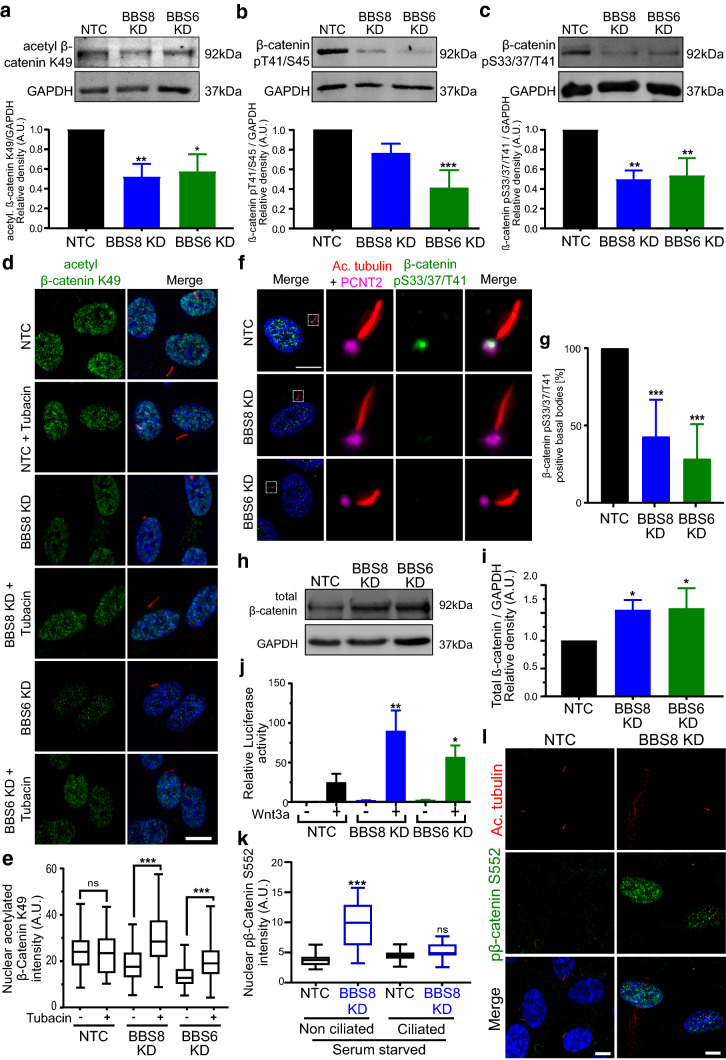
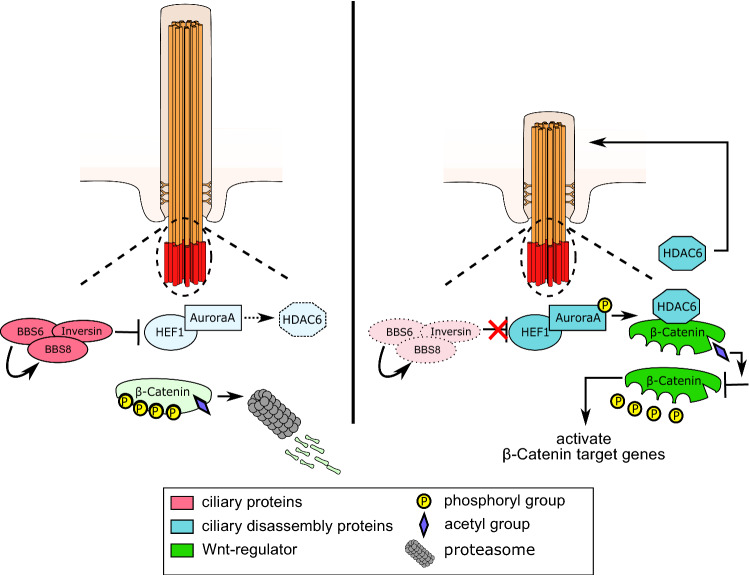
Primary cilia are conserved organelles that mediate cellular communication crucial for organogenesis and homeostasis in numerous tissues. The retinal pigment epithelium (RPE) is a ciliated monolayer in the eye that borders the retina and is vital for visual function. Maturation of the RPE is absolutely critical for visual function and the role of the primary cilium in this process has been largely ignored to date. We show that primary cilia are transiently present during RPE development and that as the RPE matures, primary cilia retract, and gene expression of ciliary disassembly components decline. We observe that ciliary-associated BBS proteins protect against HDAC6-mediated ciliary disassembly via their recruitment of Inversin to the base of the primary cilium. Inhibition of ciliary disassembly components was able to rescue ciliary length defects in BBS deficient cells. This consequently affects ciliary regulation of Wnt signaling. Our results shed light onto the mechanisms by which cilia-mediated signaling facilitates tissue maturation.

Keywords: Ciliopathy; Proteasomal degradation; Retinal dystrophy; Signaling inhibitors; Signaling pathways.


Conflict of interest statement

The authors declares that they have no conflict of interest.

Figures

Fig. 1
Fig. 1
The primary cilium is transiently expressed during RPE development. Representative high-resolution immunofluorescence images of E16.5 mouse RPE flatmounts labeled with antibodies against ciliary structures show co-localization of Arl13b and acetylated α-tubulin extending from the basal body (a, b). Arl13b (axoneme marker, red); Pericentrin 2 (PCNT2, basal body marker, cyan); acetylated α-tubulin (Ac. tubulin, axoneme marker, cyan); Zona Occludens (ZO-1, cell junctions, green). Low magnification immunofluorescence images show ciliation (number of ciliated cells) at three embryonic timepoints (ce). Boxplots show a significant decrease in the number of ciliated cells from E14.5 to E18.5 (f). E14.5 n = 1700 cells, E16.5 n = 750 cells, E18.5 n = 650 cells. Boxplots of cilia length demonstrate that mouse RPE cilia are longest at E16.5 (g). n = 25 for each age group. High-resolution immunofluorescence images of cilia (Arl13b, red) highlight differences in ciliary length between E14.5 and E18.5 (hj) as quantified in g. Three or more animals were used per data set. Statistics were done using the Dunnett’s multiple comparison test ***p ≤ 0.001; ns not significant. Scale bars: a, b, h, i, j 2 µm; ce 10 µm
Fig. 2
Fig. 2
Primary cilia disassemble during mouse RPE development. Quantification of ciliation in mouse RPE at E16.5, post-natal day 1 (P1) and adult show that the number of ciliated cells drastically decreased after birth (a). Transmission electron micrographs of basal bodies or ciliary axoneme profiles (marked by red asterisks) of adult mouse RPE (b). Schematics show classification of ciliary structures into different classes (I, II and III), depending on the absence (class I) or presence of a membranous attachment (the ciliary vesicle) (class II) or ciliary axoneme (class III). Quantification of class I-III profiles shows that the number of class III profiles decrease as the RPE matures (c). Gene expression as measured by quantitative real-time PCR from isolated primary mouse RPE cells show altered expression of ciliary (Arl13b and Ift88) and ciliary disassembly markers (Hef1, AurA and Hdac6) (dh). Fold changes and significance were calculated relative to E16.5. Values represent data from three or more independent animals (biological repeats) each with three technical repeats per data set. Statistics were done using the Dunnett’s multiple comparison test *p ≤ 0.05; **p ≤ 0.01; ***p ≤ 0.001; ns not significant. Scale bars: 2 µm
Fig. 3
Fig. 3
Absence of BBS proteins decreases RPE ciliation in vivo and in vitro. Representative immunofluorescence images of E16.5 mouse RPE flatmounts from wildtype and Bbs6/ littermates, labeled with antibodies against the primary cilium (Arl13b; red, acetylated α-tubulin (Ac. tubulin); cyan) and cell junctions (Zona Occludens (ZO-1); green) (a, c). Boxplots of ciliation (b) and cilia length (d) show a significant decrease in cilia number and cilia length in Bbs6 knockout animals. Representative immunofluorescence images of E16.5 mouse RPE flatmounts from wildtype and Bbs8/ littermates, labeled with antibodies against Arl13b; red and ZO-1; green show a reduced number of ciliated cells in Bbs8 knockout mice (e). Boxplots confirmed the significant reduction of ciliated cells in Bbs8 knockout RPE (f). Representative immunofluorescence images of primary cilia labeled with antibodies against Arl13b; green and polyglutamylated tubulin (GT335); red in BBS8 and BBS6 KD hTERT-RPE1 compared to non-targeting control (NTC) (g). Graphical representation of percentage of ciliated cells (NTC n = 250, BBS8 KD n = 150 and BBS6 KD n = 200) (h) and cilia length (i) of control in comparison to KD cells. White asterisks (*) label cells lacking cilia. Three or more individual animals were used per sample set. Statistical analyses in b, d and f were performed using two-tailed Mann–Whitney U test, where ***p < 0.001. For dn = 40 cells per genotype. Statistical analyses in h and i were done using the Dunnett’s multiple comparison test ***p ≤ 0.001. Scale bars: a, e 10 µm; b 2 µm; g 10 µm, magnified images 5 µm. KD Knockdown
Fig. 4
Fig. 4
Mislocalization of Inversin upon loss of BBS proteins. HEK293T cells transiently co-transfected with myc-tagged BBS and Inversin-GFP plasmids. Cell lysates subjected to GFP-TRAP pulldown followed by Western blotting show that Inversin-GFP interacts with myc-tagged BBS6 (a) and myc-tagged BBS2 (b). Proximity ligation assays (PLA) of HEK cells overexpressing myc-BBS6 were performed using antibodies against myc and endogenous Inversin. Positive PLA foci (green) indicate interaction between Inversin and BBS6. Empty-myc transfected control cells did not display positive PLA foci. TRITC-Phalloidin (F-actin, red) was used to visualize cell outlines (c). Representative immunofluorescence images of kidney medullary (KM) cells labeled with antibodies against the primary cilium (acetylated α-tubulin (Ac. tubulin); red) and Inversin (green) show diminished localization of Inversin to the base of the cilium in Bbs6/ cells as compared to the wildtype control (d). ROI linear profile represents fluorescence intensity of corresponding cyan line on the merged image. Peaks indicated by asterisk represent area of co-localization of Inversin and Ac. tubulin in wildtype KM cells (e). Bbs6+/+n = 215 cilia, Bbs6/n = 140 cilia. Boxplots show a reduction in percentage of Inversin positive Ac. tubulin in Bbs6/ KM cells compared to control cells (f). Statistical analyses in e were performed from three independent experiments using two-tailed Mann–Whitney U test, where ***p < 0.001. Scale bars: c, d 10 µm
Fig. 5
Fig. 5
BBS proteins regulate key mediators of cilia disassembly. Quantitative real-time PCR shows increased gene expression of cilia disassembly components (HEF1 and HDAC6) and decreased expression of AurA relative to non-targeting control (NTC, red line) in serum-starved BBS8 or BBS6 knockdown (KD) hTERT-RPE1 cells. GAPDH was used as housekeeping control (a). Western blots show a significant increase in protein levels of HDAC6 upon KD of BBS8 and BBS6 in serum-starved hTERT-RPE1 cells (b, c). Conversely, AurA protein levels were decreased upon KD of BBS8 and BBS6 in serum-starved hTERT-RPE1 cells, although pAurA levels were retained (d, e) suggesting an increased ratio of active over total AurA. Flow cytometry analysis was used to further quantify AurA expression in serum-starved BBS8 and BBS6 KD hTERT-RPE1 cells (f, g). Representative flow cytometry dot plots show the AurA-positive cell population (P3, blue) and AurA-negative cell population (P2, red) (f). Quantification of the AurA-positive cell population confirmed a significant decrease in the BBS8 and BBS6 KD cells compared to NTC (g). Western blots show that KD of BBS8 in hTERT-RPE1 cells leads to decreased level of HEF1, which was partially restored by treatment with proteasome inhibitor MG132 (h). An 8-fold increase in HEF1 protein expression was observed upon BBS8 KD compared to 3.7-fold in NTC. Decreased protein levels of AurA in BBS8 KD hTERT-RPE1 cells were also partially restored by treatment with proteasome inhibitor MG132 (i). Increased levels of HDAC6 in BBS8 KD hTERT-RPE1 cells were concomitant with an increase in acetylated α-tubulin and were reduced upon treatment with HDAC6 inhibitor tubacin, as quantified by Western blot (j). Quantification of Western blot data was normalized to GAPDH levels. Bar charts show relative protein expression in arbitrary units (AU). Data are expressed as mean ± SD, n = 3 separate experiments for (a-g), while n = 2 for h-j. Statistical analyses in c, g were done using the Dunnett’s multiple comparison test and e using Shidak’s multiple comparison test. In c, e and g *p ≤ 0.05; **p ≤ 0.01; ***p ≤ 0.001; ns not significant. KD Knockdown, NTC non-targeting control, SS serum-starved, FC fold change, FSC-A forward scatter area
Fig. 6
Fig. 6
Inhibition of ciliary disassembly components rescues BBS mediated ciliary disassembly. Representative immunofluorescence images of cilia stained with antibodies against acetylated α-tubulin (Ac.tubulin, red) and Arl13b (green), from non-targeting control (NTC), BBS8 and BBS6 knockdown (KD) hTERT-RPE1 cells treated with and without HDAC6 inhibitor, tubacin (a). Quantification of ciliary length show that tubacin treatment did not affect ciliary length in control, yet was able to increase ciliary length in BBS8 and BBS6 KD cells (b). Quantification of ciliated cells showed that treatment with tubacin had no effect on ciliation (c). Treatment with AurA inhibitor I was also able to significantly increase ciliary length in BBS8 and BBS6 KD cells. BBS8 and BBS6 KD tubacin-treated cells show a greater increase in cilia length in comparison to their DMSO mock-treated counterparts, while control cells showed minimal increase (d, e). KD of HEF1 increased ciliary length in control hTERT-RPE1 cells. Double KD of HEF1 and BBS8 or BBS6 was able to reverse the ciliary disassembly phenotype observed in BBS8 or BBS6 KD (f, g). A model showing the inhibition or KD of ciliary disassembly components causes rescue of cilia length in BBS KD hTERT-RPE1 cells (h). Statistical analyses in b, c, e, g were done using the Sidak’s multiple comparison test from two independent experiments. The length of at least 1000 cilia from the six different treatment groups (NTC treated, untreated, BBS8/6 KD treated, untreated) in each experiment (Tubacin treatment, AurA treatment and Hef1 KD) were measured. *p ≤ 0.05; **p ≤ 0.01; ***p ≤ 0.001; ns not significant. KD Knockdown, NTC non-targeting control, SS serum-starved
Fig. 7
Fig. 7
BBS-mediated regulation of ciliary disassembly components alters post-translational modification of β-catenin. Western blot analysis and quantification show reduced acetylation of β-catenin at K49 (a) and consequently reduced phosphorylation at p41/44 (b) and p33/37/41 (c) upon BBS8 and BBS6 knockdown (KD) in hTERT-RPE1 cells, suggesting an increase in stable and active β-catenin. Immunocytochemistry and quantification using an antibody against acetylated β-catenin K49 (green) show reduced expression in the nucleus upon BBS8 and BBS6 KD compared to non-targeting control (NTC) in hTERT-RPE1 cells (d). Cells were co-labeled with Arl13b (red) to confirm reduction in ciliary length. Reduced β-catenin K49 expression could be rescued by treatment with HDAC6 inhibitor tubacin (n ≥ 100 for each group) (d, e). Immunocytochemistry using an antibody against β-catenin pS33/37/T41 (green), a target of β-catenin acetylation, shows expression at the base of the cilium and in the nucleus in NTC hTERT-RPE1 cells (f, g). Ciliary axoneme is marked by acetylated α-tubulin (Ac. tubulin, red), and the basal body by Pericentrin 2 (PCNT2, magenta). Quantification confirms reduced localization of β-catenin pS33/37/T41 at the basal body upon BBS8 and BBS6 KD (g). BBS8 and BBS6 KD cause less β-catenin degradation, resulting in increased levels of total β-catenin in hTERT-RPE1 cells, as quantified from Western blot (h, i). This was confirmed by a TCF/LEF luciferase activity assay that measures the transcriptional activity of β-catenin enzymatically. Luciferase activity in Wnt3a-treated non-targeting control HEK cells is upregulated compared to the untreated control. The Wnt response (luciferase activity) is significantly enhanced upon the suppression of BBS8 and BBS6 (j). Immunofluorescence analysis and quantification show increased stability and nuclear translocation of active β-catenin pS552 (green) in non-ciliated hTERT-RPE1 cells after BBS8 KD (n = 263 for NTC and 100 for BBS8 KD) (k, l). Cells were co-labeled with Ac. tubulin (green) to confirm reduction in ciliary length. Quantification of Western blot data was normalized to GAPDH levels. Bar charts in ac show relative protein expression in arbitrary units (A.U.). Data in a, b, c, i, j are expressed as mean ± SD, n = 3 separate experiments. Data in g show mean ± SD, two independent experiments. Statistical analyses in a, b, c, g, i were done using the Dunnett’s multiple comparison test. Data analyses in e, j, k were performed using Sidak’s multiple comparison test. p ≤ 0.05; **p ≤ 0.01; ***p ≤ 0.001; ns not significant. Scale bars: a, e 10 µm; b 2 µm; h 5 µm
Fig. 8
Fig. 8
Model of BBS-mediated regulation of ciliary disassembly. BBS proteins interact with Inversin and regulate its expression at the base of the cilium. Inversin inhibits HEF1/AurA, inactivating histone deacetylase HDAC6 thus preventing ciliary disassembly. As a consequence of dormant HDAC6, β-catenin remains acetylated and phosphorylated, thereby undergoing proteasomal degradation. Upon BBS suppression, Inversin expression decreases at the base of the cilium. This leads to phosphorylation and activation of AurA via HEF1, resulting in upregulation and activation of HDAC6. HDAC6 deacetylates β-catenin, hence preventing further phosphorylation and degradation. Consequently, β-catenin is stabilized and translocates to the nucleus activating canonical Wnt signaling. This also regulates ciliary length

References

    1. Ross AJ, et al. Disruption of Bardet–Biedl syndrome ciliary proteins perturbs planar cell polarity in vertebrates. Nat Genet. 2005;37:1135–1140. doi: 10.1038/ng1644. - DOI - PubMed
    1. Schneider L, et al. PDGFRαα signaling is regulated through the primary cilium in fibroblasts. Curr Biol. 2005;15:1861–1866. doi: 10.1016/j.cub.2005.09.012. - DOI - PubMed
    1. Goetz SC, Anderson KV. The primary cilium: a signalling centre during vertebrate development. Nat Rev Genet. 2010;11:331–344. doi: 10.1038/nrg2774. - DOI - PMC - PubMed
    1. May-Simera HL, Kelley MW. Cilia, Wnt signaling, and the cytoskeleton. Cilia. 2012;1:7. doi: 10.1186/2046-2530-1-7. - DOI - PMC - PubMed
    1. Wheatley DN, Wang AM, Strugnell GE. Expression of primary cilia in mammalian cells. Cell Biol Int. 1996;20:73–81. doi: 10.1006/cbir.1996.0011. - DOI - PubMed

MeSH terms