Clinical Trial
. 2019 Apr;105(4):943-953.
doi: 10.1002/cpt.1303. Epub 2019 Jan 18.

Assessment of Multi-Ion Channel Block in a Phase I Randomized Study Design: Results of the CiPA Phase I ECG Biomarker Validation Study

Affiliations
Clinical Trial

Assessment of Multi-Ion Channel Block in a Phase I Randomized Study Design: Results of the CiPA Phase I ECG Biomarker Validation Study

Jose Vicente et al. Clin Pharmacol Ther. 2019 Apr.

Abstract

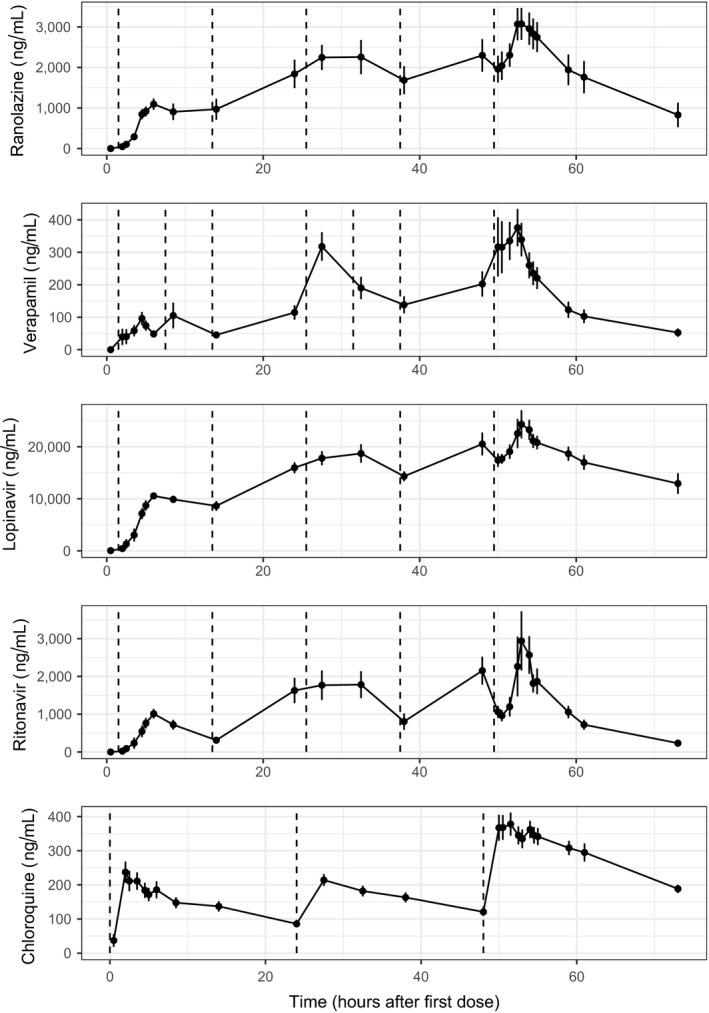
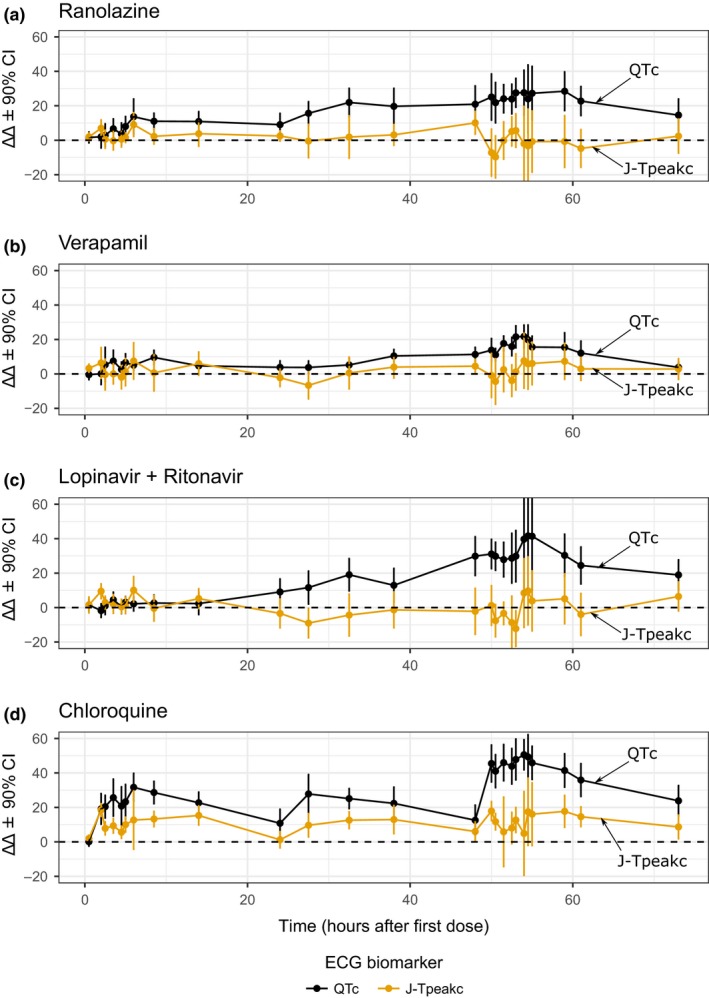
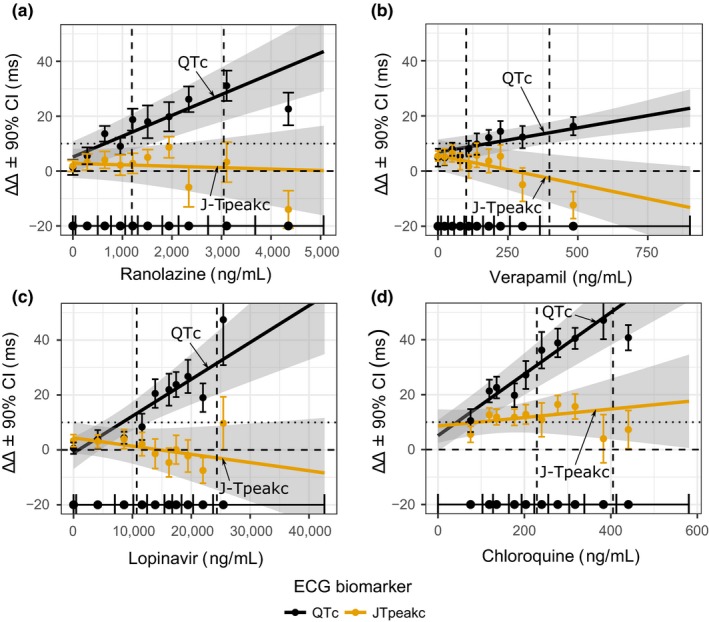
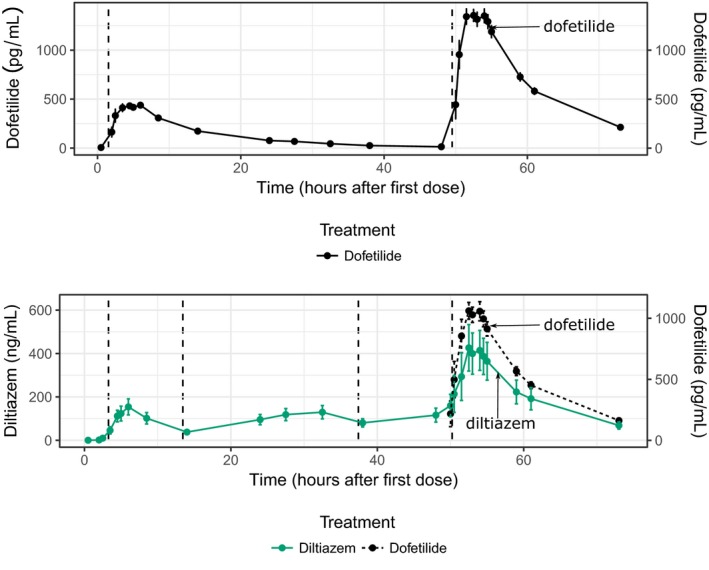
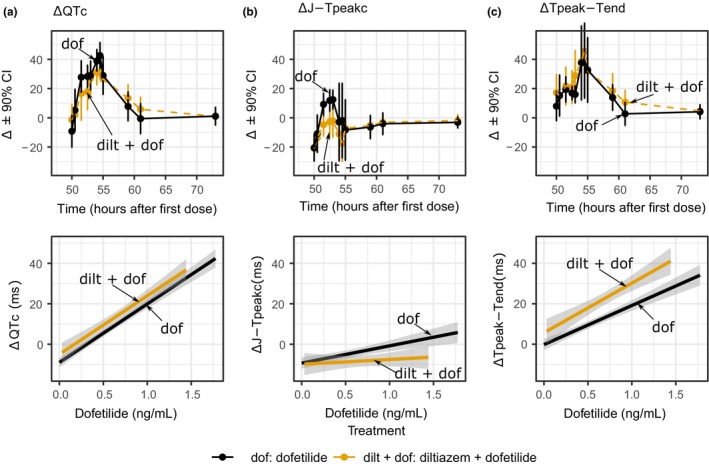
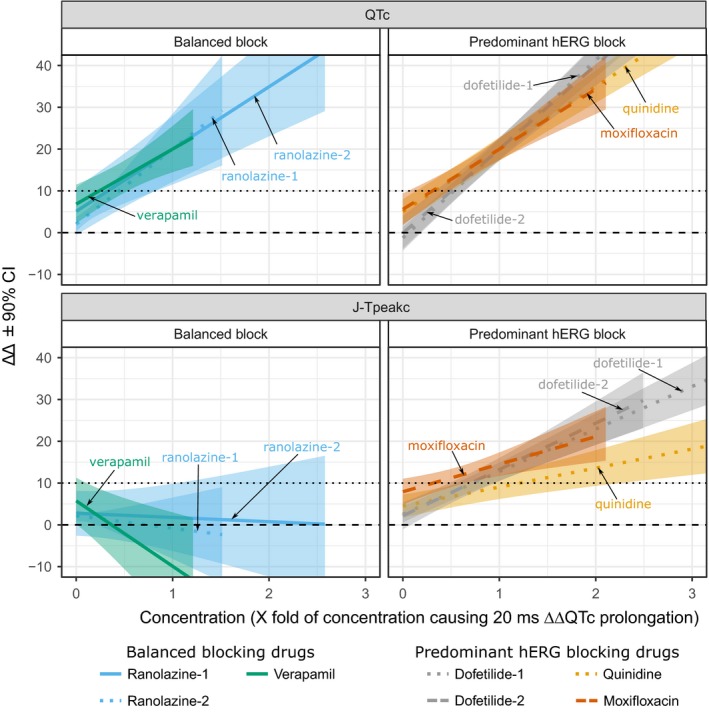
Balanced multi-ion channel-blocking drugs have low torsade risk because they block inward currents. The Comprehensive In Vitro Proarrhythmia Assay (CiPA) initiative proposes to use an in silico cardiomyocyte model to determine the presence of balanced block, and absence of heart rate corrected J-Tpeak (J-Tpeak c) prolongation would be expected for balanced blockers. This study included three balanced blockers in a 10-subject-per-drug parallel design; lopinavir/ritonavir and verapamil met the primary end point of ΔΔJ-Tpeak c upper bound < 10 ms, whereas ranolazine did not (upper bounds of 8.8, 6.1, and 12.0 ms, respectively). Chloroquine, a predominant blocker of the potassium channel encoded by the ether-à-go-go related gene (hERG), prolonged ΔΔQTc and ΔΔJ-Tpeak c by ≥ 10 ms. In a separate crossover design, diltiazem (calcium block) did not shorten dofetilide-induced ΔQTc prolongation, but shortened ΔJ-Tpeak c and prolonged ΔTpeak -Tend . Absence of J-Tpeak c prolongation seems consistent with balanced block; however, small sample size (10 subjects) may be insufficient to characterize concentration-response in some cases.

Trial registration: ClinicalTrials.gov NCT03070470.


Conflict of interest statement

P.T.S. has consulting agreements with Biomedical Systems, Charles River, and iCardiac. The other authors report no conflicts of interest.

Figures

Figure 1
Figure 1
Part 1 pharmacokinetic (PK) time profiles. Mean (dots) and standard error (error bars) of PK plasma concentration profiles for ranolazine, verapamil, lopinavir, ritonavir, and chloroquine per timepoint after first dose on day 1. Dashed vertical lines show the time of active treatment doses for ranolazine (1,500 mg after breakfast and in the evening), verapamil (120 mg immediate release after breakfast and in the afternoon, 240 mg extended release in the evening), lopinavir/ritonavir (lopinavir 800 mg/ritonavir 200 mg after breakfast and in the evening), and chloroquine (1,000 mg day 1, 500 mg day 2, and 1,000 mg day 3, all before breakfast). Oral placebo was administered at dosing timepoints that had no active treatment dosing as well as throughout all the dosing timepoints in the placebo treatment arm (not shown).
Figure 2
Figure 2
Part 1 pharmacodynamic time profiles. Drug‐induced changes (mean ± 90% confidence interval (CI)) for the placebo‐corrected change from baseline (ΔΔ) of heart rate corrected QT (QTc) (black) and heart rate corrected J‐Tpeak (J‐Tpeakc) (orange) for (a) ranolazine, (b) verapamil, (c) lopinavir/ritonavir, and (d) chloroquine. Horizontal dashed line corresponds with 0 ms. The y‐axis range of each panel has been adjusted to enhance interpretation. See electrocardiogram (ECG) analysis report in the Supplementary Material S1 for plots with full free‐scale y‐axis range including Tpeak‐Tend.
Figure 3
Figure 3
Part 1 concentration‐response plots. Predicted drug‐induced placebo‐corrected changes from baseline (ΔΔ) using concentration‐response models for heart rate corrected QT (QTc) (black) and heart rate corrected J‐Tpeak (J‐Tpeakc) (orange) for (a) ranolazine, (b) verapamil, (c) lopinavir/ritonavir, and (d) chloroquine. The solid line with gray shaded area denotes the model‐predicted mean placebo‐adjusted ΔΔ with 90% confidence interval (CI) as a function of concentration. Horizontal solid line with tick marks show the range of plasma concentrations divided into deciles. Vertical error bars denote the observed means and 90% CI for the ΔΔ within each plasma concentration decile. Vertical dashed lines correspond with population average maximum concentration (Cmax) on days 1 (low Cmax) and 3 (high Cmax). Horizontal dashed and dotted lines correspond with 0 ms and 10 ms ΔΔ, respectively. The y‐axis range of each panel has been adjusted to enhance interpretation. See electrocardiogram (ECG) analysis report in Supplementary Material S1 for plots with full free‐scale y‐axis range as well as other ECG measurements.
Figure 4
Figure 4
Part 2 pharmacokinetic (PK) time profiles. Mean (dots) and standard error (error bars) of PK plasma concentration profiles per timepoint after first dose on day 1 for dofetilide by itself (top panel) and for diltiazem + dofetilide combination (bottom panel). Bottom panel shows diltiazem concentration (left y‐axis, green solid lines) and dofetilide (right y‐axis, black dashed line). Dosing times were in the morning (after breakfast) and in the evening of days 1 and 2, and after breakfast in the morning of day 3. Dashed vertical lines show the time of active treatment doses for dofetilide (0.125 and 0.375 mg after breakfast on days 1 and 3, respectively, of dofetilide alone period, and 0.25 mg after breakfast on day 3 in the diltiazem + dofetilide period) and diltiazem (120 mg immediate release after breakfast on days 1 and 3, and 240 mg in the evening of days 1 and 2). Oral placebo was administered at dosing timepoints matching part 1 and that had no active treatment dosing (not shown).
Figure 5
Figure 5
Part 2 pharmacodynamic time‐profiles and concentration‐response linearity plots. Top row panels show drug‐induced changes (mean ± 90% confidence interval (CI)) for the change from baseline (Δ) of (a) heart rate corrected QT (QTc), (b) heart rate corrected J‐Tpeak (J‐Tpeakc), and (c) Tpeak‐Tend on day 3 of dofetilide alone (black) and diltiazem + dofetilide (orange) treatments. The y‐axis range of each panel has been adjusted to enhanced interpretation. Bottom row panels show exploratory plots with linear regression fit through all the data for dofetilide alone (black) and diltiazem + dofetilide (orange) for drug‐induced Δ in (a) QTc, (b) J‐Tpeakc, and (c) Tpeak‐Tend. Note that there is no change in ΔQTc prolongation associated with dofetilide (hERG block) when diltiazem (calcium block) is co‐administered. See Supplementary Material S1 for full time profiles as well as concentration‐response plots of dofetilide (hERG block) vs. dofetilide + diltiazem (hERG + calcium) vs. dofetilide + mexiletine (hERG + late sodium).
Figure 6
Figure 6
Heart rate corrected QT (ΔΔQTc) and heart rate corrected J‐Tpeak (ΔΔJ‐Tpeakc) concentration‐response for several predominant hERG and balanced ion channel‐blocking drugs. As concentration of drug increases, balanced blockers prolong ΔΔQTc (top left) without prolonging ΔΔJ‐Tpeakc (bottom left), but predominant hERG blockers prolong both ΔΔQTc (top right) and ΔΔJ‐Tpeakc (bottom right). Plots show mean (color lines) and 90% confidence intervals (CIs) (shade areas) predictions for drug‐induced baseline‐corrected and placebo‐corrected changes in QTc (ΔΔQTc, y‐axis, top panels) and ΔΔJ‐Tpeakc (y‐axis, bottom panels) vs. drug concentration (x‐axis) from concentration‐response models. Before plotting, each drug concentration was normalized to the concentration that caused 20 ms ΔΔQTc prolongation in its corresponding study. Balanced blockers shown include ranolazine (hERG + late sodium; blue), and verapamil (hERG + calcium; green). Predominant hERG blockers shown are dofetilide (gray), moxifloxacin (dark orange), and quinidine (light orange). Data from this study for multiple dosing of ranolazine (ranolazine‐2) and verapamil (solid lines) and from two prior studies with single oral dose design (ranolazine‐1, dofetilide‐1, and quinidine from Johannesen et al.15 dashed lines; dofetilide‐2 and moxifloxacin from Johannesen et al.17 dotted lines). Chloroquine and lopinavir/ritonavir not shown because poor fit of concentration‐response linear models did not allow for reliable predictions of ΔΔJ‐Tpeakc (chloroquine) and ΔΔQTc (lopinavir/ritonavir). Black horizontal lines show 0 ms (dashed) and 10 ms (dotted) thresholds for QTc (top panels) and ΔΔJ‐Tpeakc (bottom panels). Ranges of x‐ and y‐axes adjusted to facilitate comparison.

References

    1. International Council on Harmonisation . ICH topic S7B the nonclinical evaluation of the potential for delayed ventricular repolarization (QT interval prolongation) by human pharmaceuticals <http://www.ich.org/fileadmin/Public_Web_Site/ICH_Products/Guidelines/Saf...> (2005). - PubMed
    1. International Council on Harmonisation . Guideline for industry E14 clinical evaluation of QT/QTc interval prolongation and proarrhythmic potential for non‐antiarrhythmic drugs <https://www.ich.org/fileadmin/Public_Web_Site/ICH_Products/Guidelines/Ef...> (2005). - PubMed
    1. January, C.T. & Riddle, J.M. Early afterdepolarizations: mechanism of induction and block. A role for L‐type Ca2+ current. Circ. Res. 64, 977–990 (1989). - PubMed
    1. Duff, H.J. , Roden, D. , Primm, R.K. , Oates, J.A. & Woosley, R.L. Mexiletine in the treatment of resistant ventricular arrhythmias: enhancement of efficacy and reduction of dose‐related side effects by combination with quinidine. Circulation 67, 1124–1128 (1983). - PubMed
    1. Duff, H. , Mitchell, B. , Manyari, D. & Wyse, G. Mexiletine‐quinidine combination: electrophysiologic correlates of a favorable antiarrhythmic interaction in humans. J. Am. Coll. Cardiol. 10, 1149–1156 (1987). - PubMed

Publication types

MeSH terms

Associated data