

A SGLT2 inhibitor dapagliflozin suppresses prolonged ventricular-repolarization through augmentation of mitochondrial function in insulin-resistant metabolic syndrome rats
- PMID: 30447687
- PMCID: PMC6240275
- DOI: 10.1186/s12933-018-0790-0
A SGLT2 inhibitor dapagliflozin suppresses prolonged ventricular-repolarization through augmentation of mitochondrial function in insulin-resistant metabolic syndrome rats
Abstract
Background: Metabolic syndrome (MetS) is a prevalent risk factor for cardiac dysfunction. Although SGLT2-inhibitors have important cardioprotective effects in hyperglycemia, their underlying mechanisms are complex and not completely understood. Therefore, we examined mechanisms of a SGLT2-inhibitor dapagliflozin (DAPA)-related cardioprotection in overweight insulin-resistant MetS-rats comparison with insulin (INSU), behind its glucose-lowering effect.
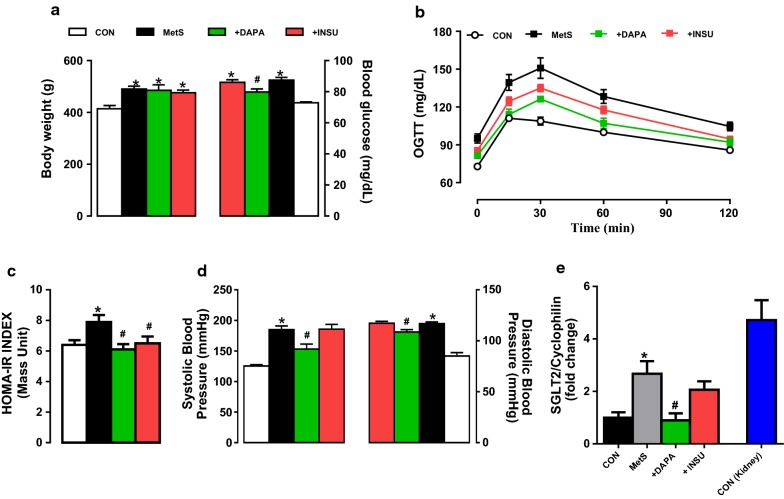
Methods: A 28-week high-carbohydrate diet-induced MetS-rats received DAPA (5 mg/kg), INSU (0.15 mg/kg) or vehicle for 2 weeks. To validate MetS-induction, we monitored all animals weekly by measuring body weight, blood glucose and HOMO-IR index, electrocardiograms, heart rate, systolic and diastolic pressures.
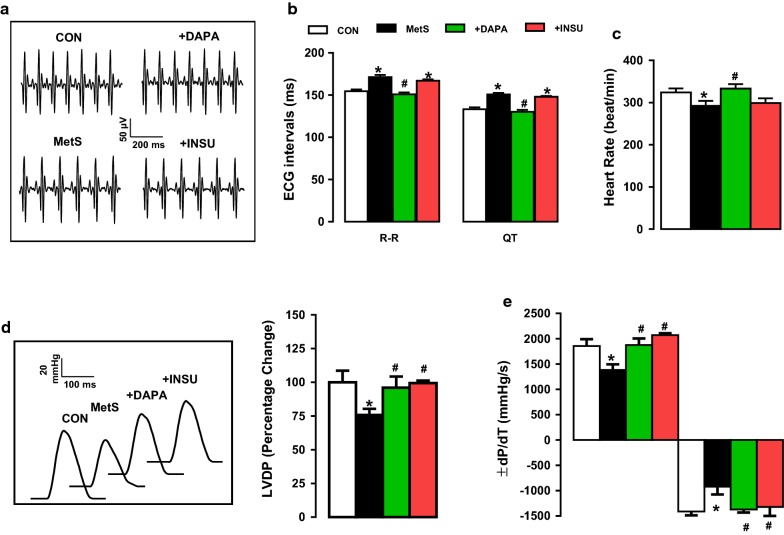
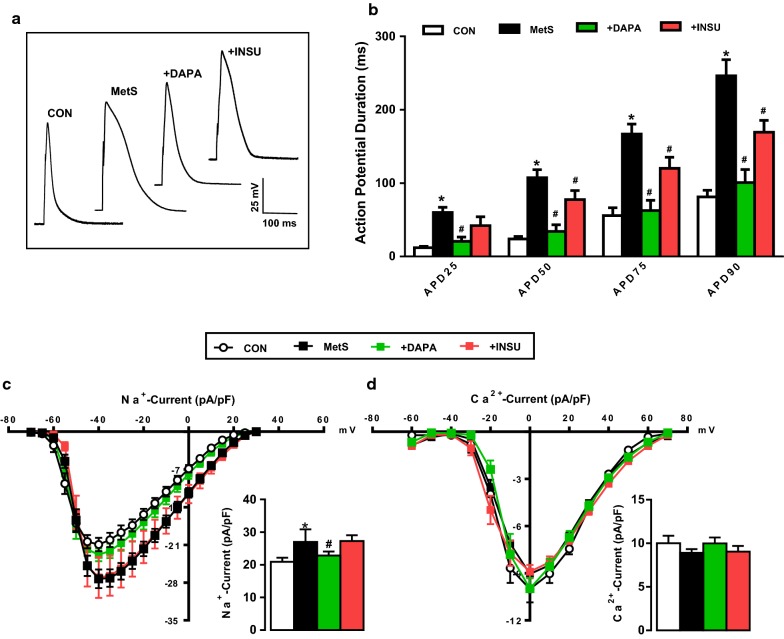
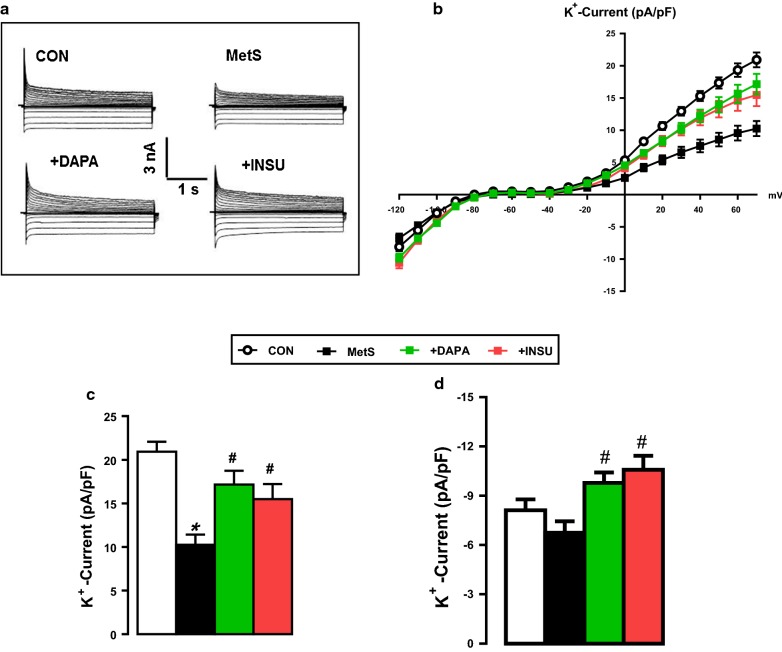
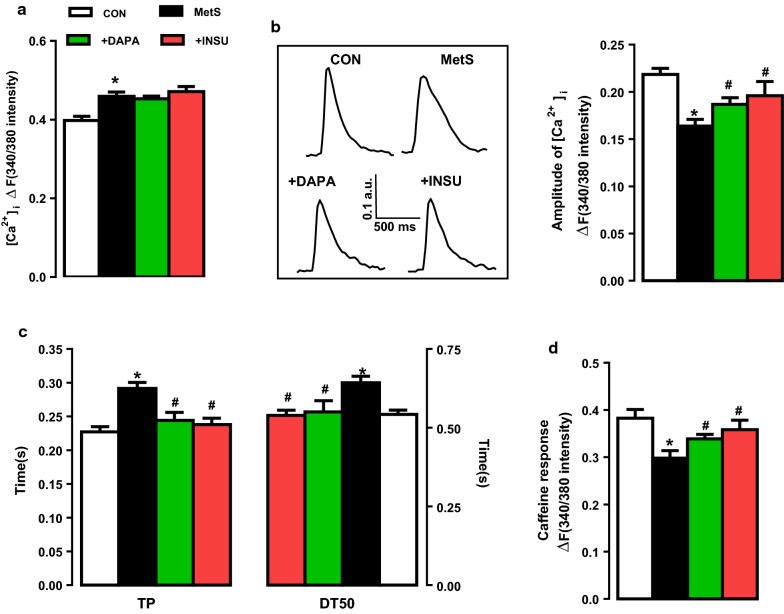
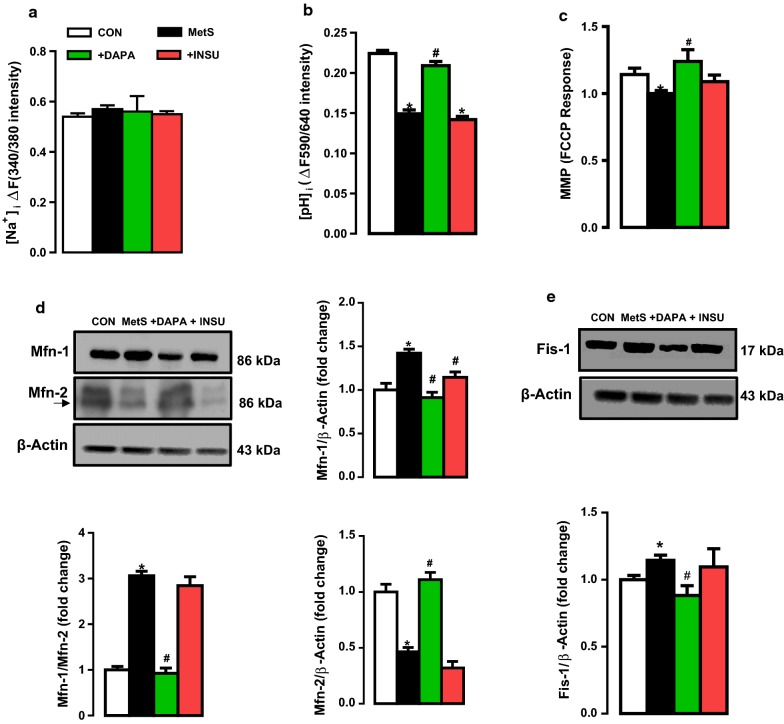
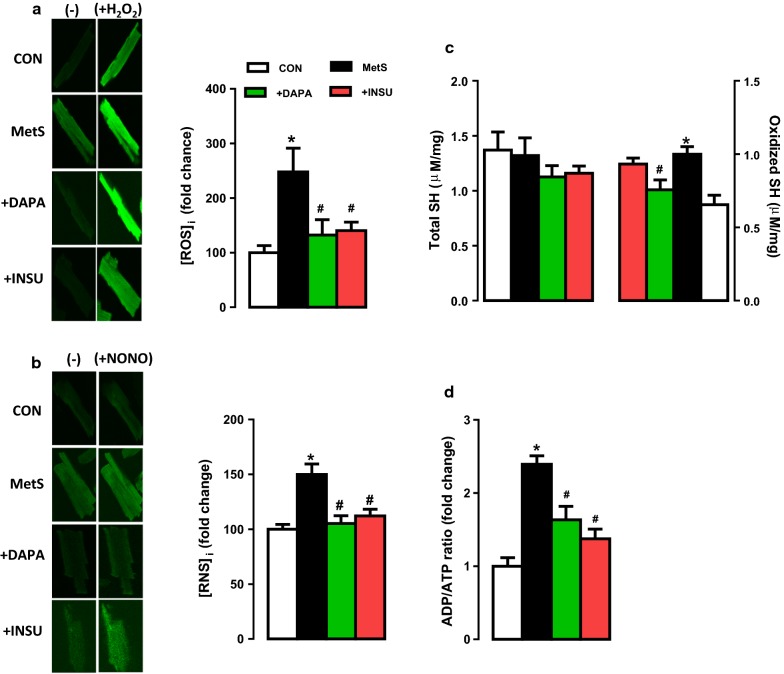
Results: DAPA-treatment of MetS-rats significantly augmented the increased blood pressure, prolonged Q-R interval, and low heart rate with depressed left ventricular function and relaxation of the aorta. Prolonged-action potentials were preserved with DAPA-treatment, more prominently than INSU-treatment, at most, through the augmentation in depressed voltage-gated K+-channel currents. DAPA, more prominently than INSU-treatment, preserved the depolarized mitochondrial membrane potential, and altered mitochondrial protein levels such as Mfn-1, Mfn-2, and Fis-1 as well as provided significant augmentation in cytosolic Ca2+-homeostasis. Furthermore, DAPA also induced significant augmentation in voltage-gated Na+-currents and intracellular pH, and the cellular levels of increased oxidative stress, protein-thiol oxidation and ADP/ATP ratio in cardiomyocytes from MetS rats. Moreover, DAPA-treatment normalized the increases in the mRNA level of SGLT2 in MetS-rat heart.
Conclusions: Overall, our data provided a new insight into DAPA-associated cardioprotection in MetS rats, including suppression of prolonged ventricular-repolarization through augmentation of mitochondrial function and oxidative stress followed by improvement of fusion-fission proteins, out of its glucose-lowering effect.
Keywords: Diabetes; Electrophysiology; Heart function; Insulin resistance; Oxidative stress; SGLT2 inhibitors.
Figures
Similar articles
-
A sodium-glucose cotransporter 2 (SGLT2) inhibitor dapagliflozin comparison with insulin shows important effects on Zn2+-transporters in cardiomyocytes from insulin-resistant metabolic syndrome rats through inhibition of oxidative stress 1.Can J Physiol Pharmacol. 2019 Jun;97(6):528-535. doi: 10.1139/cjpp-2018-0466. Epub 2018 Nov 16. Can J Physiol Pharmacol. 2019. PMID: 30444646
-
Acute dapagliflozin administration exerts cardioprotective effects in rats with cardiac ischemia/reperfusion injury.Cardiovasc Diabetol. 2020 Jun 15;19(1):91. doi: 10.1186/s12933-020-01066-9. Cardiovasc Diabetol. 2020. PMID: 32539724 Free PMC article.
-
Titin and CK2α are New Intracellular Targets in Acute Insulin Application-Associated Benefits on Electrophysiological Parameters of Left Ventricular Cardiomyocytes From Insulin-Resistant Metabolic Syndrome Rats.Cardiovasc Drugs Ther. 2020 Aug;34(4):487-501. doi: 10.1007/s10557-020-06974-2. Cardiovasc Drugs Ther. 2020. PMID: 32377826
-
Empagliflozin, a sodium-glucose cotransporter inhibitor enhancing mitochondrial action and cardioprotection in metabolic syndrome.J Cell Physiol. 2024 Jun;239(6):e31264. doi: 10.1002/jcp.31264. Epub 2024 May 19. J Cell Physiol. 2024. PMID: 38764242 Review.
-
SGLT2 inhibitors and cardioprotection: a matter of debate and multiple hypotheses.Postgrad Med. 2019 Mar;131(2):82-88. doi: 10.1080/00325481.2019.1581971. Postgrad Med. 2019. PMID: 30757937 Review.
Cited by
-
SGLT2 Inhibitors in Aging-Related Cardiovascular Disease: A Review of Potential Mechanisms.Am J Cardiovasc Drugs. 2023 Nov;23(6):641-662. doi: 10.1007/s40256-023-00602-8. Epub 2023 Aug 24. Am J Cardiovasc Drugs. 2023. PMID: 37620652 Review.
-
Dapagliflozin attenuates hypoxia/reoxygenation-caused cardiac dysfunction and oxidative damage through modulation of AMPK.Cell Biosci. 2021 Feb 26;11(1):44. doi: 10.1186/s13578-021-00547-y. Cell Biosci. 2021. PMID: 33637129 Free PMC article.
-
Shensong Yangxin Protects Against Metabolic Syndrome-Induced Ventricular Arrhythmias by Inhibiting Electrical Remodeling.Front Pharmacol. 2020 Jul 9;11:993. doi: 10.3389/fphar.2020.00993. eCollection 2020. Front Pharmacol. 2020. PMID: 32733242 Free PMC article.
-
Implications of SGLT Inhibition on Redox Signalling in Atrial Fibrillation.Int J Mol Sci. 2021 May 31;22(11):5937. doi: 10.3390/ijms22115937. Int J Mol Sci. 2021. PMID: 34073033 Free PMC article. Review.
-
Empagliflozin prevents doxorubicin-induced myocardial dysfunction.Cardiovasc Diabetol. 2020 May 15;19(1):66. doi: 10.1186/s12933-020-01040-5. Cardiovasc Diabetol. 2020. PMID: 32414364 Free PMC article.
References
Publication types
MeSH terms
Substances
Grants and funding
LinkOut - more resources
Full Text Sources
Medical
Miscellaneous
